2980
Evaluation of Normalization Methods for apparent Myelin Water Fraction Measurements at Ultra High Field1Cleveland Clinic, Cleveland, OH, United States, 2Hankuk University of Foreign Studies, Seoul, Korea, Republic of
Synopsis
Keywords: Multiple Sclerosis, Brain
Motivation: Multiple sclerosis (MS) is characterized by demyelination of the central nervous system. Ultra High Field (UHF) MRI can reveal CNS pathology that is not apparent on conventional MRI in MS patients, but options for measuring myelin density are limited.
Goal(s): Calculation of MWF using ViSTa map requires intensity normalization. We evaluate normalization approaches for visualization of short transverse relaxation time component (ViSTa), a semiquantitative measure of apparent myelin water fraction (aMWF).
Approach: We compare two types of normalization scan - a turboflash (TFL) and a gradient recalled echo (GRE) on MS patients.
Results: We find that normalization with GRE provides better conspicuity of lesions.
Impact: Characterization of myelin density has the potential to supplement UHF approaches to evaluating MS.
Introduction
Multiple sclerosis (MS) is characterized by inflammatory demyelination of the central nervous system.1 UHF can reveal CNS pathology that is not apparent on conventional MRI in MS patients2, but measures of myelin density are lacking due to intense radiofrequency power requirements of approaches such as multiecho myelin water fraction3 and magnetization transfer ratio (MTR). Direct visualization of short transverse relaxation time component (ViSTa) is a semiquantitative measure of apparent myelin water fraction (aMWF).4 Calculation of aMWF using ViSTa requires intensity normalization. Here, we compare two types of normalization scan - a turboflash (TFL) and a gradient recalled echo (GRE) in terms of conspicuity of white matter lesions and in terms of gray matter/white matter contrast.Methods
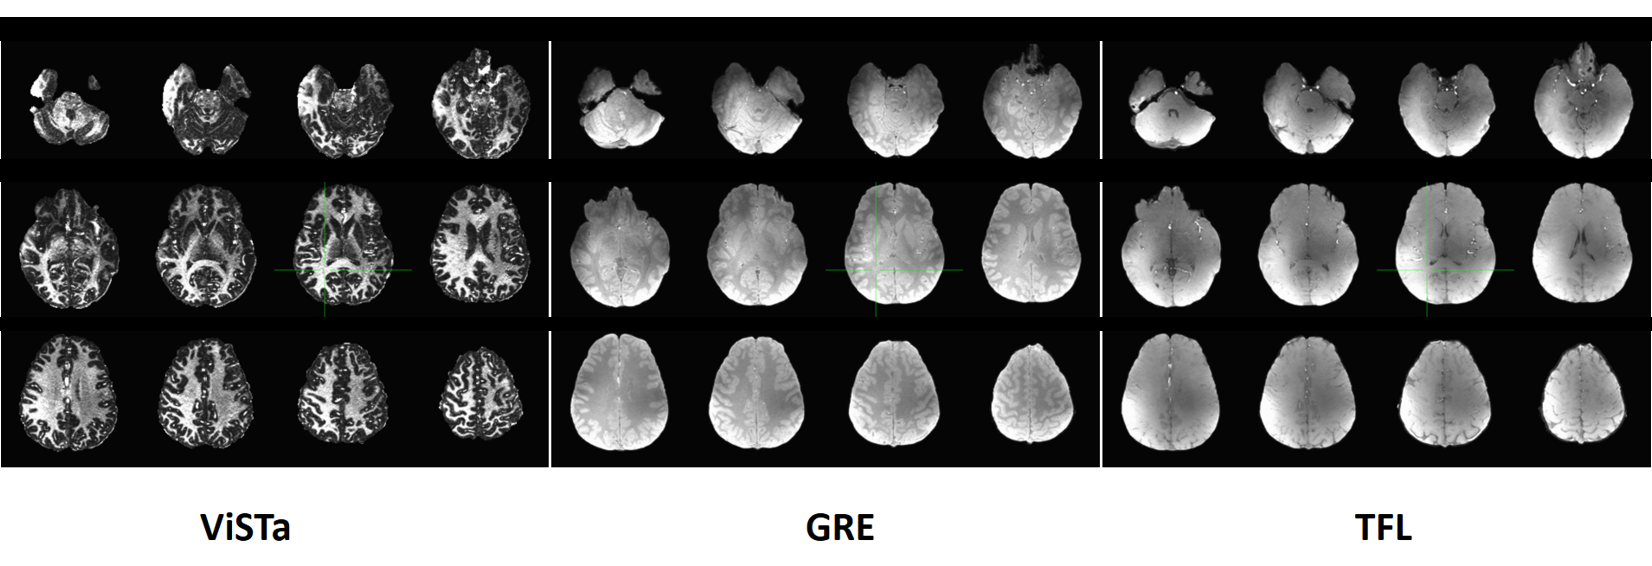
Three MS patients were scanned on a Siemens 7T Terra with a standard 32 channel head coil (Siemens Healthiners, Erlangen). A whole brain ViSTa image (1 × 1 × 1 mm, TE = 1.73 ms, TR = 2960 ms, flip angle for excitation = 7°) was acquired along with two normalization scans, a TFL (1 × 1 × 1 mm, TE =1.73 ms, TR = 1000 ms, flip angle for excitation = 7°) and a GRE (1 × 1 × 1 mm, TE = 3.01 ms, TR = 15 ms, flip angle for excitation = 5°). An MP2RAGE image5 (0.71 mm isotropic) was also acquired. Direct registration of images to the ViSTa images is difficult because of low SNR and poor contrast. Therefore, we used a multi-step process. TFL and GRE normalization images were coregistered to the MP2RAGE by antsRegistrationSyn.sh/ANTs6 and bbregister/freesurfer7, respectively, due to difference in contrast of TFL and GRE images. The MP2RAGE was then coregistered to the ViSTa map with antsRegistrationSyn.sh/ANTs. The transforms were then concatenated to place the normalization images into the space of the ViSTa map. Therefore, two sets of aMWF maps are generated – a ViSTa map based on TFL normalization (ViSTa/GRE) and ViSTa map based on GRE normalization (ViSTa/TFL). GM/WM contrast was compared by calculating an overall test statistic, d = ((mean WM intensity) – (mean GM intensity)) / (pooled standard deviation in WM and GM) for each subject, and performing a paired t-test using MATLAB (the Mathworks, Natick). For the GM/WM contrast comparison, ViSTa maps from 5 subjects without MS were included. WM and GM masks were generated using FreeSurfer from the MP2RAGE images and coregistered to the ViSTa maps using the transforms described above.Results
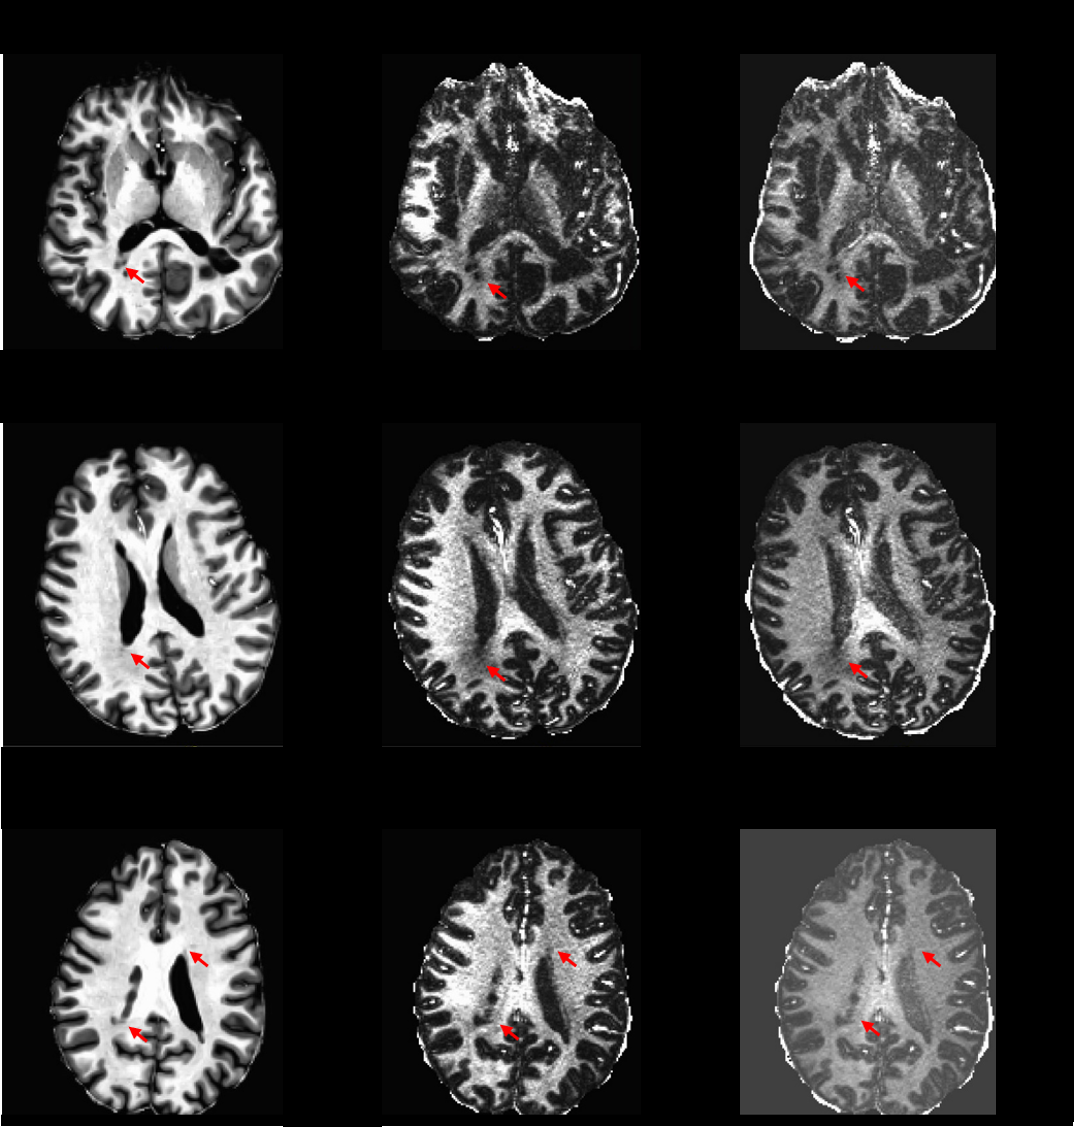
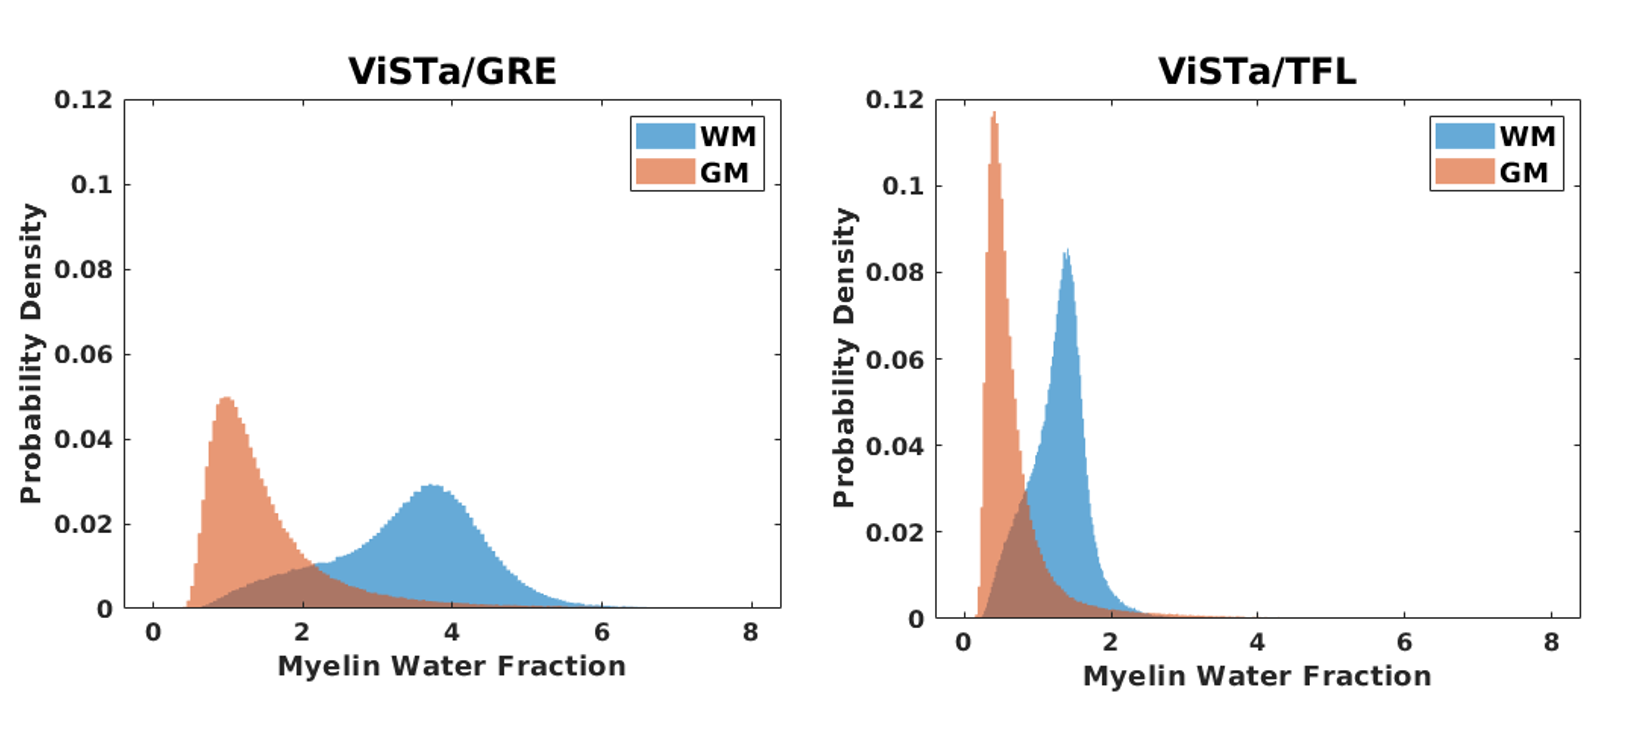
Figure 1 shows an example of one subject's raw ViSTa, GRE and TFL images. Figure 2 compares lesions from each of the three subjects. Lesions and subtle signal changes that may reflect demyelination are more conspicuous on ViSTa/GRE, but signal uniformity across the slice is better on ViSTa/FLASH. Figure 3 shows histograms of WM and GM intensity from one subject. GM/WM intensities show greater separation with ViSTa/GRE than for ViSTa/TFL. A paired t-test showed that the GM/WM intensity was significantly higher for ViSTa/GRE than for ViSTa/TFL across all subjects (p < 0.0006).Discussion
In MS, UHF MRI imaging has been investigated to identify cortical lesions8, the central vein sign9 and paramagnetic rim lesions10. Quantitative T1 at UHF has been proposed as means for identifying remyelination, partly due to limited availability of more-established methods for assessing myelination, such as multi-echo MWF and MTR. The results here show that there is a tradeoff between contrast and signal uniformity. Contrast may be more important when assessing focal lesions while uniformity may be more important when assessing normal appearing white matter. Further study will be required to find an optimal balance between the two.Conclusions
We show progress in the technical implementation of aMWF measurements of ViSTa.Acknowledgements
We thank support from Kecheng Liu of Siemens Healthineers.References
1. McGinley, M. P., Goldschmidt, C. H. & Rae-Grant, A. D. Diagnosis and Treatment of Multiple Sclerosis: A Review. JAMA 2021; 325:765-779.
2. Kolb, H., Al-Louzi, O., Beck, E. S., Sati, P., Absinta, M. & Reich, D. S. From pathology to MRI and back: Clinically relevant biomarkers of multiple sclerosis lesions. Neuroimage Clin 2022; 36:103194.
3. MacKay, A., Whittall, K., Adler, J., Li, D., Paty, D. & Graeb, D. In vivo visualization of myelin water in brain by magnetic resonance. Magn Reson Med 1994; 31:673-677.
4. Oh, S. H., Bilello, M., Schindler, M., Markowitz, C. E., Detre, J. A. & Lee, J. Direct visualization of short transverse relaxation time component (ViSTa). Neuroimage 2013; 83:485-492.
5. Marques, J. P., Kober, T., Krueger, G., van der Zwaag, W., Van de Moortele, P. F. & Gruetter, R. MP2RAGE, a self bias-field corrected sequence for improved segmentation and T1-mapping at high field. Neuroimage 2010; 49:1271-1281.
6. Avants, B. B., Epstein, C. L., Grossman, M. & Gee, J. C. Symmetric diffeomorphic image registration with cross-correlation: evaluating automated labeling of elderly and neurodegenerative brain. Med Image Anal 2008; 12:26-41.
7. Greve, D. N. & Fischl, B. Accurate and robust brain image alignment using boundary-based registration. Neuroimage 2009; 48:63-72.
8. Mainero, C., Benner, T., Radding, A., van der Kouwe, A., Jensen, R., Rosen, B. R. & Kinkel, R. P. In vivo imaging of cortical pathology in multiple sclerosis using ultra-high field MRI. Neurology 2009; 73:941-948.
9. Sinnecker, T., Clarke, M. A., Meier, D., Enzinger, C., Calabrese, M., De Stefano, N., Pitiot, A., Giorgio, A., Schoonheim, M. M., Paul, F., Pawlak, M. A., Schmidt, R., Kappos, L., Montalban, X., Rovira, A., Evangelou, N., Wuerfel, J. & Group, M. S. Evaluation of the Central Vein Sign as a Diagnostic Imaging Biomarker in Multiple Sclerosis. JAMA Neurol 2019; 76:1446-1456.
10. Absinta, M., Sati, P., Schindler, M., Leibovitch, E. C., Ohayon, J., Wu, T., Meani, A., Filippi, M., Jacobson, S., Cortese, I. C. & Reich, D. S. Persistent 7-tesla phase rim predicts poor outcome in new multiple sclerosis patient lesions. J Clin Invest 2016; 126:2597-2609.
Figures