2979
T1mapping and MPRAGE for the characterisation of heterogeneous paramagnetic rim lesions and their clinical importance in MS1Neuroinflammation Imaging Lab, Université catholique de Louvain, Brussels, Belgium, 2ICTEAM Institute, Université catholique de Louvain, Louvain-la-Neuve, Belgium, 3Plateforme technologique de Support en Méthodologie et Calcul Statistique, Université catholique de Louvain, Brussels, Belgium, 4Pôle cellulaire et moléculaire, Université catholique de Louvain, Brussels, Belgium
Synopsis
Keywords: Multiple Sclerosis, Multiple Sclerosis
Motivation: Differentiation of Paramagnetic Rim Lesions, based on T1 values, could allow clinical stratification of patients.
Goal(s): To investigate PRL heterogeneity with quantitative T1 and normalised MPRAGE and the resulting impact on clinical outcomes.
Approach: White Matter lesions were segmented and categorised based on visual confidence of paramagnetic rim visibility and their T1 values. RF analyses was used to reveal impact of lesion types on clinical disability.
Results: Visibility of Rim+ lesions is correlated with increased T1 values. In a Random Forest Model, T1-derived long-T1 Rim+ lesions and number of short-T1 Rim+ lesions could predict clinical disability and clinical progression in next 12 months.
Impact: Characterisation of PRL heterogeneity, not only with advanced-quantitative imaging techniques but also with clinically available sequences, allows a better understanding of a patient's current clinical disability and progression over the next twelve months.
Background
Multiple Sclerosis (MS) Chronic Active Lesions (CAL), seen on susceptibility-based MRI as Paramagnetic Rim Lesions (PRL), are associated with increased clinical disability and tissue damage.1–3 However, histopathological studies and advanced MRI techniques show heterogeneity in terms of PRL-associated tissue damage.4 MRI sequences available in clinical practice, such as FLAIR or MPRAGE, lack quantitative estimation of tissue integrity. Here we characterise PRL heterogeneity with quantitative MPR2RAGE-derived T1 maps and normalised MPRAGE images to investigate the clinical importance of heterogeneous PRL.Methods
1736 white matter (WM) lesions in 106 MS patients were manually segmented on 3T 3D-EPI unwrapped-phase images3 and categorised based on visual confidence of paramagnetic rim (Rim) visibility: 1 – no paramagnetic Rim, 5 – very certain paramagnetic Rim. Lesion with visual confidence level rating ≥4 are considered Rim positive (Rim+). Normal appearing white matter (NAWM) was extracted with fsl_fast5 and MPRAGE images were z-score normalised based on the mean intensity of the NAWM. Lesion age was calculated from initial time point of gadolinium enhancement. Volume, normalised MPRAGE and MP2RAGE mean derived T1 times6 were calculated for each WM lesion. WM lesions were categorised in short and long T1 based on 75th quartile distribution cut off (CutOff) of overall T1 or normalised MPRAGE values, independently of their visual confidence level rating. Random Forrest analyses included Expanded Disability Severity Score (EDSS), age, disease modifying treatment type, total lesion, brain and thalamic volume, number of Rim+ lesions, number of long T1 lesions, number of long T1 Rim+ lesions, number of short T1 Rim+ lesions and number of gadolinium enhancing lesions. Delta EDSS was calculated at first follow-up within 10-18 months after baseline MRI.Results
446 lesions (25,6%) were categorised with rim visibility ≥4. Visibility of Rim+ lesions is correlated with increased T1 values (Spearman’s rho= 0,375, p < 0,0001) (Figure 1) and decreasing normalised MPRAGE values (Spearman’s rho = 0,347, p<0,0001) (Figure 2). T1 values and normalised MPRAGE show significant negative relationship (p<0,0001, R2 = 0,686) (Figure 3 D). T1 and normalised MPRAGE high T1 CutOff was calculated at 1572ms (Figure 3 A) and -3,32STD (Figure 3 C) respectively. T1 and normalised MPRAGE categorisation of WM lesions resulted in 464 long T1 lesions (26,7%), and 501 long MPRAGE lesions (28,9%) respectively. 228 Rim+ lesions (51%) are considered long T1, and 238 long normalised MPRAGE lesions (53%). Long-T1 Rim+ lesions are significantly older than short-T1 Rim+ lesions (median 0,141±1,59 years vs 2,72±1,01 years) (Figure 4). In a Random Forest Model, T1-derived long-T1 Rim+ lesions yielded best prediction strength of current patient disability, while in MPRAGE-derived model, number of long-T1 MPRAGE Rim+ lesions only reached 3rd place (Figure 5 A and B). Number of short-T1 or short-T1 MPRAGE Rim+ lesions were best imaging predictor of clinical progression within the next 12 months (Figure 5 C and D).Conclusion
Z-Score normalisation of MPRAGE images and quantitative T1 maps yields comparable results to estimate MS lesions tissue integrity, and both can depict the increasing tissue damage associated with Rim visibility in MS lesions. Although the sensitivity of T1maps is higher than the one of MPRAGE images, the latter has the advantage of being more easily available in clinical practice. Within the heterogeneous PRL population, long-T1 Rim+ lesions strongly predict current clinical disability of patients, while the number of short-T1 Rim+ lesions are a predictor of clinical progression within the following 12 months, highlighting the importance of evaluating PRL T1-heterogeneity within MS patients.Acknowledgements
No acknowledgement found.References
1. Absinta, M. et al. Association of Chronic Active Multiple Sclerosis Lesions With Disability In Vivo. JAMA Neurol. 76, 1474–1483 (2019).
2. Maggi, P. et al. Paramagnetic Rim Lesions are Specific to Multiple Sclerosis: An International Multicenter 3T MRI Study. Ann. Neurol. 88, 1034–1042 (2020).
3. Sati, P. et al. Rapid, high-resolution, whole-brain, susceptibility-based MRI of multiple sclerosis. Mult. Scler. Houndmills Basingstoke Engl. 20, (2014).
4. Kolb, H. et al. 7T MRI Differentiates Remyelinated from Demyelinated Multiple Sclerosis Lesions. Ann. Neurol. 90, 612–626 (2021).
5. Zhang, Y., Brady, M. & Smith, S. Segmentation of brain MR images through a hidden Markov random field model and the expectation-maximization algorithm. IEEE Trans. Med. Imaging 20, 45–57 (2001).
6. Marques, J. P. et al. MP2RAGE, a self bias-field corrected sequence for improved segmentation and T1-mapping at high field. NeuroImage 49, 1271–1281 (2010).
Figures
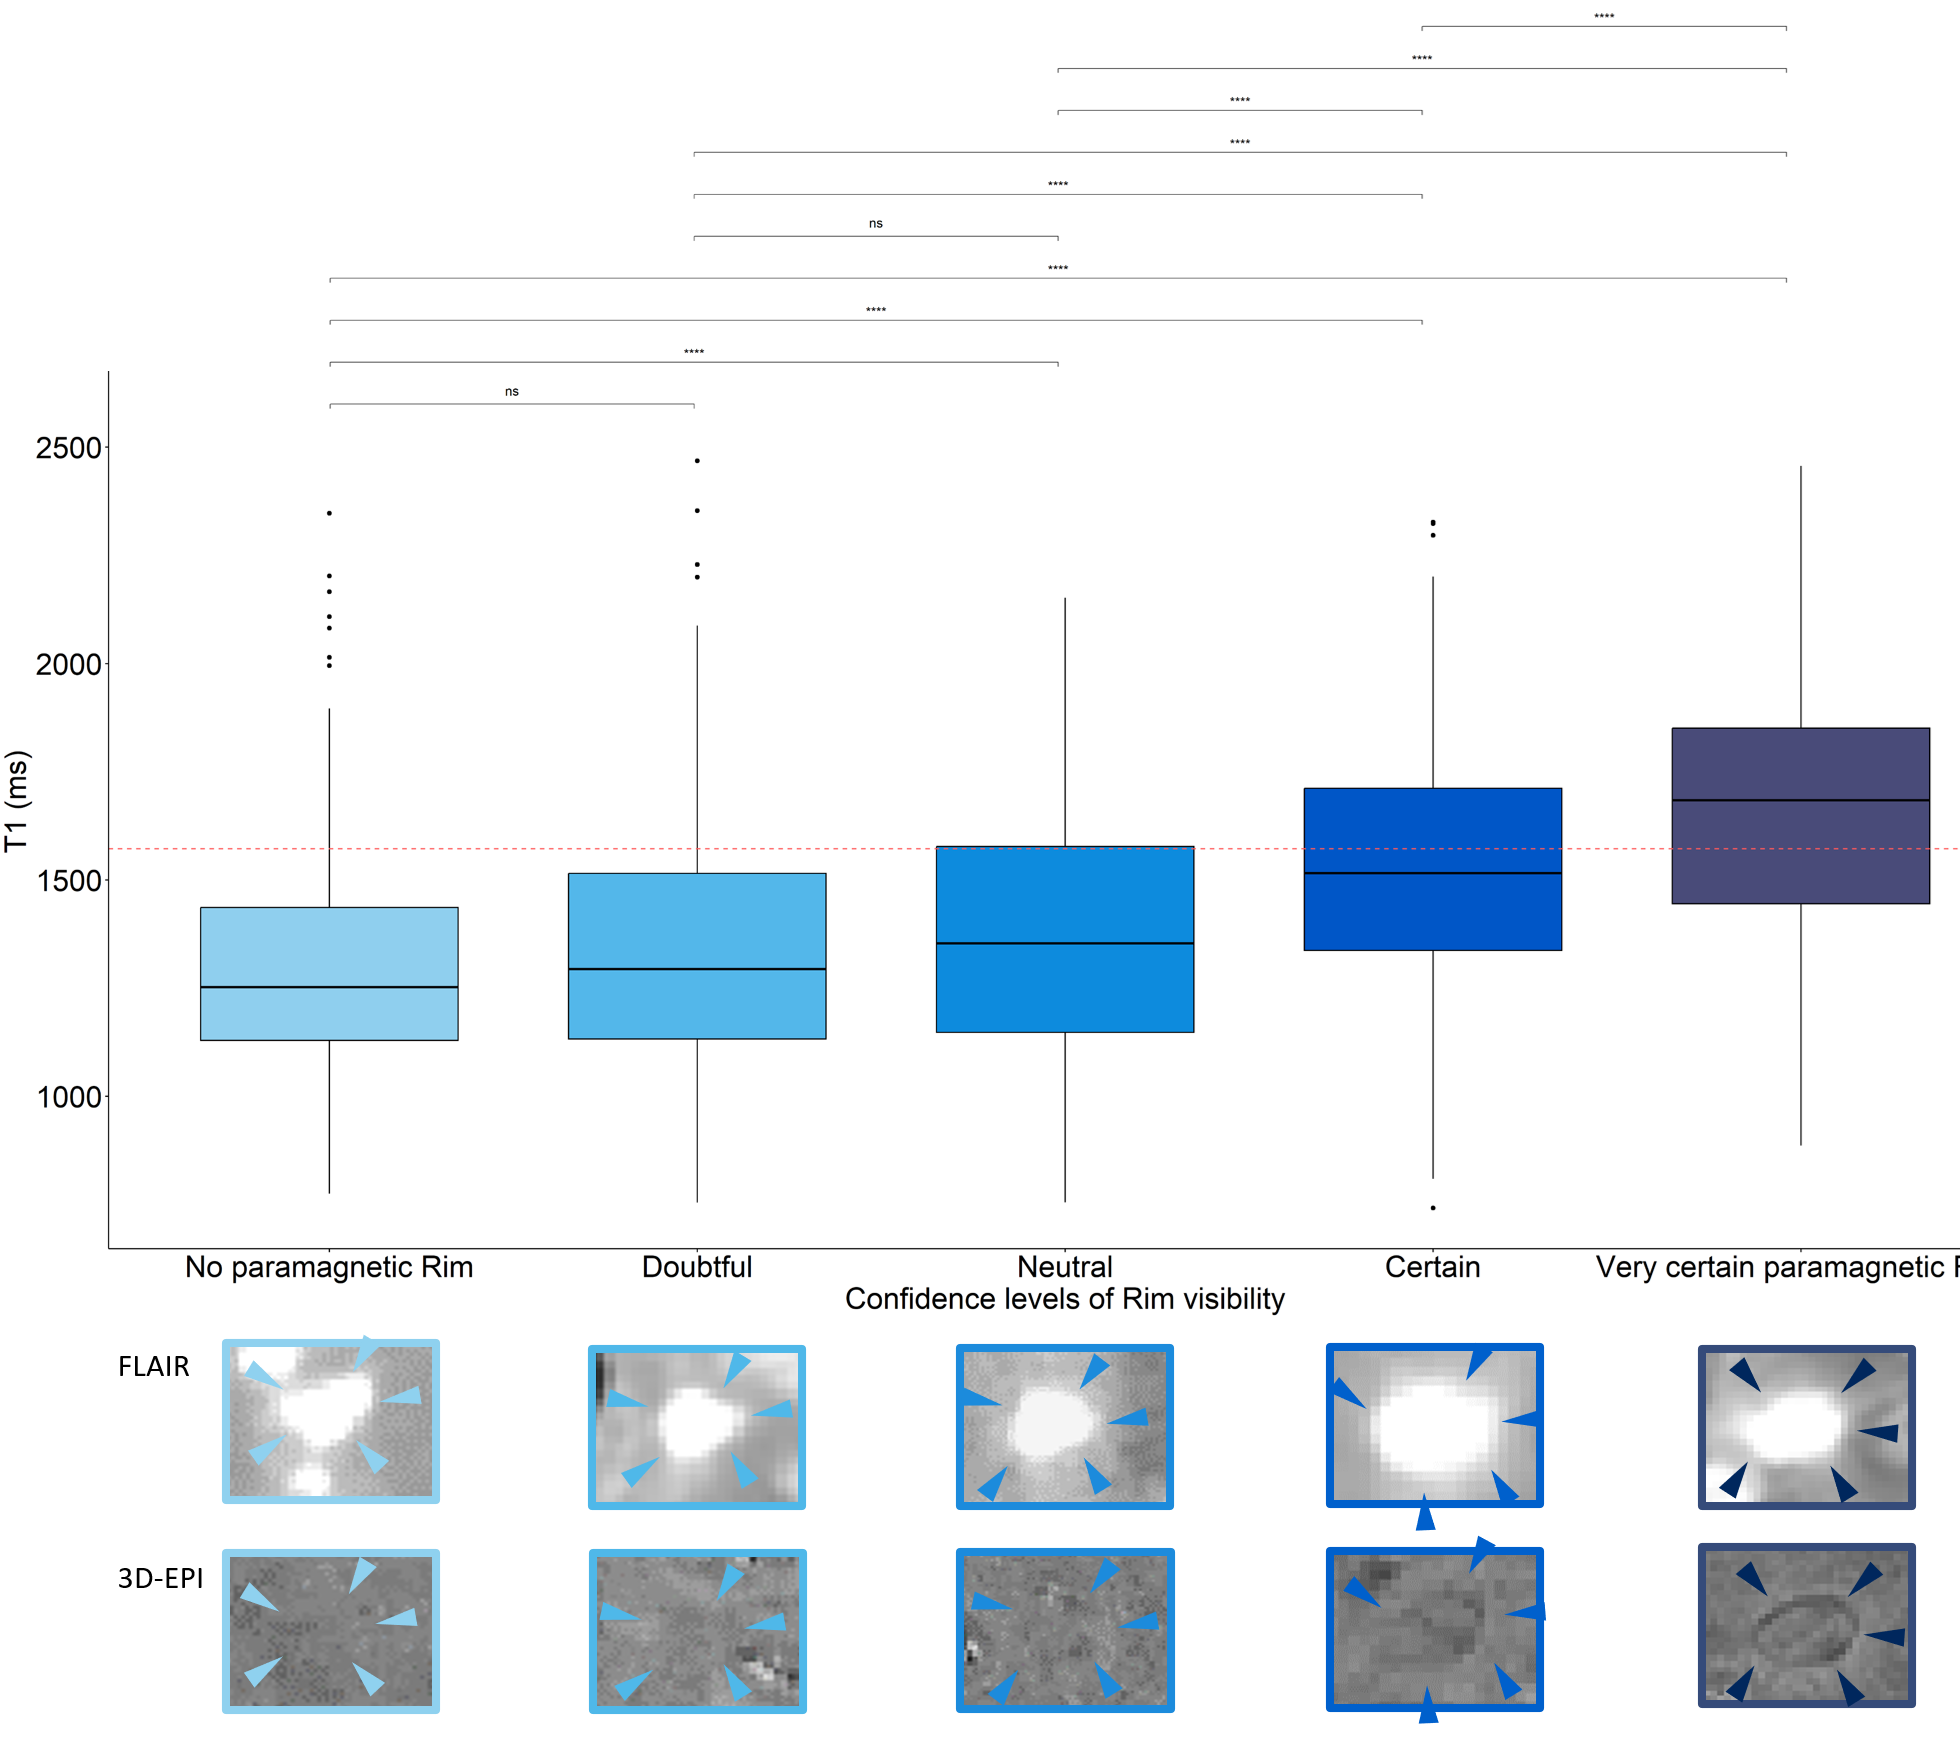
Figure 1 - Association of tissue integrity and Rim visibility on T1maps and 3D-EPI
Lesion visibility of Rim+ lesions is correlated to increased T1 values. Lesions with visibility levels certain or very certain are considered Rim+.
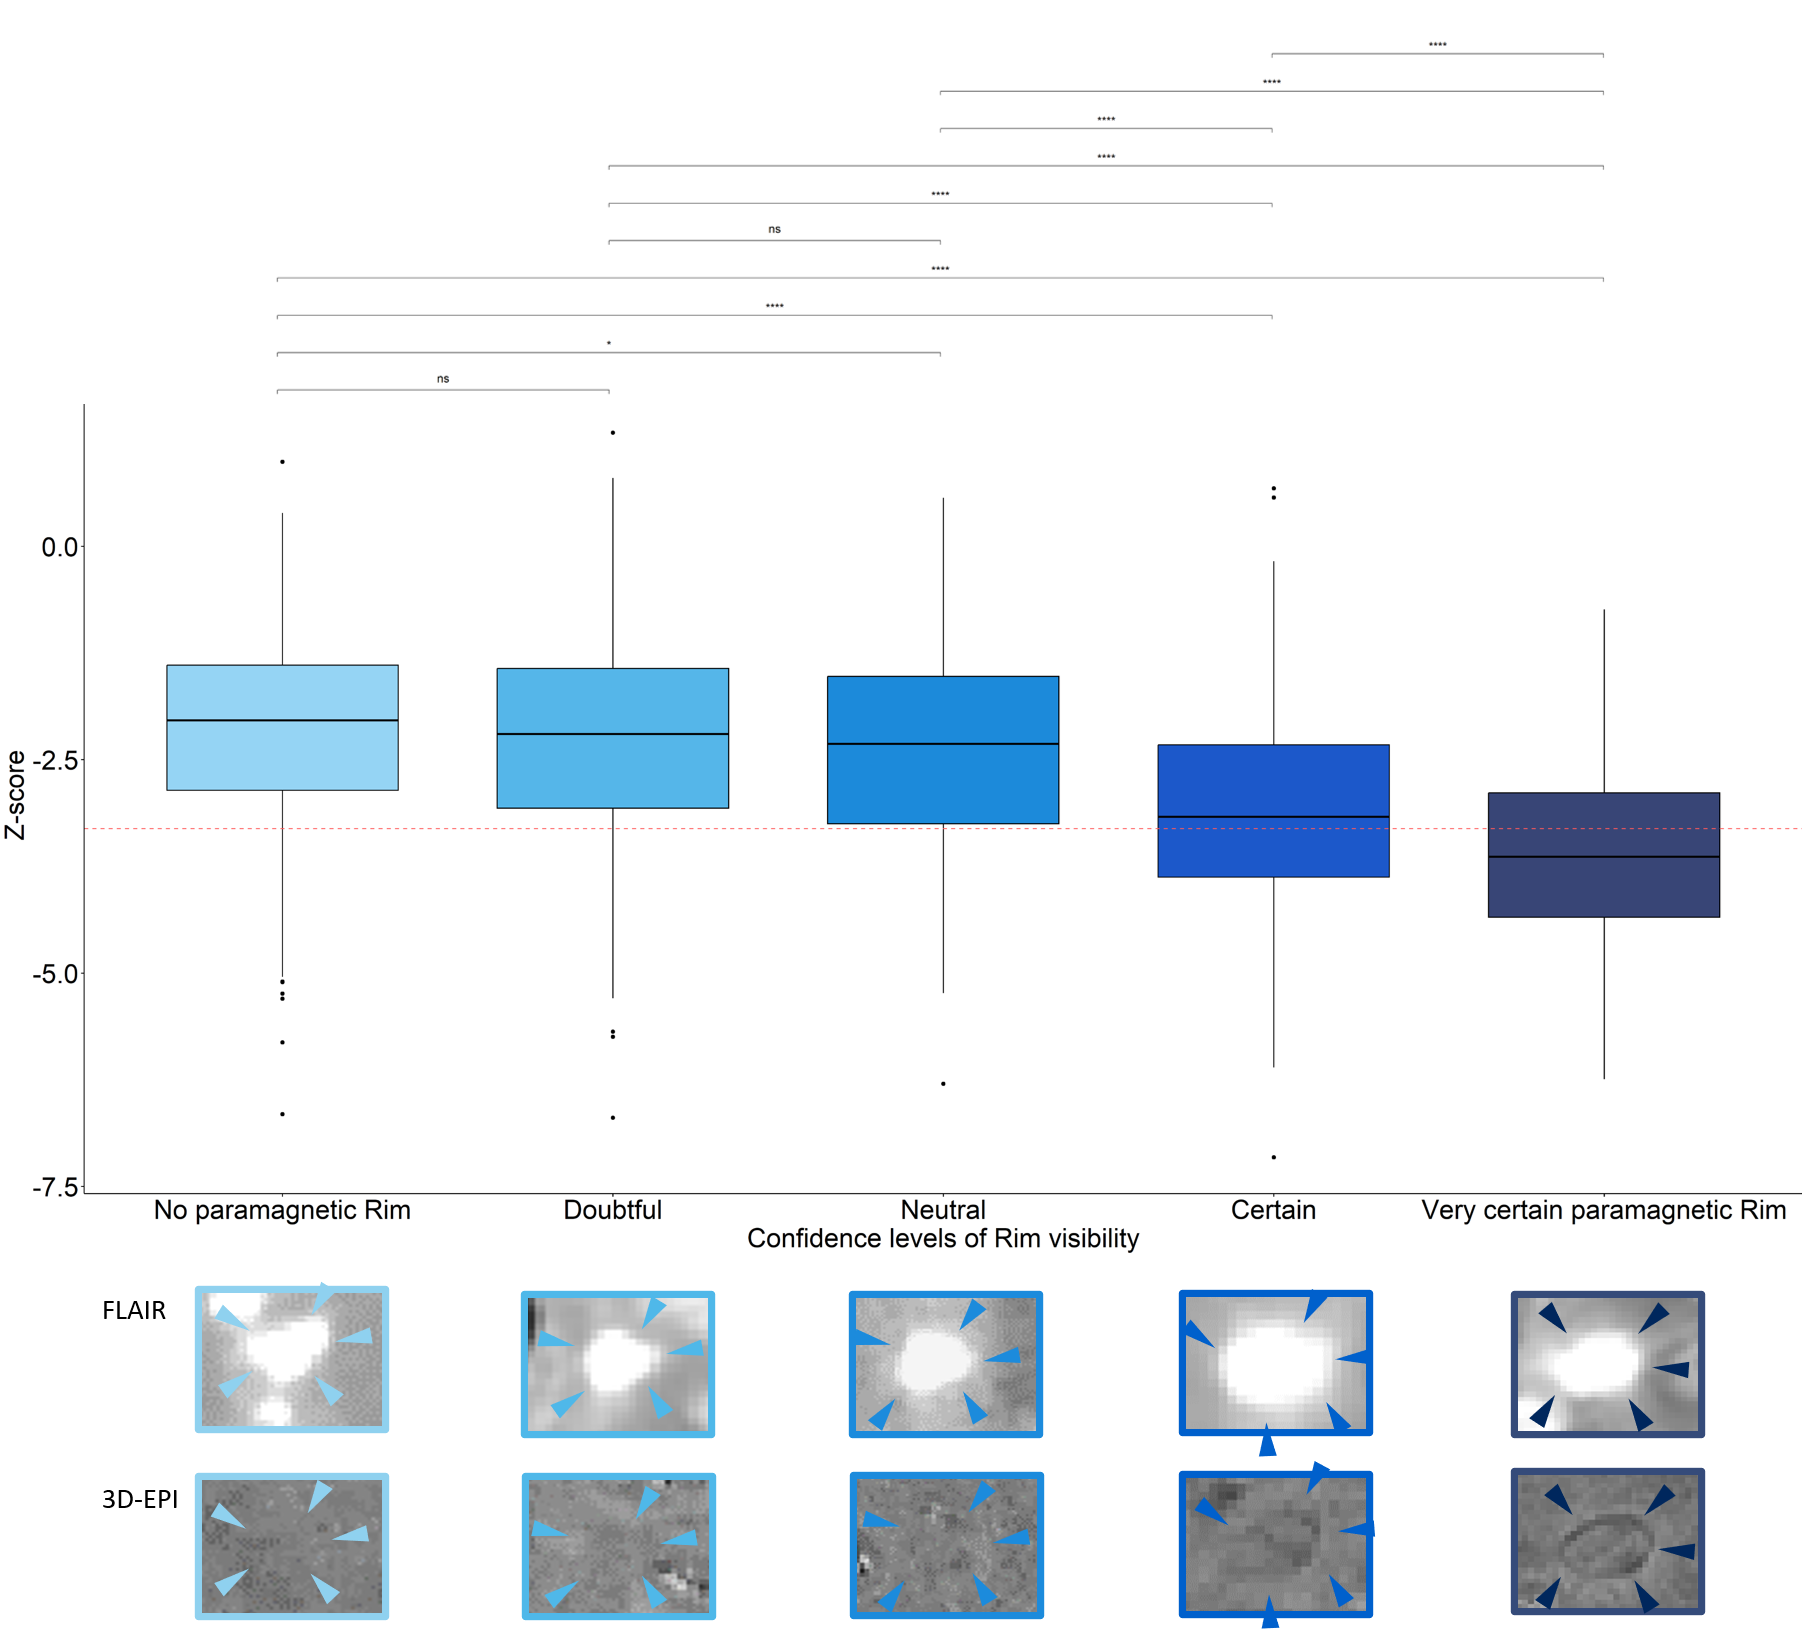
Lesion visibility of Rim+ lesions is correlated to decreasing normalised MPRAGE values. Lesions with visibility levels certain or very certain are considered Rim+.
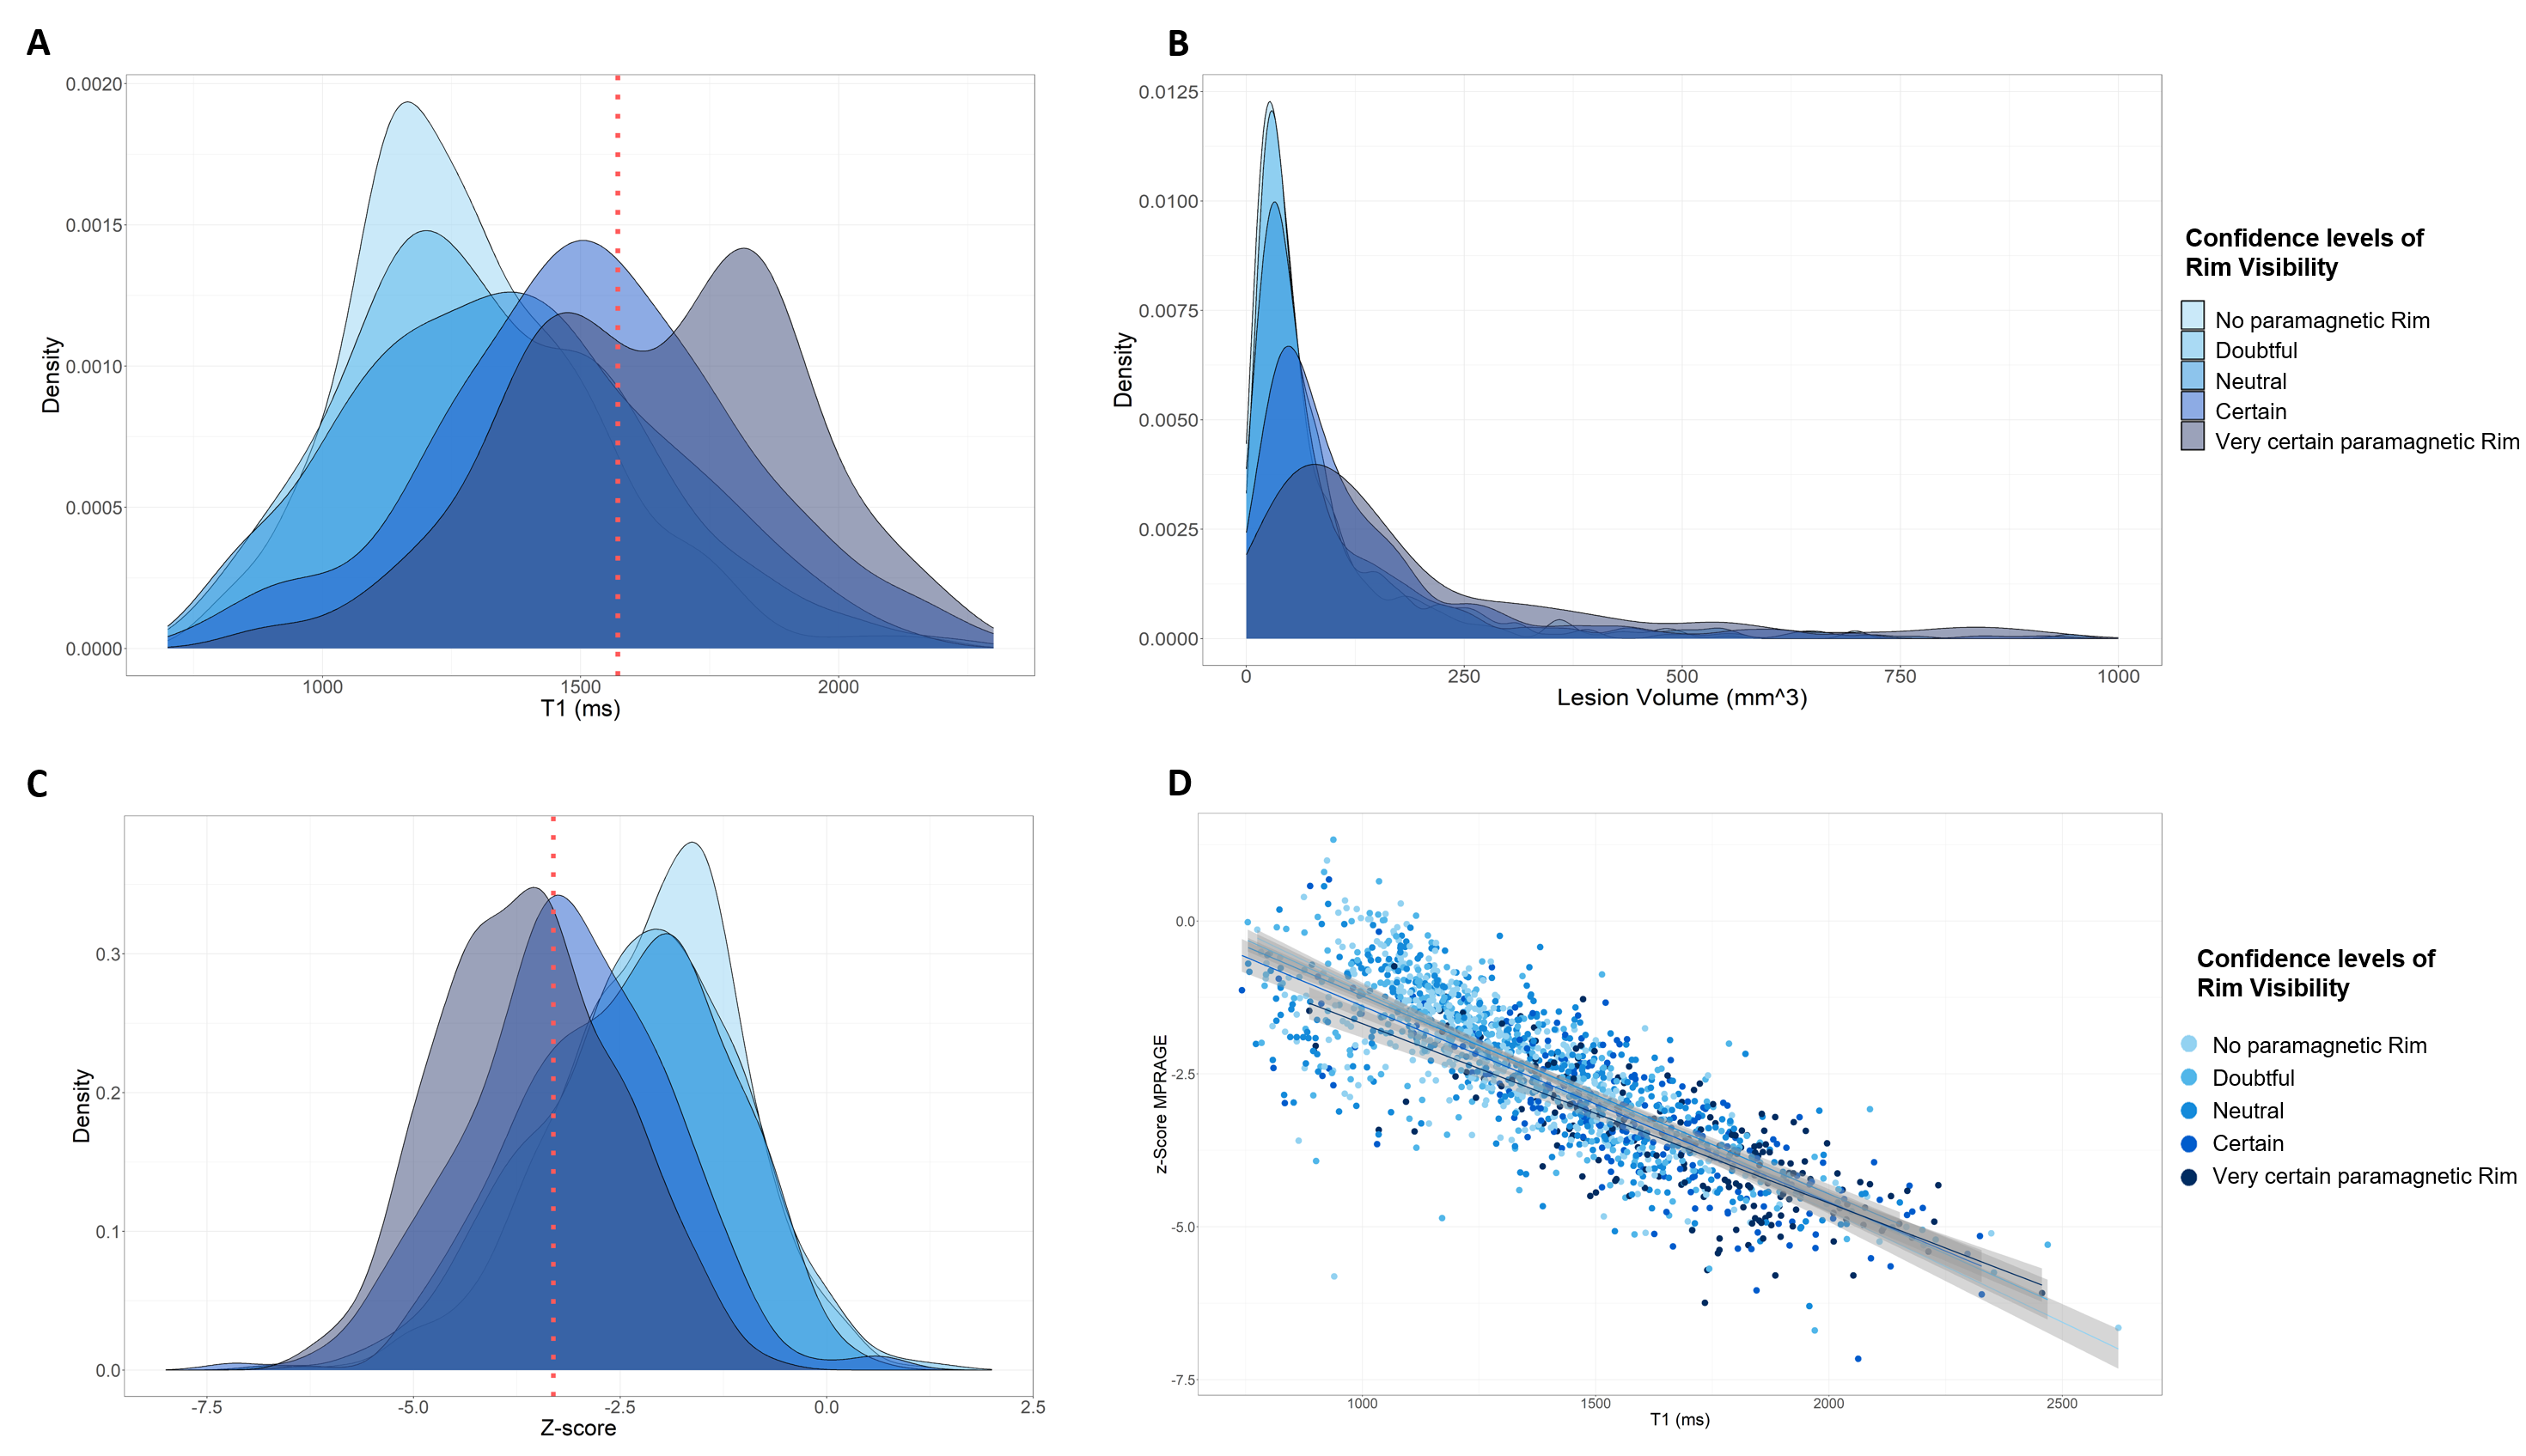
A Density plot of T1 values categorised in Rim visibility. CutOff over whole lesion cohort calculated based on 75th percentile value at 1572ms. B Densitiy plot of lesion volume categorsied in Rim visibility. C Density plot of normalised MPRAGE values categorised in Rim visibility. CutOff over whole lesion cohort calculated based on 75th percentile value at -3,372STD. D Scatter plot of T1 values and normalised MPRAGE values categorised in Rim visibility.
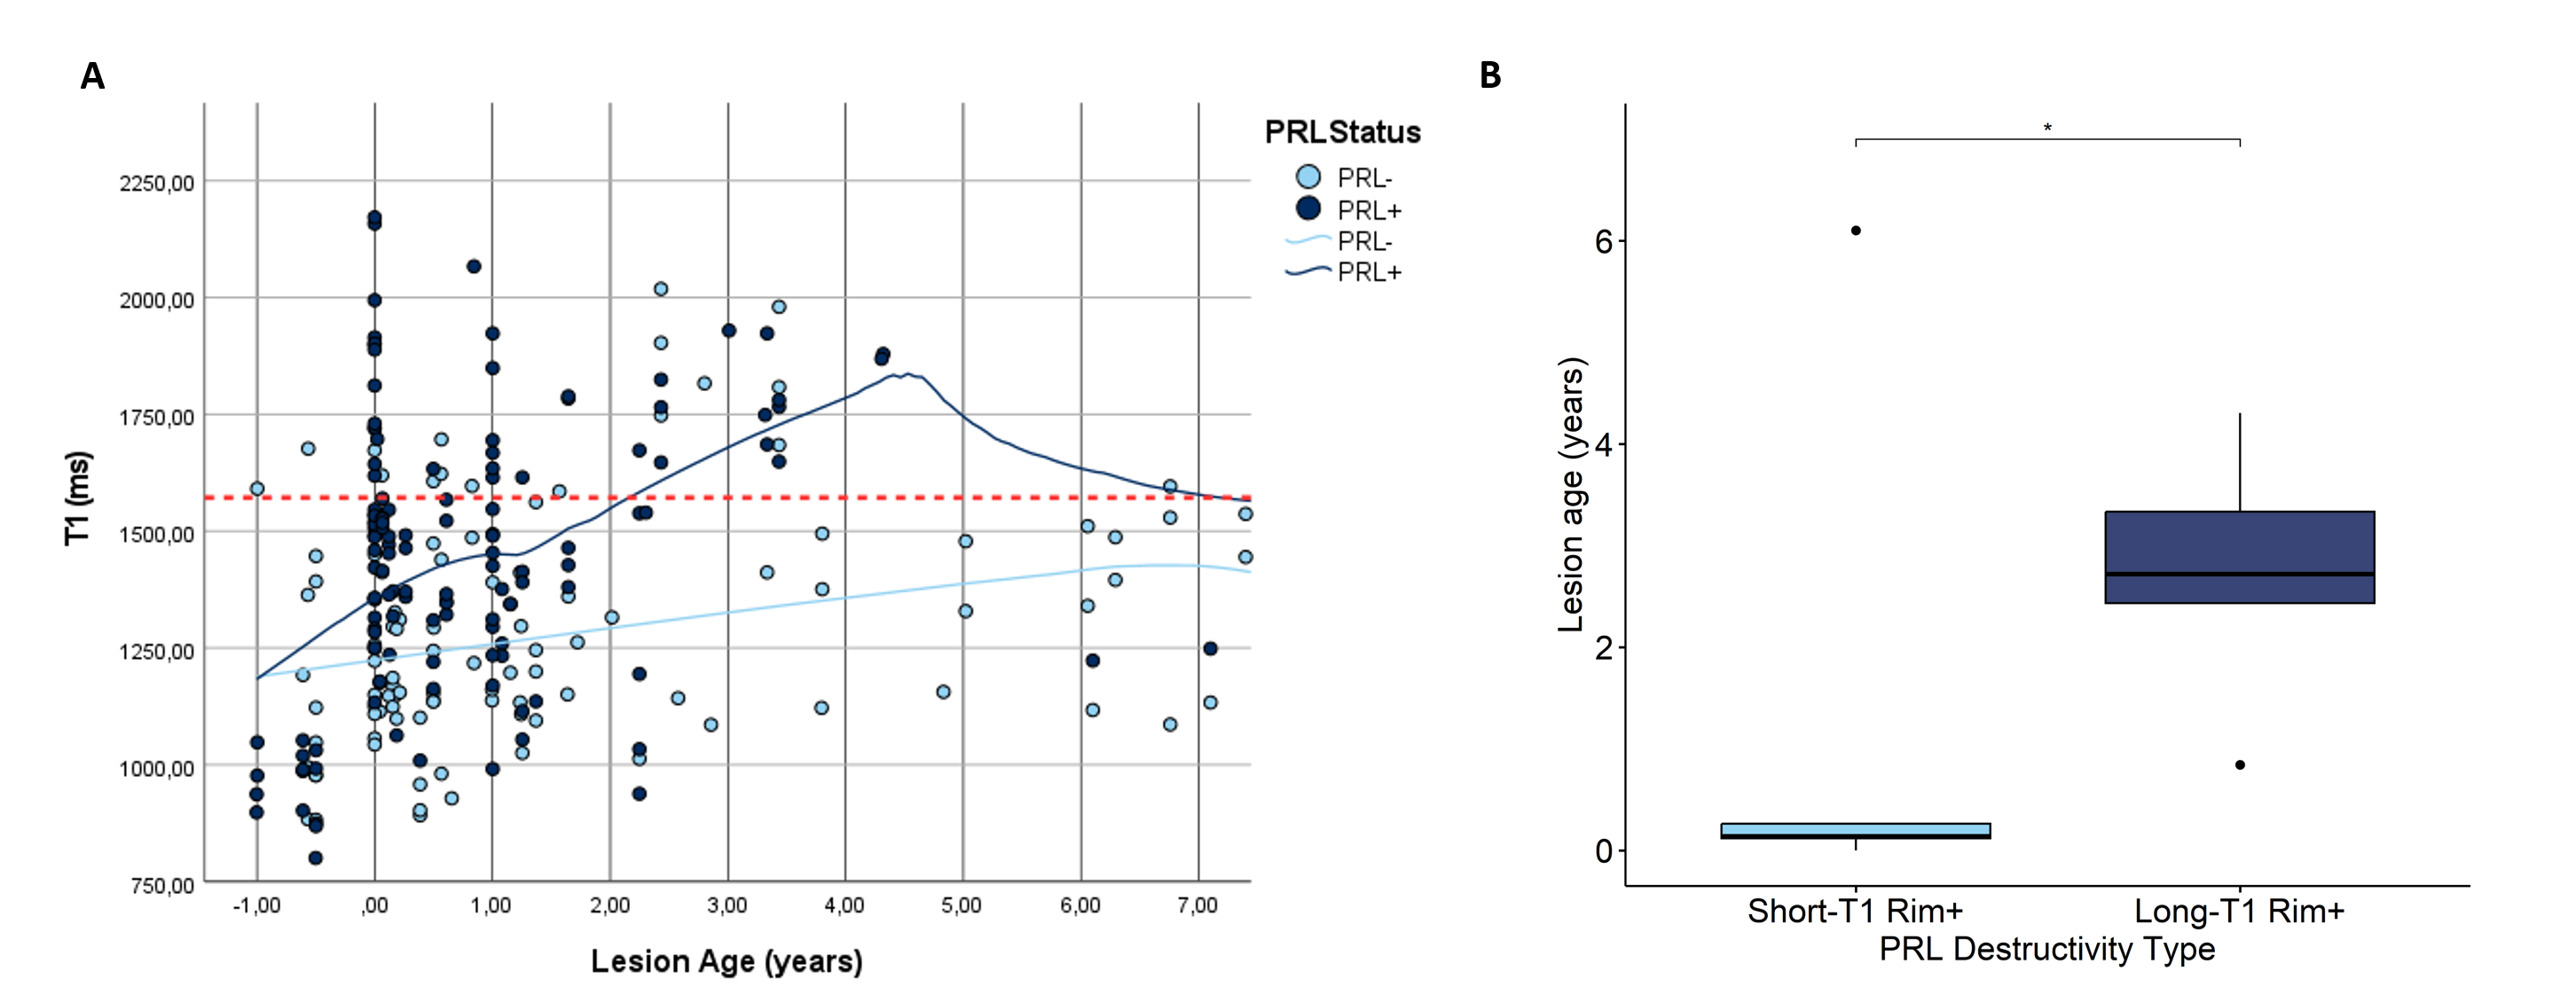
A Tissue integrity development of PRL- (light blue) and PRL+ (dark blue) over a time period of 7 years. Calculated long-T1 cutoff at 1572ms. B Lesion age of short-T1 Rim+ lesions and long-T1 Rim+ lesions.
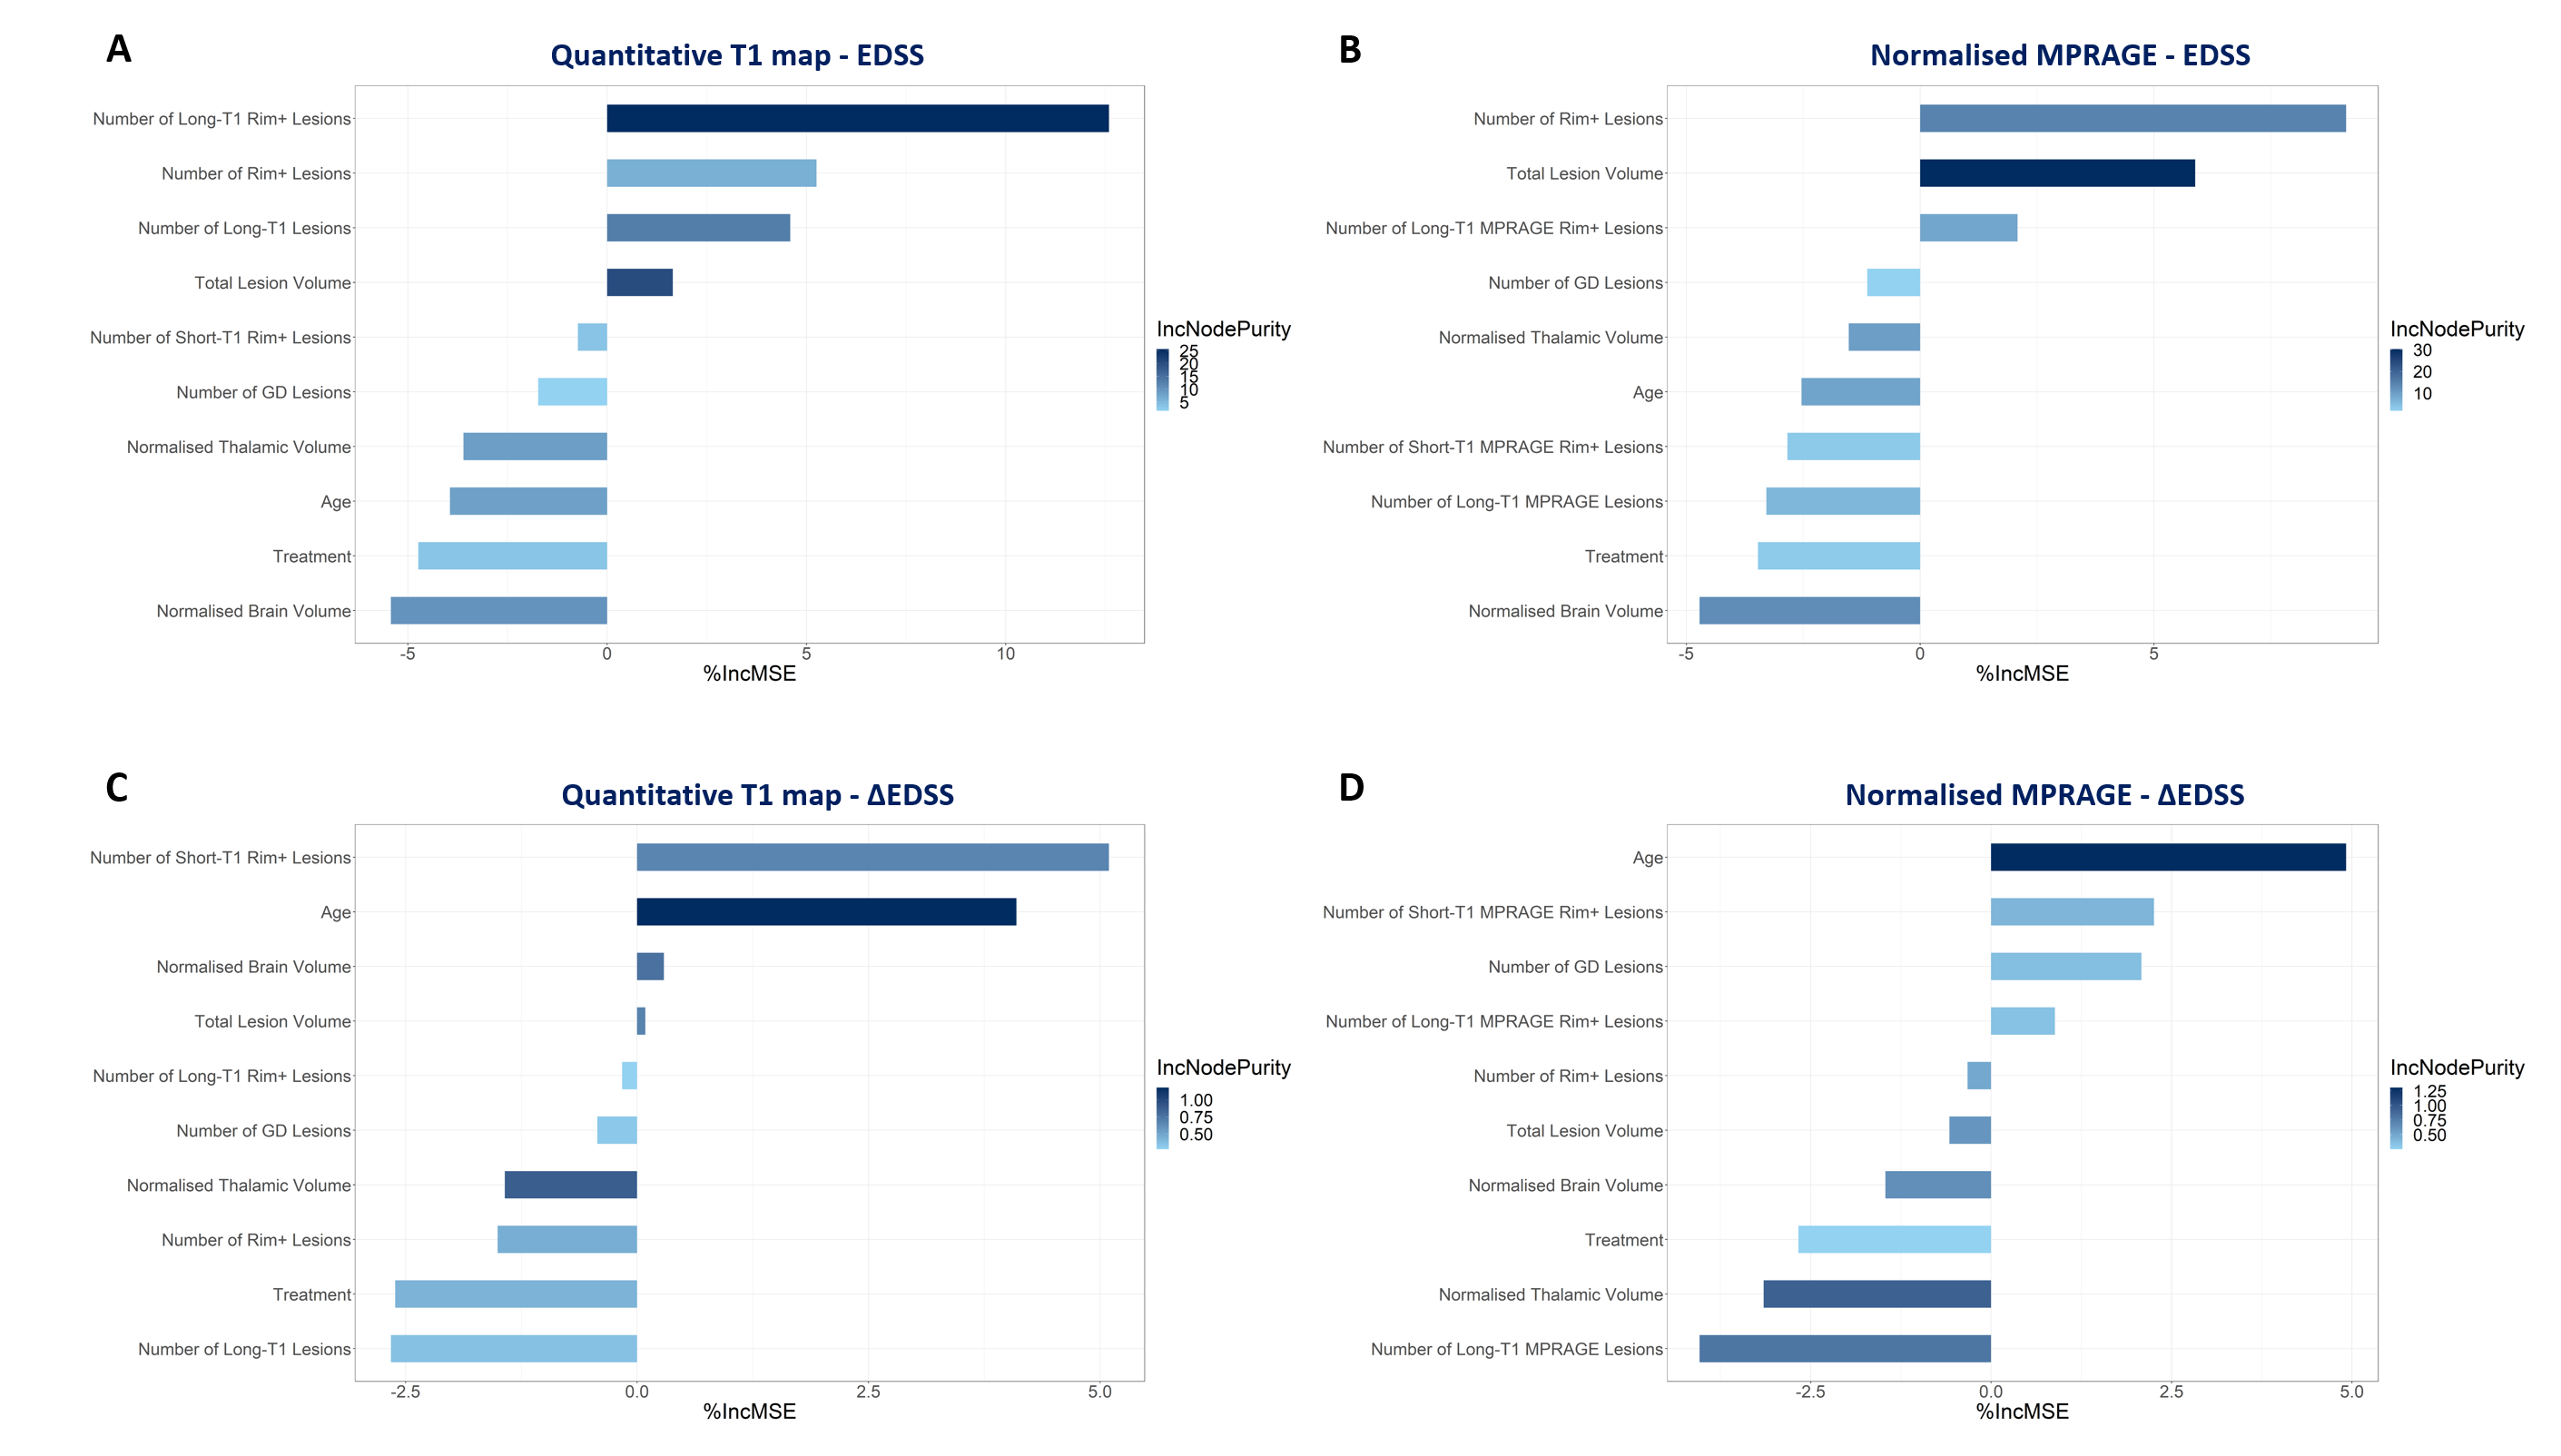
A + C Random Forrest analysis of current EDSS score of different clinical, T1map-derived and normalised MPRAGE imaging parameters. B + D Random Forrest analysis of clinical progression within next twelve months of different clinical, T1map-derived and normalised MRPAGE-derived imaging parameters.