2976
qMRI-based classification of active vs. inactive multiple sclerosis lesions – towards eliminating the need for contrast agent injections1Sagol School of Neuroscience, Tel Aviv University, Tel Aviv, Israel, 2Department of Biomedical Engineering, Tel Aviv University, Tel Aviv, Israel, 3The AI and Data Science Center, Tel Aviv university, Tel Aviv, Israel, 4Department of Diagnostic Imaging, Sheba Medical Center, Ramat Gan, Israel, 5Sackler School of Medicine, Tel Aviv University, Tel Aviv, Israel, 6Center for Advanced Imaging Innovation and Research, New York University Langone Medical Center, New York, NY, United States
Synopsis
Keywords: Multiple Sclerosis, Machine Learning/Artificial Intelligence, Quantitative MRI; qMRI; Contrast enhanced imaging; active lesions
Motivation: The gold standard way for assessing Multiple sclerotic (MS) disease activity is by identifying new active lesions using contrast enhanced imaging. The repeated use of gadolinium injections for MS patients constitute a major concern due to long-term accumulation and even breakdown of this agent in the brain and body without efficient clearance.
Goal(s): Classify active vs. inactive MS lesions using quantitative MRI (qMRI) without the need for contrast-enhanced imaging.
Approach: Machine learning classifier trained on qMRI features of MS lesions.
Results: qMRI profiling has the potential to classify MS lesions into active/inactive state with accuracy of 81.7 ± 10 %.
Impact: Multiple sclerosis disease activity is assessed using contrast-enhanced MRI. Recently, concerns have been raised regarding the long-term accumulation and breakdown of contrast agents in the brain. This study introduces a qMRI-based and contrast-free approach for assessing multiple sclerosis disease activity.
Introduction
Multiple sclerosis (MS) is a chronic autoimmune disease associated with motoric and cognitive deterioration, and causing damage to the central nervous system in a process of lesion formation, inflammation, demyelination, and eventual axonal loss. MS course of treatment is determined based on disease activity1-3, which is, in turn, determined via injection of gadolinium contrast agent, causing enhancement of active lesions while inactive (chronic) lesions remain hypointense4. Many concerns have been recently raised regarding long-term accumulation and even breakdown of gadolinium in the brain, and its potentially insidious effects. Abnormal Gadolinium depositions have been reported in the dentate nucleus (DN), globus pallidus (GP), and thalamus in early MS and are associated with lifetime accumulation of this agent5. In this study we investigated an alternative to the gadolinium injection by identifying MS lesions’ activity using qMRI-based profiling of lesions based on their proton density, T2 relaxation times, and diffusion coefficient. These profiles were used in a logistic regression classifier6 trained to differentiate active and inactive lesions without relying on contrast injections. Model’s performance was tested against the current gold standard labeling lesions based on pre- vs. post-contrast injection.Methods
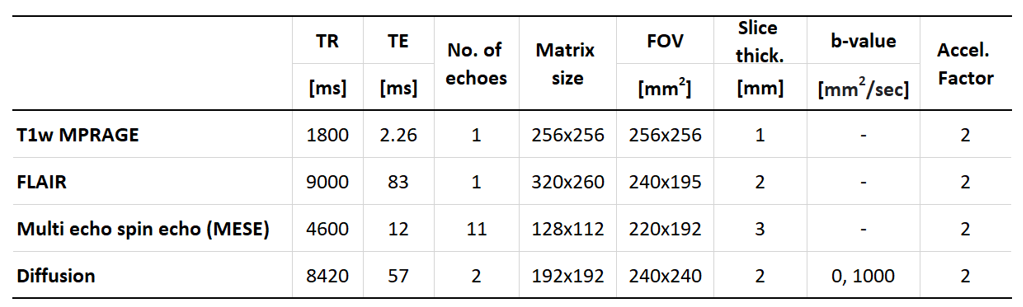
Patient population: Twenty-four patients were scanned (Helsinki approval 3933-17-SMC). A total of 71 lesions (30 active, 41 inactive) were identified across all subjects based on gold standard comparison of pre- vs. post-contrast MRI scans.MRI scans: were performed on a 3 Tesla Siemens Prisma Scanner and included: T1-weighted MPRAGE pre and post-contrast; FLAIR; multi-echo spin-echo (MESE), and diffusion weighted imaging. Scan parameters are listed in Table 1.
Data post-processing: T2 and proton density (PD) maps were calculated from MESE data using the EMC algorithm7-8. ADC maps were calculated using exponential fitting of the two b-values. Eleven statistical metrics were extracted for each lesion and each qMRI map including lesion size, mean, standard deviation (SD), standard error of the mean, 10,25,50,75, 90 percentile values, skewness, and kurtosis. This produced a total of 33 features (3 maps x 11 statistical metrics).
Statistical analysis was done in three stages: (Stage-1, Normalization): quantitative feature were normalized to have zero mean and unit variance. (Stage-2, Feature selection): Spearman correlation was performed between each feature and the lesions’ activity. Features with correlation R-value at the top 50% and p-value>0.11 were removed from the subset of features. (Stage-3, Pairwise correlation): was performed between the subset of remaining features in order to exclude highly dependent features, which contain redundant information. For each pair of features that correlated above r=0.75, the feature with the lower spearman correlation (from Stage-2) was removed.
Logistic regression classification: The final subset of features was inputted into a machine-learning logistic regression classifier trained on 80% of the data, and tested for accuracy on the remaining 20%. Model was implemented using Python’s Scikit learn module. Cross validation was performed by repeating this process 100 times, with random separation of the data to train and test. Overall accuracy was calculated as the average across all runs.
Results
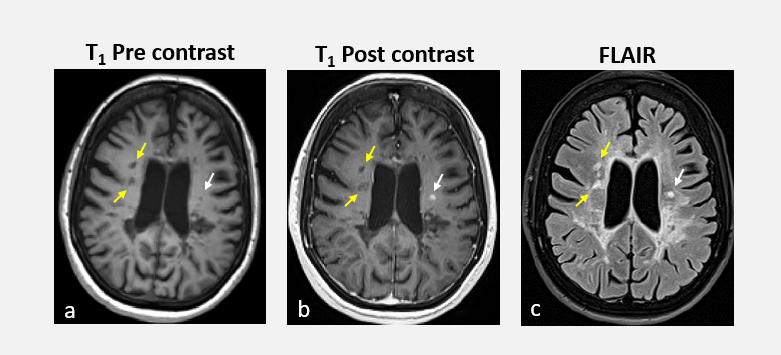
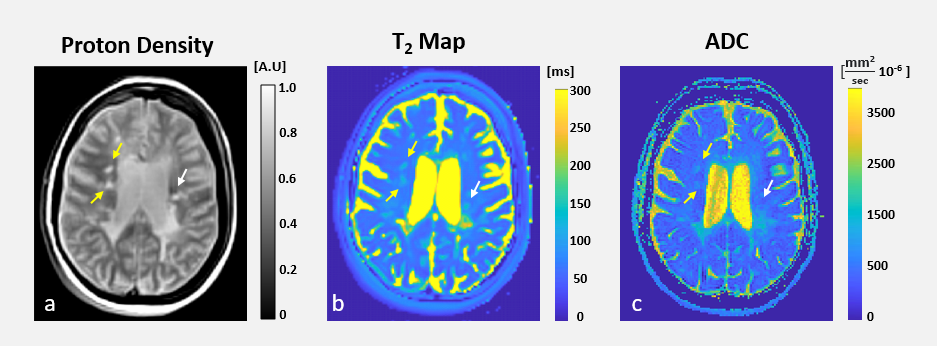
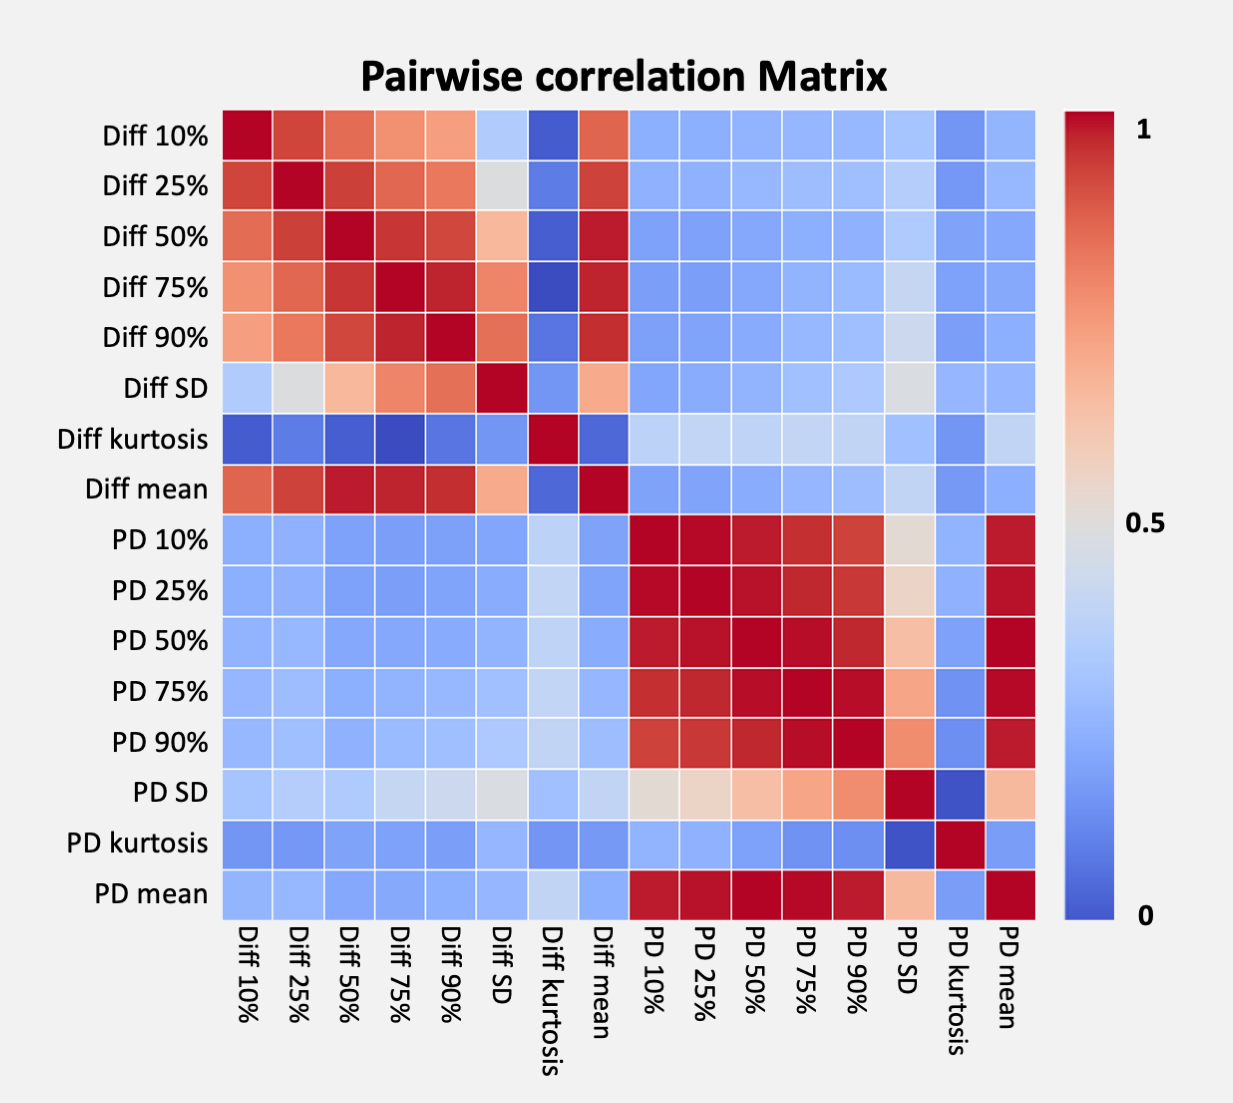
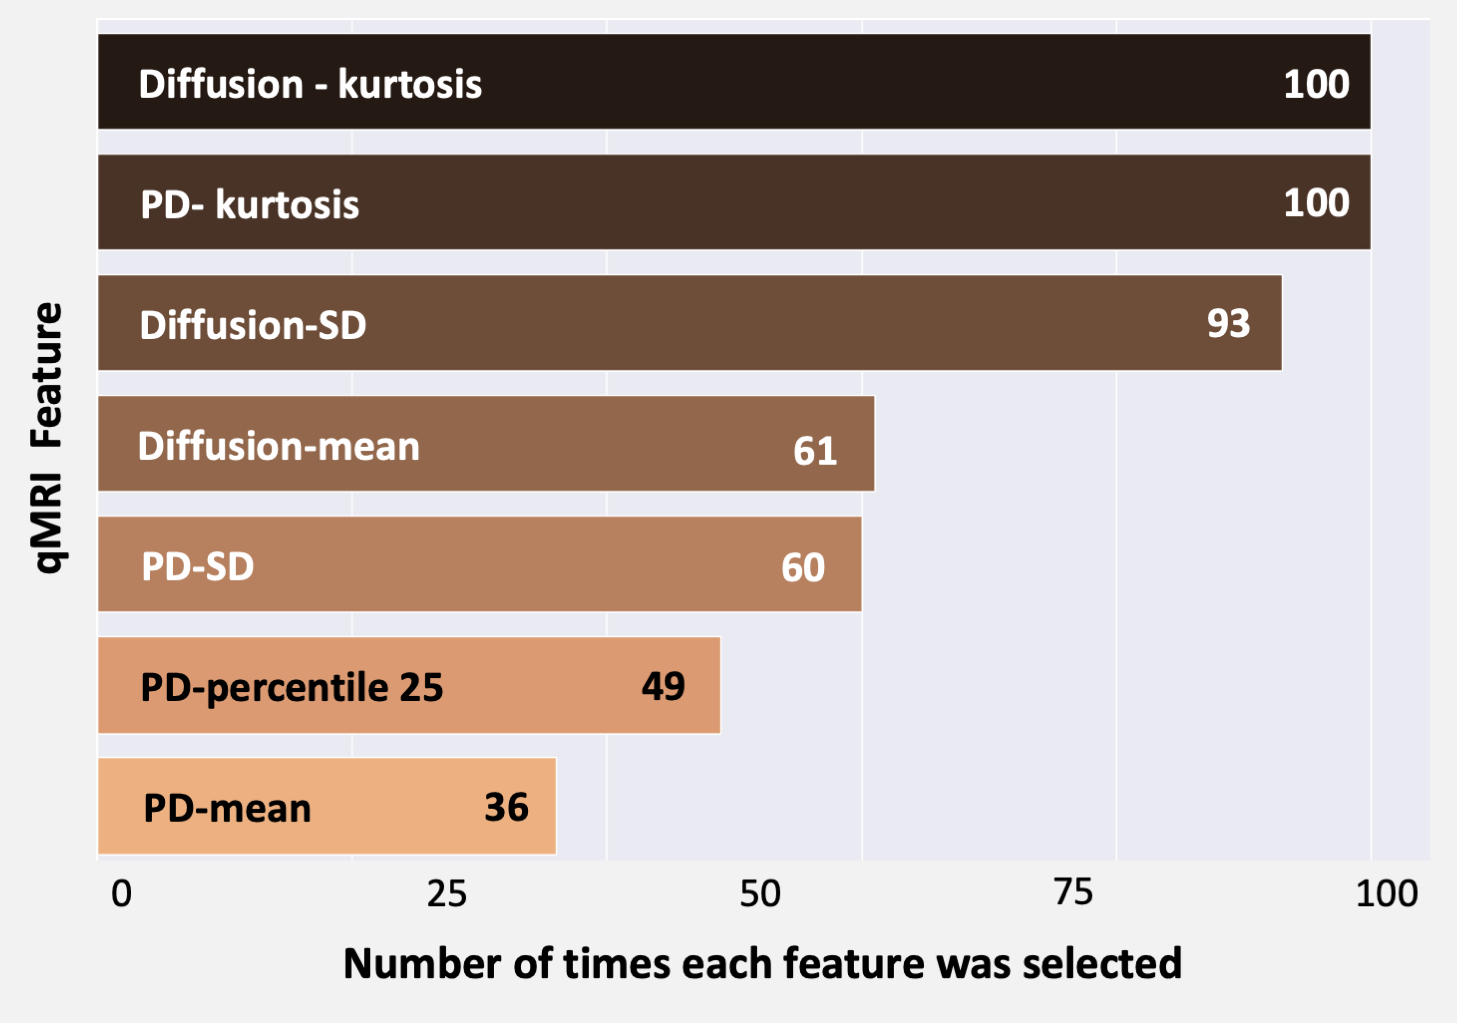
Figure 1 contains representative T1-weighted images of an MS patient pre and post contrast injection, showing one active lesion (white arrow) which was enhanced post contract, and two inactive lesions (yellow arrows) that remained hypointense. Quantitative PD, T2, and ADC maps are shown in Figure 2 for the same MS patient. Pairwise correlation matrix across the subset of features that passed Stage-1 of the feature-selection process is shown in Figure 3. As can be seen, little correlation exists between PD and diffusion derived metric, indicating that these maps contain complementary information.The predictive accuracy of the logistic regression model was 81.7 ± 10 %. Figure 4 lists the number of times each feature was selected as input to the logistic regression model, across the 100 cross-validation tests.
Discussion
In this study, we employed qMRI profiling of MS lesions to differentiate between active and inactive lesions without the need for contrast injection. Our findings suggest that this approach may provide an alternative to contrast injection, particularly in cases where such procedure is problematic, e.g., kidney disease, pediatric imaging, contraindications to contrast-agent, or the need for repeated MRI scans. The accuracy of 81.7 ± 10 % provides a good basis for further research into the clinical utility of this approach. This accuracy may be improved by expanding the qMRI profiles to include additional quantitative maps or statistical metrics. Of note, we believe that the binary separation of lesions into active / inactive should also be reevaluated, as lesions’ may, in fact, exhibit a spectrum of activity levels.Acknowledgements
No acknowledgement found.References
1. Dobson R, Giovannoni G. Multiple sclerosis - a review. Eur J Neurol. 2019 Jan; 26(1):27-40.
2. McGinley MP, Goldschmidt CH, Rae-Grant AD, Diagnosis and Treatment of Multiple Sclerosis: A Review. JAMA. 2021 Feb 23; 325(8):765-779.
3. Correale J, Gaitán MI, Ysrraelit MC, Fiol MP. Progressive multiple sclerosis: from pathogenic mechanisms to treatment. Brain. 2017 Mar 1;140(3):527-546[H1] [H1] progressive MS
4. Grossman RI, Gonzalez-Scarano F, Atlas SW, Galetta S, Silberberg DH. Multiple sclerosis: gadolinium enhancement in MR imaging. Radiology. 1986 Dec;161(3):721-5.
5. Zivadinov R, Bergsland N, Hagemeier J, Ramasamy DP, Dwyer MG, Schweser F, Kolb C, Weinstock-Guttman B, Hojnacki D. Cumulative gadodiamide administration leads to brain gadolinium deposition in early MS. Neurology. August 06, 2019; 93 (6).
6. Gudivada, V. N., Irfan, M. T., Fathi, E., & Rao, D. L. (2016). Cognitive Analytics: Going Beyond Big Data Analytics and Machine Learning. Handbook of Statistics, 35, 169–205.
7. Ben-Eliezer N, Sodickson DK, Block KT. Rapid and accurate T2 mapping from multi-spin-echo data using bloch-simulation-based reconstruction. Magn Reson Med. 2015;73(2):809-817.
8. Radunsky D, Stern N, Nassar J, Tsarfaty G, Blumenfeld-Katzir T, Ben-Eliezer N. Quantitative platform for accurate and reproducible assessment of transverse (T2) relaxation time. NMR Biomed. 2021;34(8):1-14
Figures