2975
T1.T2product is sensitive to disability-relevant tissue damage in early relapsing-remitting multiple sclerosis1Centre for Clinical Brain Sciences, University of Edinburgh, Edinburgh, United Kingdom, 2Anne Rowling Regenerative Neurology Clinic, University of Edinburgh, Edinburgh, United Kingdom, 3Edinburgh Imaging, University of Edinburgh, Edinburgh, United Kingdom
Synopsis
Keywords: Multiple Sclerosis, Multiple Sclerosis, Relaxometry, T1 mapping, T2 mapping, T1w/T2w ratio
Motivation: T1w/T2w is a marker of tissue integrity in multiple sclerosis (MS), but is derived from (normalised) signal intensities, not quantitative measures.
Goal(s): To determine whether longitudinal quantitative T1 and T2 and T1.T2product (directionally equivalent to T1w/T2w) measures are sensitive to disability-relevant tissue damage in early MS.
Approach: Voxelwise T1.T2product maps were estimated in people recently diagnosed with relapsing-remitting MS (n=62). Longitudinal change in normal-appearing white matter (NAWM), grey matter (GM) and white matter lesions (WML), and relationship with disability, were assessed.
Results: Greater increases in T1.T2product in NAWM and GM are associated with disability worsening.
Impact: T1, T2 and derived T1.T2product measures are sensitive to disability-relevant tissue damage in recently diagnosed relapsing-remitting MS, and may provide greater insights into underlying pathological change than T1w/T2w intensity ratios.
Introduction
In vivo markers of tissue integrity are needed to inform treatment pathways, and as objective endpoints for clinical trial platforms in early relapsing-remitting multiple sclerosis (RRMS). Previous RRMS studies showed that the ratio of T1-w to T2-w (T1w/T2w) signal intensities in white matter lesions (WML) was associated with clinical disability, as measured by the Expanded Disability Status Scale (EDSS), and disease duration,1 and lower T1w/T2w in parietal and occipital cortices than age- and sex-matched healthy controls.2 A significant relationship between T1w/T2w and dendrite density has been demonstrated post-mortem in normal-appearing grey matter (GM).2 Standardized T1w/T2w approaches appear to improve sensitivity to MS-related differences in normal-appearing white matter (NAWM),3 but remain dependant on signal intensities from specifically-weighted MR sequences.Different underlying pathological tissue features result in T1 and T2 prolongation in MS. Quantification of T1 and T2 allows more rigorous measurement of their contributions in WML, NAWM and GM. The product of T1 and T2 (T1.T2product) also provides a quantitative equivalent of T1w/T2w, which is independent of sequence acquisition parameters and may provide a more resilient aggregate marker of tissue integrity. This study aims to examine longitudinal changes in T1, T2 and T1.T2product, and their relationship to evolving disability in early RRMS.
Methods
People with recently diagnosed RRMS (< 6 months, treatment-naïve at baseline) were recruited to a multi-site Scottish longitudinal inception cohort, FutureMS.4 Clinical disability assessment included EDSS.MRI was acquired at baseline and one-year, on a 3.0T MR system (Prisma; Siemens, Erlangen, Germany) with 32-channel head coil. Structural imaging included 3D T1-weighted MPRAGE and axial 2D T2 FLAIR PROPELLER, as described previously.5 T2 maps were estimated from a T2-weighted dual echo FSE sequence (0.7 x 0.7 x 3mm; 60 slices; 384 x 384 mm; TR/TE: 3630/9.6,96). Variable flip angle (VFA) T1 maps were acquired in a single centre sub-study from two sagittal 3D gradient echo fast low-angle shot (FLASH) sequences: a proton density (1.4mm isotropic; 128 slices; 160 x 172 mm; TR=30ms, α=5°) and a T1-weighted image (TR=15ms, α=18°).
Skull-stripping was performed with FSL BET and intracranial volumes were manually edited. WML were automatically segmented from T2 FLAIR and manually corrected.5 NAWM and GM were segmented using FreeSurfer.
T2, and T1 maps where available, were registered to the T1-w MPRAGE (FSL flirt, v6.0). The voxelwise product of T1 and T2 (T1.T2product) was calculated (fslmaths) for extended MRI participants. Baseline and one-year median T2, T1 and T1.T2product values were extracted in NAWM, GM, and WML (fslstats). WML load was calculated as a proportion of intracranial volume at each time point.
Statistical analyses were carried out in RStudio (R v4.2.1). Longitudinal changes over one year in T2 and T1.T2 product metrics were assessed with paired t-tests. The association between change in both T2 and T1.T2 product and disability worsening (EDSS change ≥ 0.5) was evaluated with binomial logistic regression, corrected for baseline age, sex, dichotomised disease-modifying therapy (DMT) usage, and change in WML load. All reported p-values are false detection rate (FDR-)corrected.
Results
Complete longitudinal T2 data were available for 165 participants (123 female; 37.9 ± 10.2), 62 (48 female; 37.6 ± 10.9) of whom had additional T1 and hence T1.T2product data.T1.T2product decreased in WML (Figure 1, t[61]=-4.79, p<0.001); there was no significant group-wise change in T1.T2product in NAWM (t[61]=0.87, p=0.387) or GM (t[61]=1.44, p=0.155). Changes in T1.T2product were strongly correlated with T1 and, to a lesser extent, T2 (Figure 2). In the wider cohort however, T2 decreased for all tissue types over one year (Figure 3, NAWM: t[165]=-2.19, p=0.030; GM: t[165]=-2.78, p=0.009; WML: t[165]= -6.59, p<0.001).
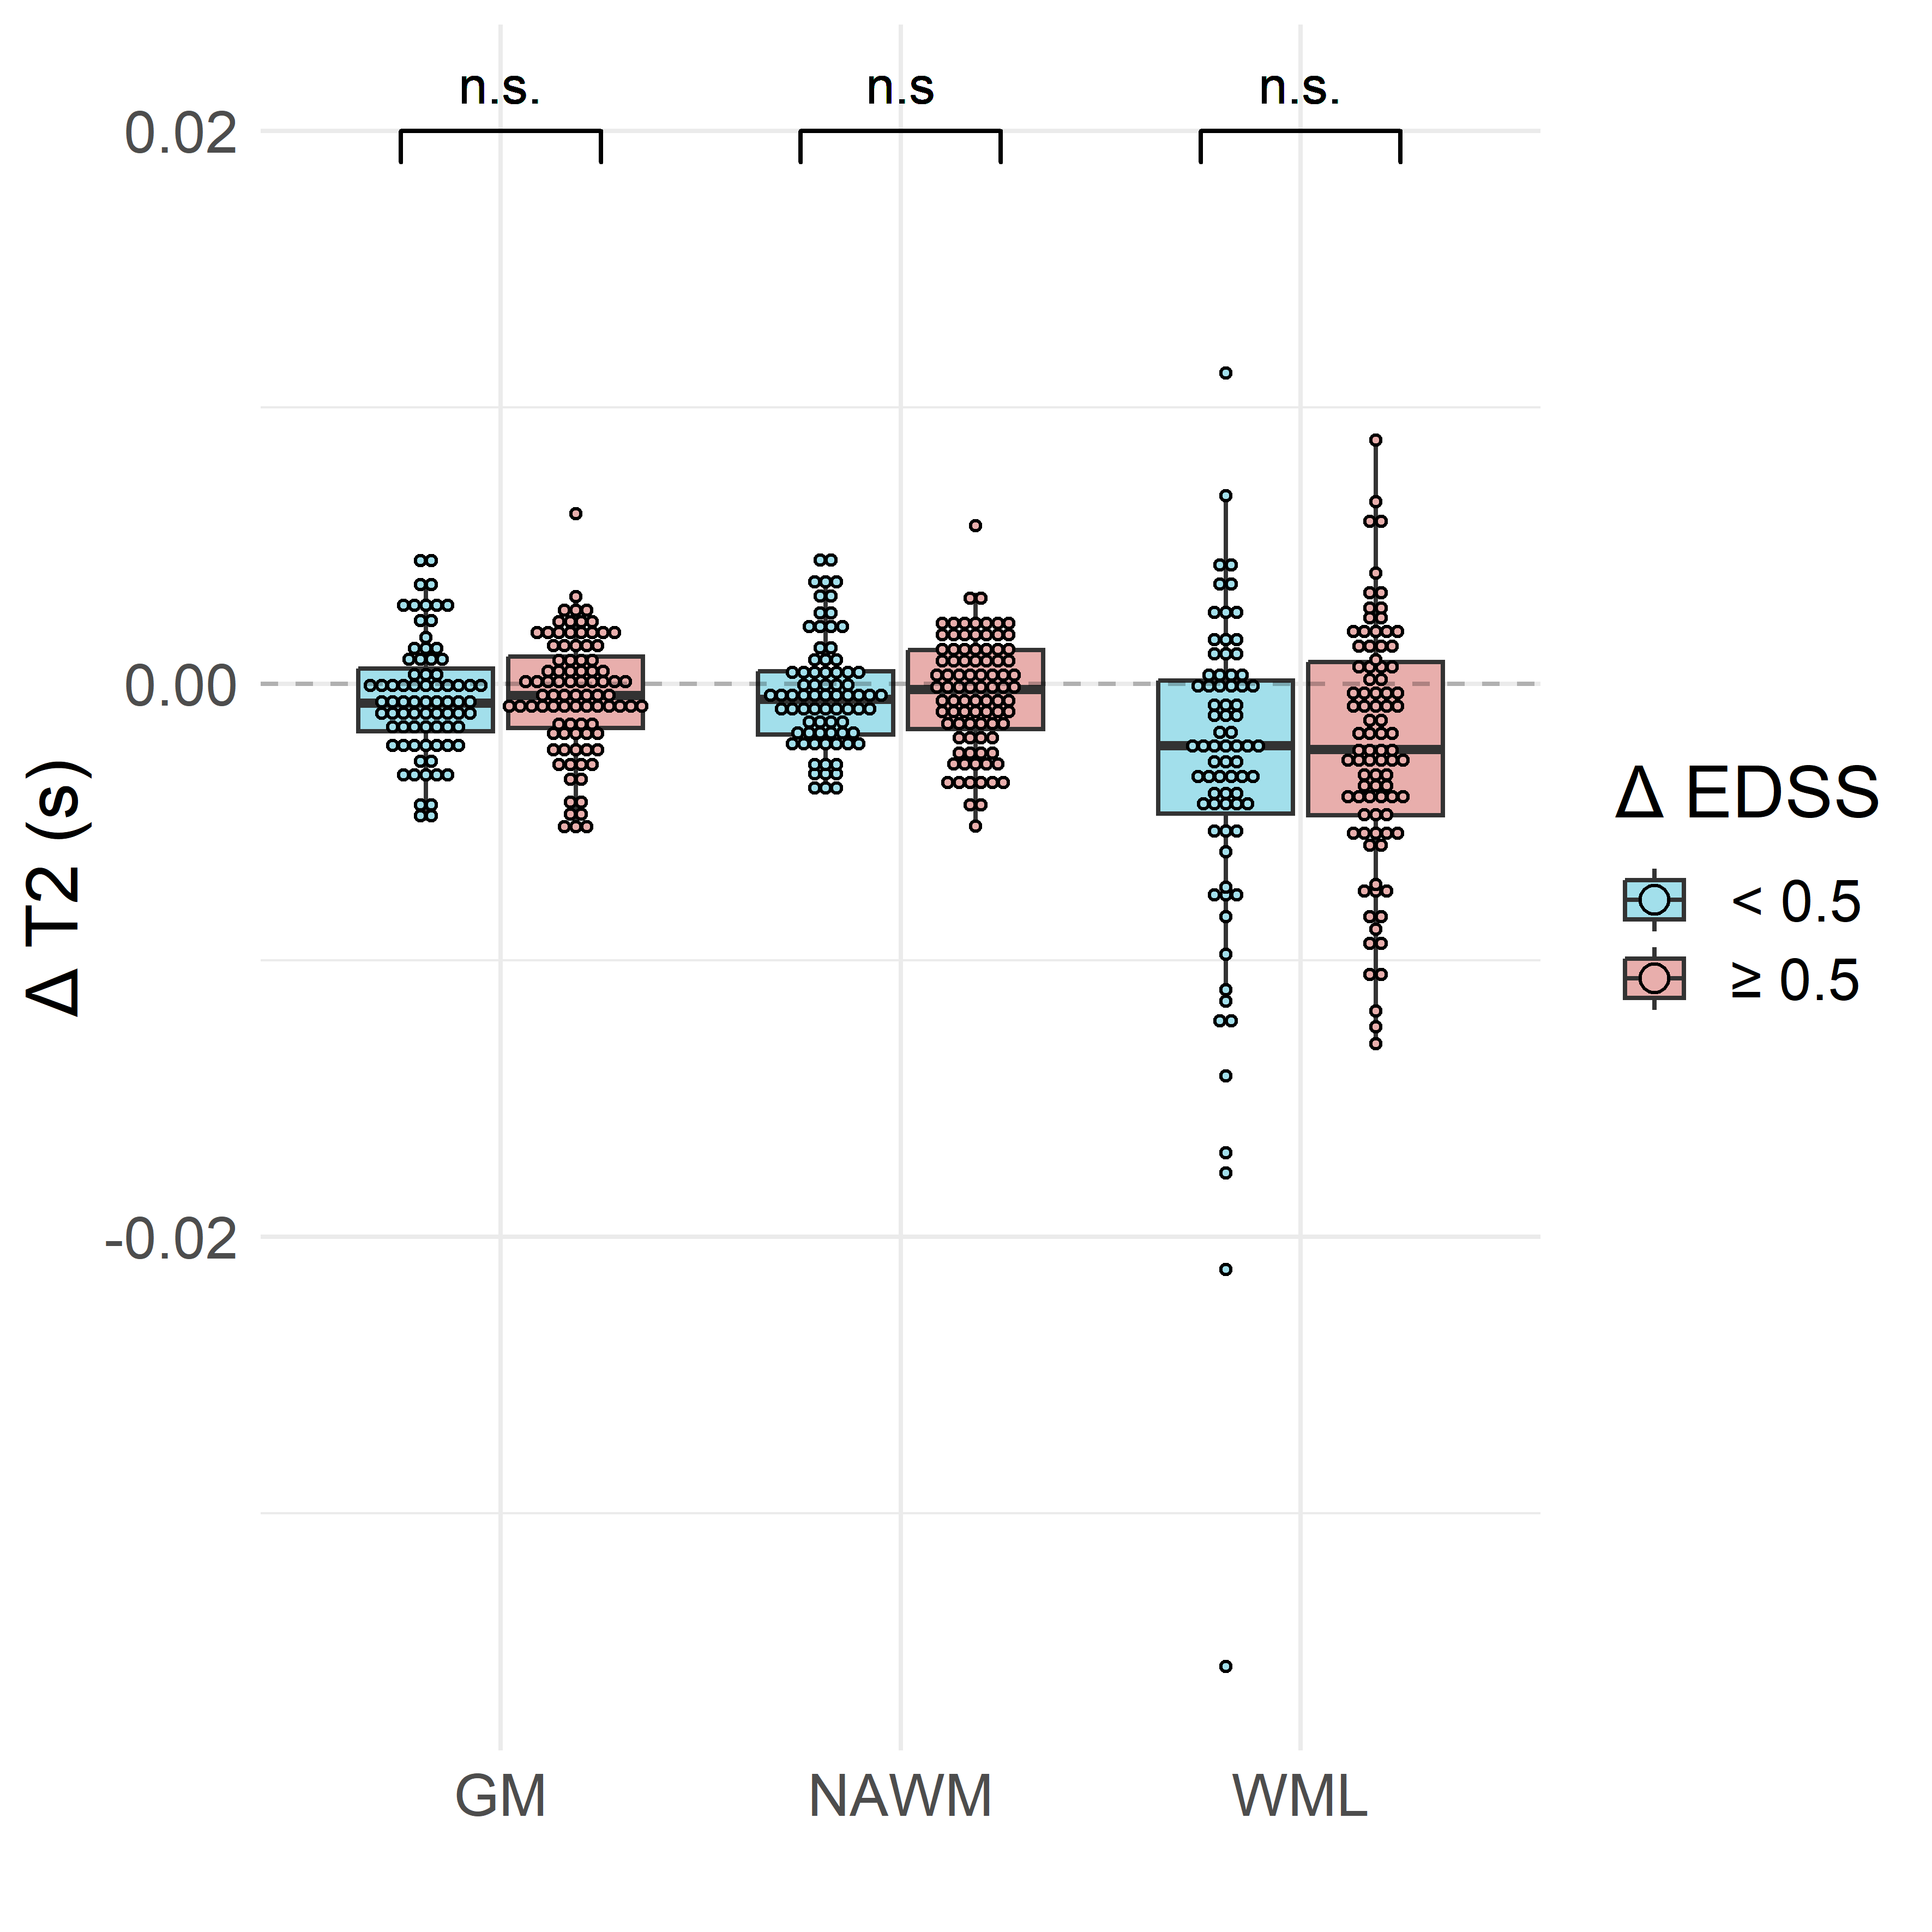
EDSS worsening was significantly associated with one-year NAWM and GM changes in T1.T2product (Figure 4, p=0.045 for both) but not one-year WML T1.T2product change (p=0.056) or T2 changes in any tissue type (Figure 5).
Discussion
Greater increases in NAWM and GM T1.T2product amongst participants with worsening disability suggests T1.T2product is a marker of disability-relevant tissue damage, despite no significant overall groupwise changes in T1.T2product in either tissue. T2 decrease across tissue types may reflect resolution of oedema from inflammatory episodes prompting diagnosis, but also other factors such as increased iron deposition. WML changes may be further confounded by new WML voxels at follow-up resulting from expanding lesions. VFA and dual echo sequences allow rapid acquisition, although other relaxometry methods may provide more reliable T1 and T2 estimation. T1.T2product associations with disability evolution appear largely driven by T1 increase, suggestive of progressive demyelination.Conclusion
T1 and T2 relaxometry and T1.T2product are promising markers of disability-relevant tissue damage in early RRMS, although T1 changes appear to dominate.Acknowledgements
We acknowledge support and funding from Scottish PhD Research & Innovation Network Traineeships Motor Neuron Disease/Multiple Sclerosis Studentship (MMPP/01, ENY), Anne Rowling Regenerative Neurology Clinic (ENY), NHS Lothian Research and Development Office (MJT),UK MS Society Edinburgh Centre for MS Research (grant reference 133, RM and AK). Future-MS, hosted by Precision Medicine Scotland Innovation Centre (PMS-IC), was funded by a grant from the Scottish Funding Council to PMS-IC and Biogen Idec Ltd Insurance (combined funding under reference Exemplar SMS_IC010).The study E161616 FutureMS was undertaken at the Edinburgh Imaging facility RIE (Royal Infirmary of Edinburgh), University of Edinburgh. Additional funding for the University of Edinburgh 3 T MRI Research scanner in Royal Infirmary Edinburgh is provided by Wellcome (104916/Z/14/Z), Dunhill Trust (R380R/1114), Edinburgh and Lothians Health Foundation (2012/17), Muir Maxwell Research Fund, Edinburgh Imaging and University of Edinburgh. This work is supported by the UK Dementia Research Institute which receives its funding from UK DRI Ltd., funded by the UK Medical Research Council, Alzheimer’s Society and Alzheimer’s Research UK. With special thanks to all Future-MS participants who have made this study possible, and non-author contributors of the FutureMS consortium.
References
1. Pareto D, Garcia-Vidal A, Alberich M, et al. Ratio of T1-Weighted to T2-Weighted Signal Intensity as a Measure of Tissue Integrity: Comparison with Magnetization Transfer Ratio in Patients with Multiple Sclerosis. AJNR Am J Neuroradiol. Mar 2020;41(3):461-463. doi:10.3174/ajnr.A64812. Righart R, Biberacher V, Jonkman LE, et al. Cortical pathology in multiple sclerosis detected by the T1/T2-weighted ratio from routine magnetic resonance imaging. Ann Neurol. Oct 2017;82(4):519-529. doi:10.1002/ana.25020
3. Cooper G, Finke C, Chien C, et al. Standardization of T1w/T2w Ratio Improves Detection of Tissue Damage in Multiple Sclerosis. Front Neurol. 2019;10:334. doi:10.3389/fneur.2019.00334
4. Kearns PKA, Martin SJ, Chang J, et al. FutureMS cohort profile: a Scottish multicentre inception cohort study of relapsing-remitting multiple sclerosis. BMJ Open. Jun 29 2022;12(6):e058506. doi:10.1136/bmjopen-2021-058506
5. Meijboom R, Wiseman SJ, York EN, et al. Rationale and design of the brain magnetic resonance imaging protocol for FutureMS: a longitudinal multi-centre study of newly diagnosed patients with relapsing-remitting multiple sclerosis in Scotland. Wellcome Open Research. 2022;7. doi:10.12688/wellcomeopenres.17731.1
Figures