2973
Temporal and spatial changes in Cerebral Blood Flow during fatigue resulting from maximum isometric contraction of the forearm1University of Sussex, Brighton, United Kingdom, 2Rochester Institute of Technology, Rochester, NY, United States, 3University of Brighton, Brighton, United Kingdom
Synopsis
Keywords: Multiple Sclerosis, Arterial spin labelling, exercise, fatigue, celebral blood flow
Motivation: While fatigue is a common symptom in neurological conditions such as Multiple Sclerosis and Parkinson's, there is currently a lack of MRI studies that have investigated the CBF response to fatigue.
Goal(s): To use ASL MRI to capture dynamic changes in CBF as muscles fatigued during maximal isometric effort.
Approach: ASL CBF images were acquired pre, during, and post exercise on 7 healthy volunteers.
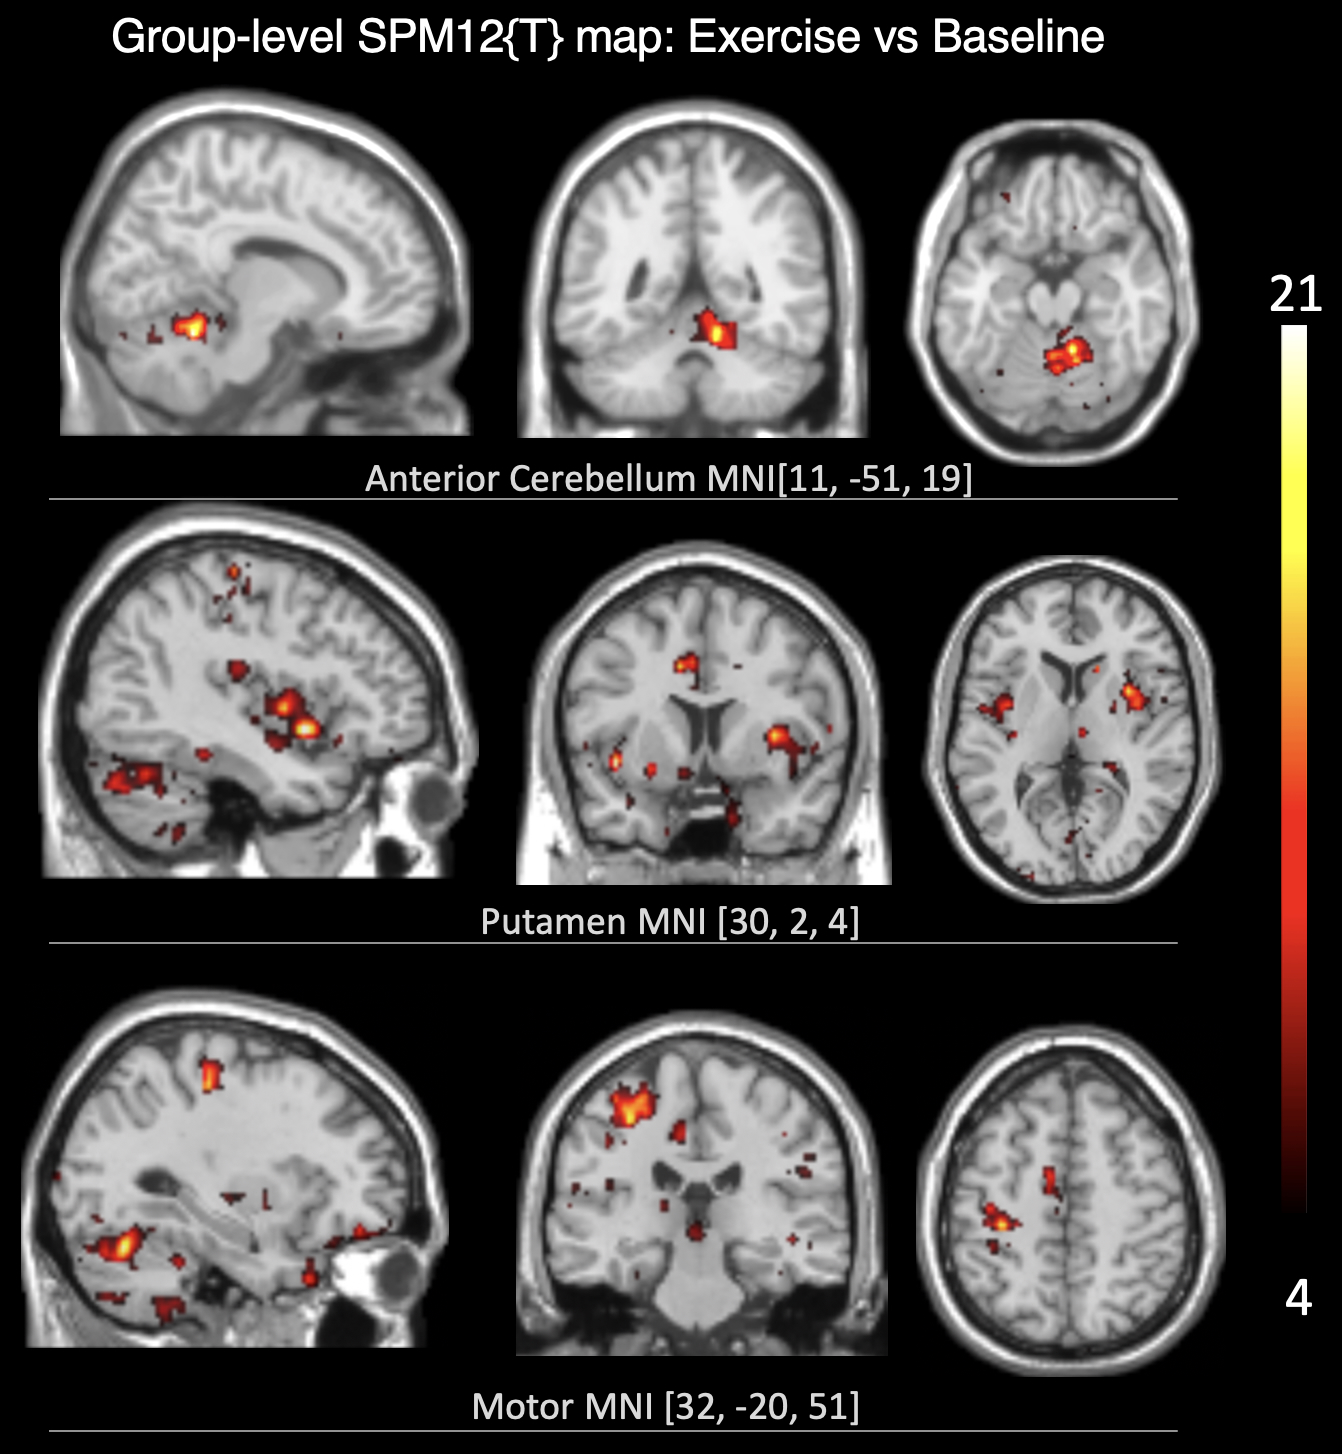
Results: Primary motor cortex, supplementary motor cortex, putamen, and anterior cerebellum showed an increase in CBF followed by a gradual return to the baseline with a delay between the start of the decrease in CBF and the fatigue onset.
Impact: As the use of MRI in neurological diseases involving fatigue continues to grow, the concurrent measurement of CBF alongside other physiological parameters holds the potential to yield valuable insights that could contribute to advancement of effective treatments and preventive strategies.
Introduction
Exercise plays a significant and multifaceted role in brain function, promoting neuroplasticity and enhancing cognitive abilities, among other benefits1. These studies have shown that exercise increases cerebral blood flow (CBF)1,2. These studies, however, have predominantly relied on measuring CBF in large arteries rather than at the tissue or regional levelsr2. Here, the aim was to use ASL MRI to assess gray matter (GM) CBF before, during, and after exercise in healthy volunteers. The objective was to determine whether ASL could capture dynamic changes in GM CBF as the targeted muscles (right wrist extensors) fatigued during a long-lasting maximal isometric effort.The motivation stemmed from the implication of fatigue in neurological diseases3. Muscle fatigue, characterized as a reduction in the capacity of a muscle or group of muscles to generate force, can be influenced by a range of physiological and neurological factors as well as factors like exercise intensity, duration, and fitness level. Notably, fatigue is frequently cited as a symptom in neurological conditions such as Multiple Sclerosis (MS) and Parkinson's3. As MRI has become integral in the diagnosis and research of these diseases, the availability of an MRI-based method capable of providing a reliable and sensitive measurement of CBF stands to offer valuable insights into the complex interplay between CBF and other structural and functional factors associated with these conditions. These insights could significantly advance the development of more effective treatments and preventive measures.
Methods
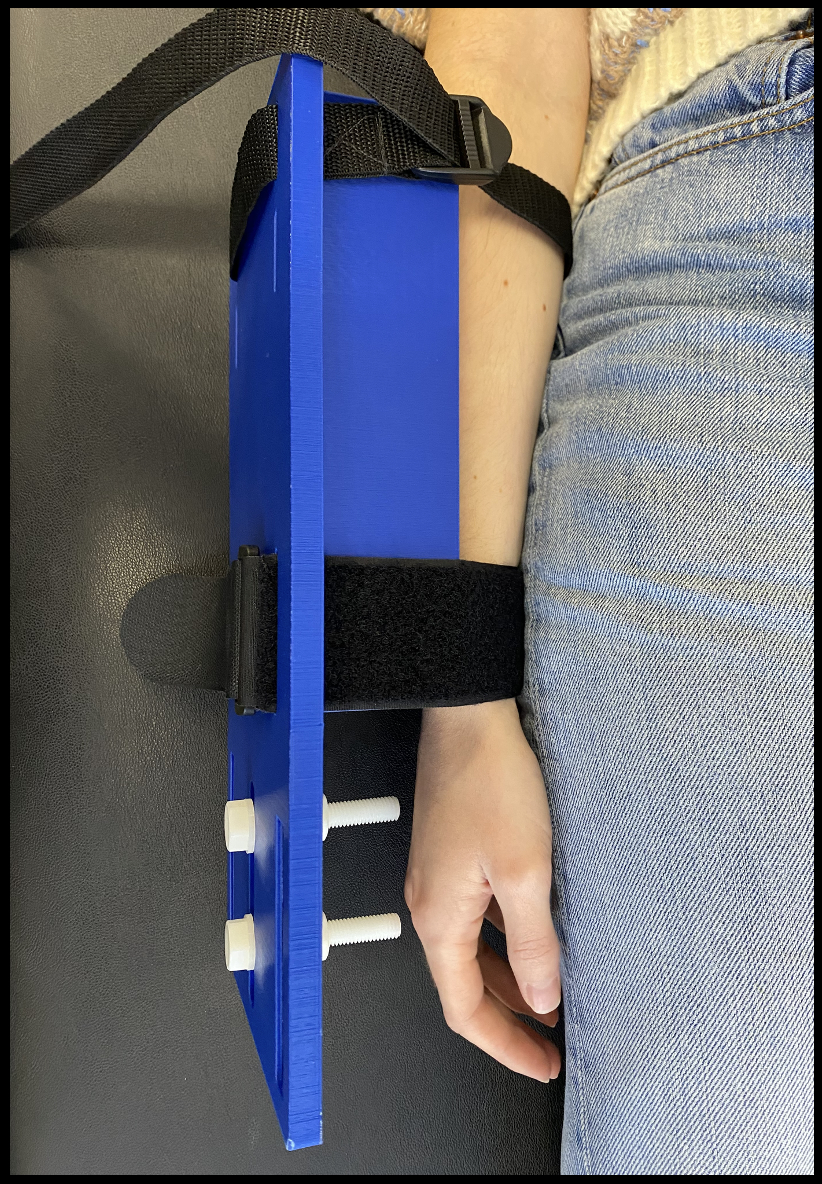
A custom-made MRI-compatible 3D-printed device was constructed to secure the forearm in a standardized position (radial styloid process at the end of the supporting block, Figure-1). Isometric wrist extension force was applied laterally at a standardized location (1cm proximal to the middle metacarpophalangeal joint) and was measured through an MRI-compatible force transducer. Force data were collected via an MRI compatible dynamometer (MP3X; Biopac, USA).Background suppressed pCASL4 images were acquired on 7 healthy young volunteers (age=21±2 years, 2 men) on a 3T Siemens Prisma system with: TE=14ms, TR=4500ms, labeling duration=1900ms, post-labeling duration=1900ms. Each condition: baseline, followed by exercise, and then rest, was acquired with 28 control/label pairs. : A T1w (MPRAGE) 1x1x1mm3 was also acquired for coregistration and tissue segmentation purposes.
For each participant, the CBF was computed using SPM12 routines and in-house developed software as previously described5, and included partial-volume correction (PVC) of the mean CBF for each condition5. Voxelwise paired t-tests were run to test for regional changes in CBF across conditions at both the single-particiapnt and group levels. The time-course of CBF data from regions that showed significant difference in CBF between exercise and baseline/rest conditions were compared with Force time-course measures obtained from the transducer. MatLab code was written to measure CBF in ROIs that showed significant change in CBF between exercise and baseline/rest conditions. Only voxels that survived the preset threshold (α=0.05, p=0.001, cluster level=80 voxels) were included.
Results
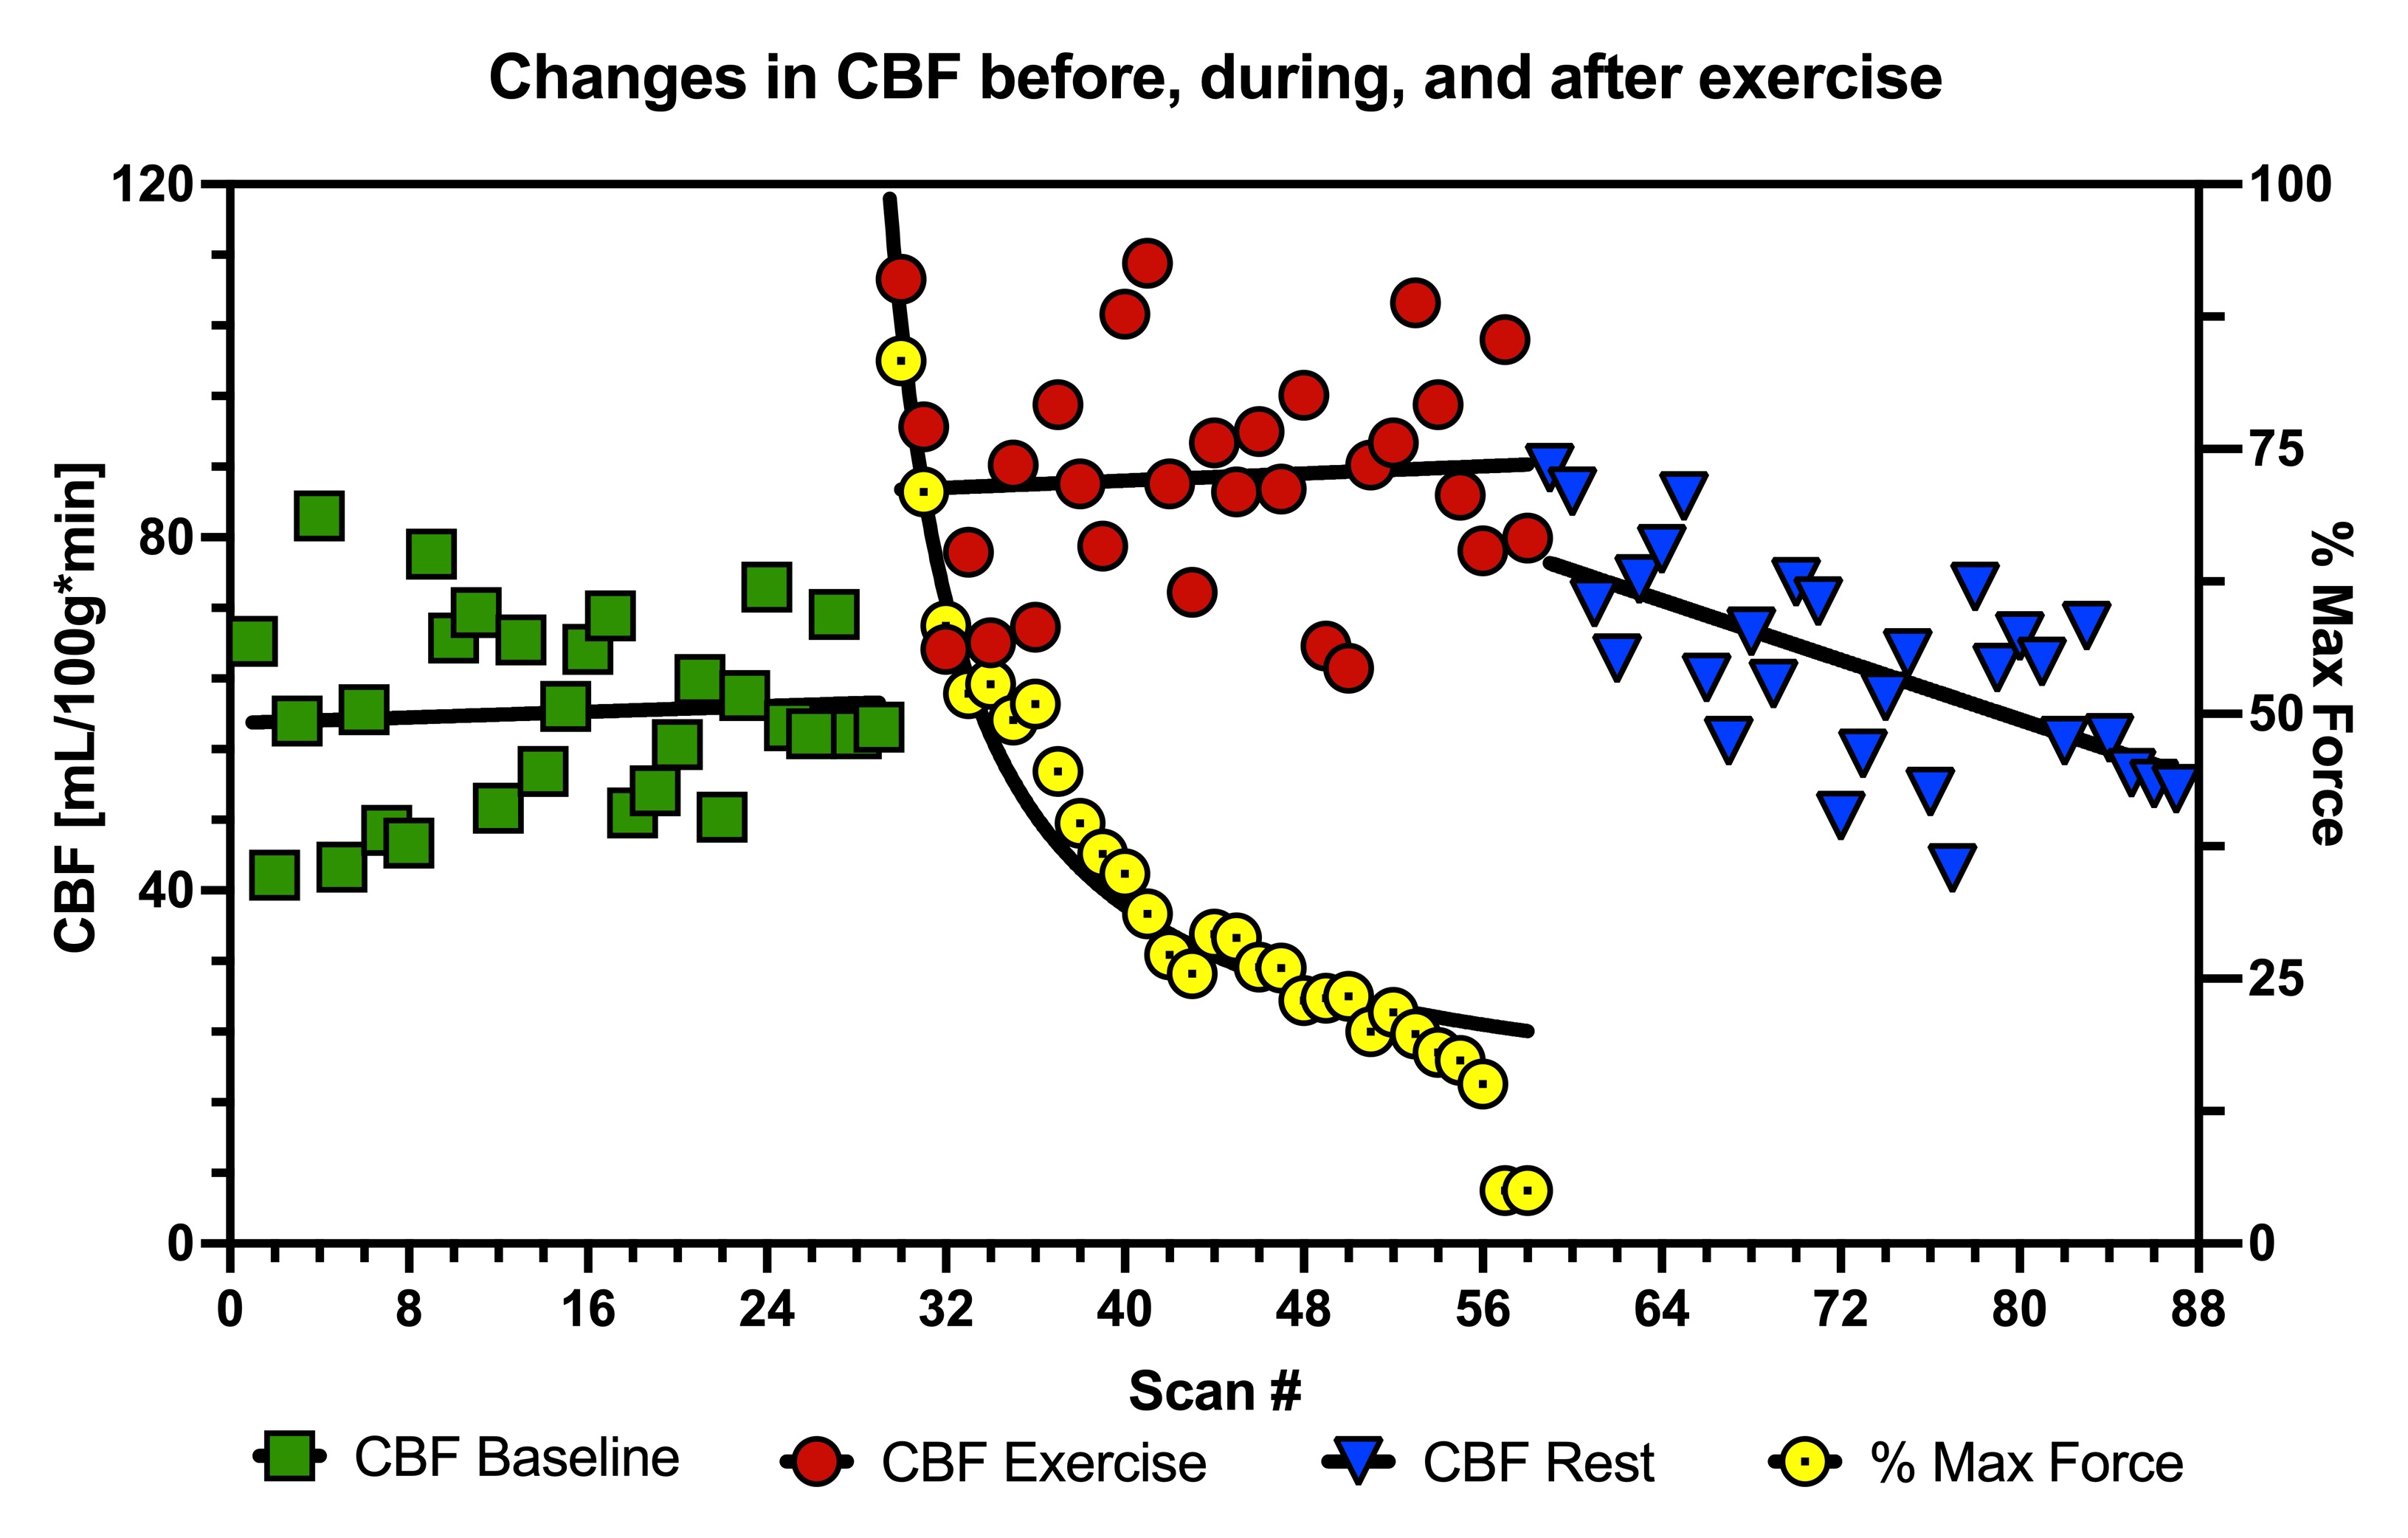
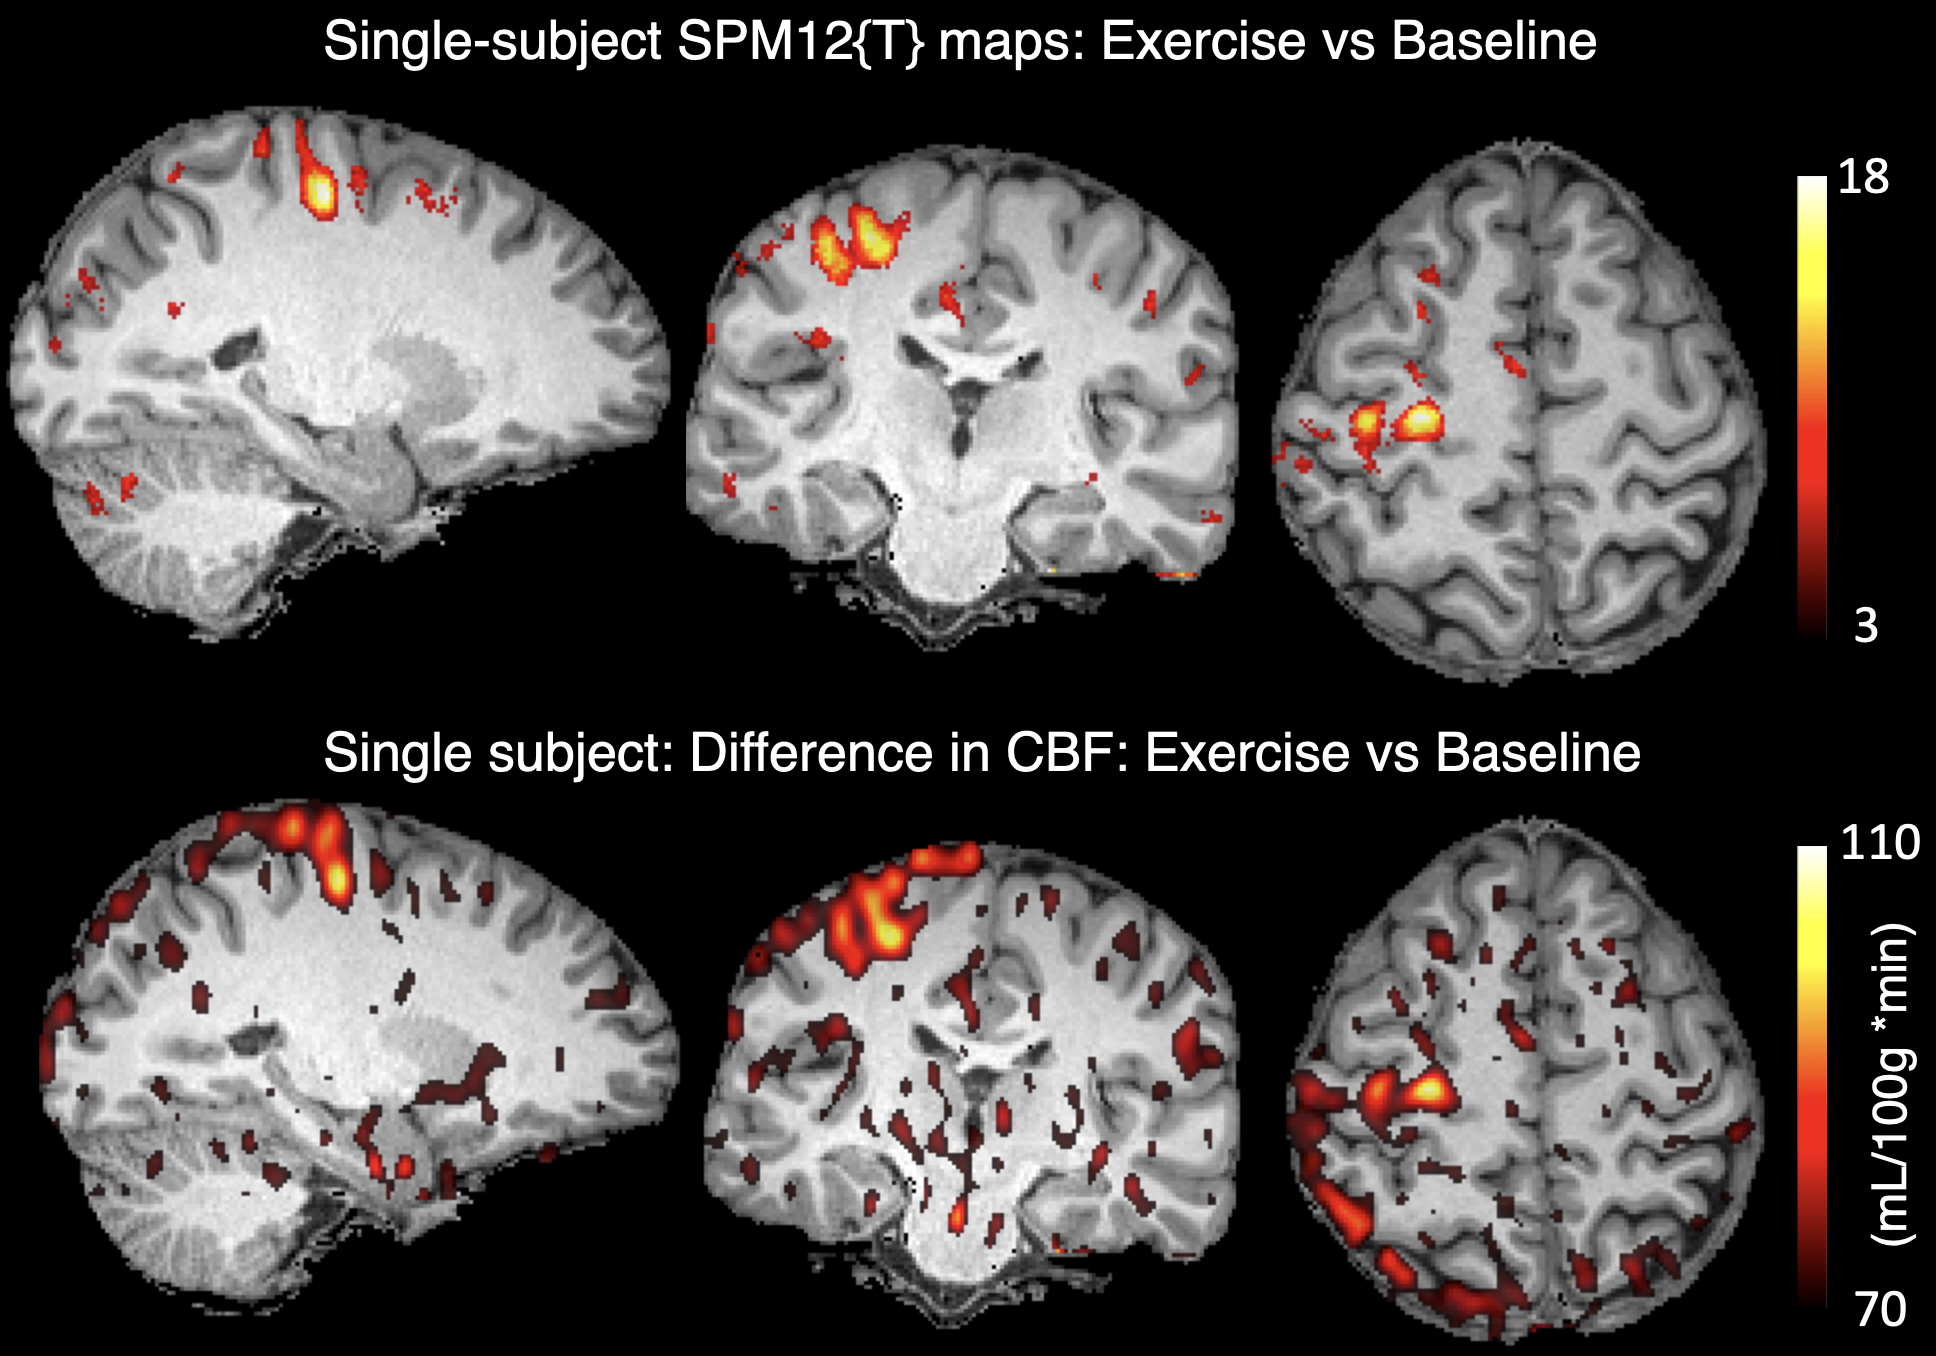
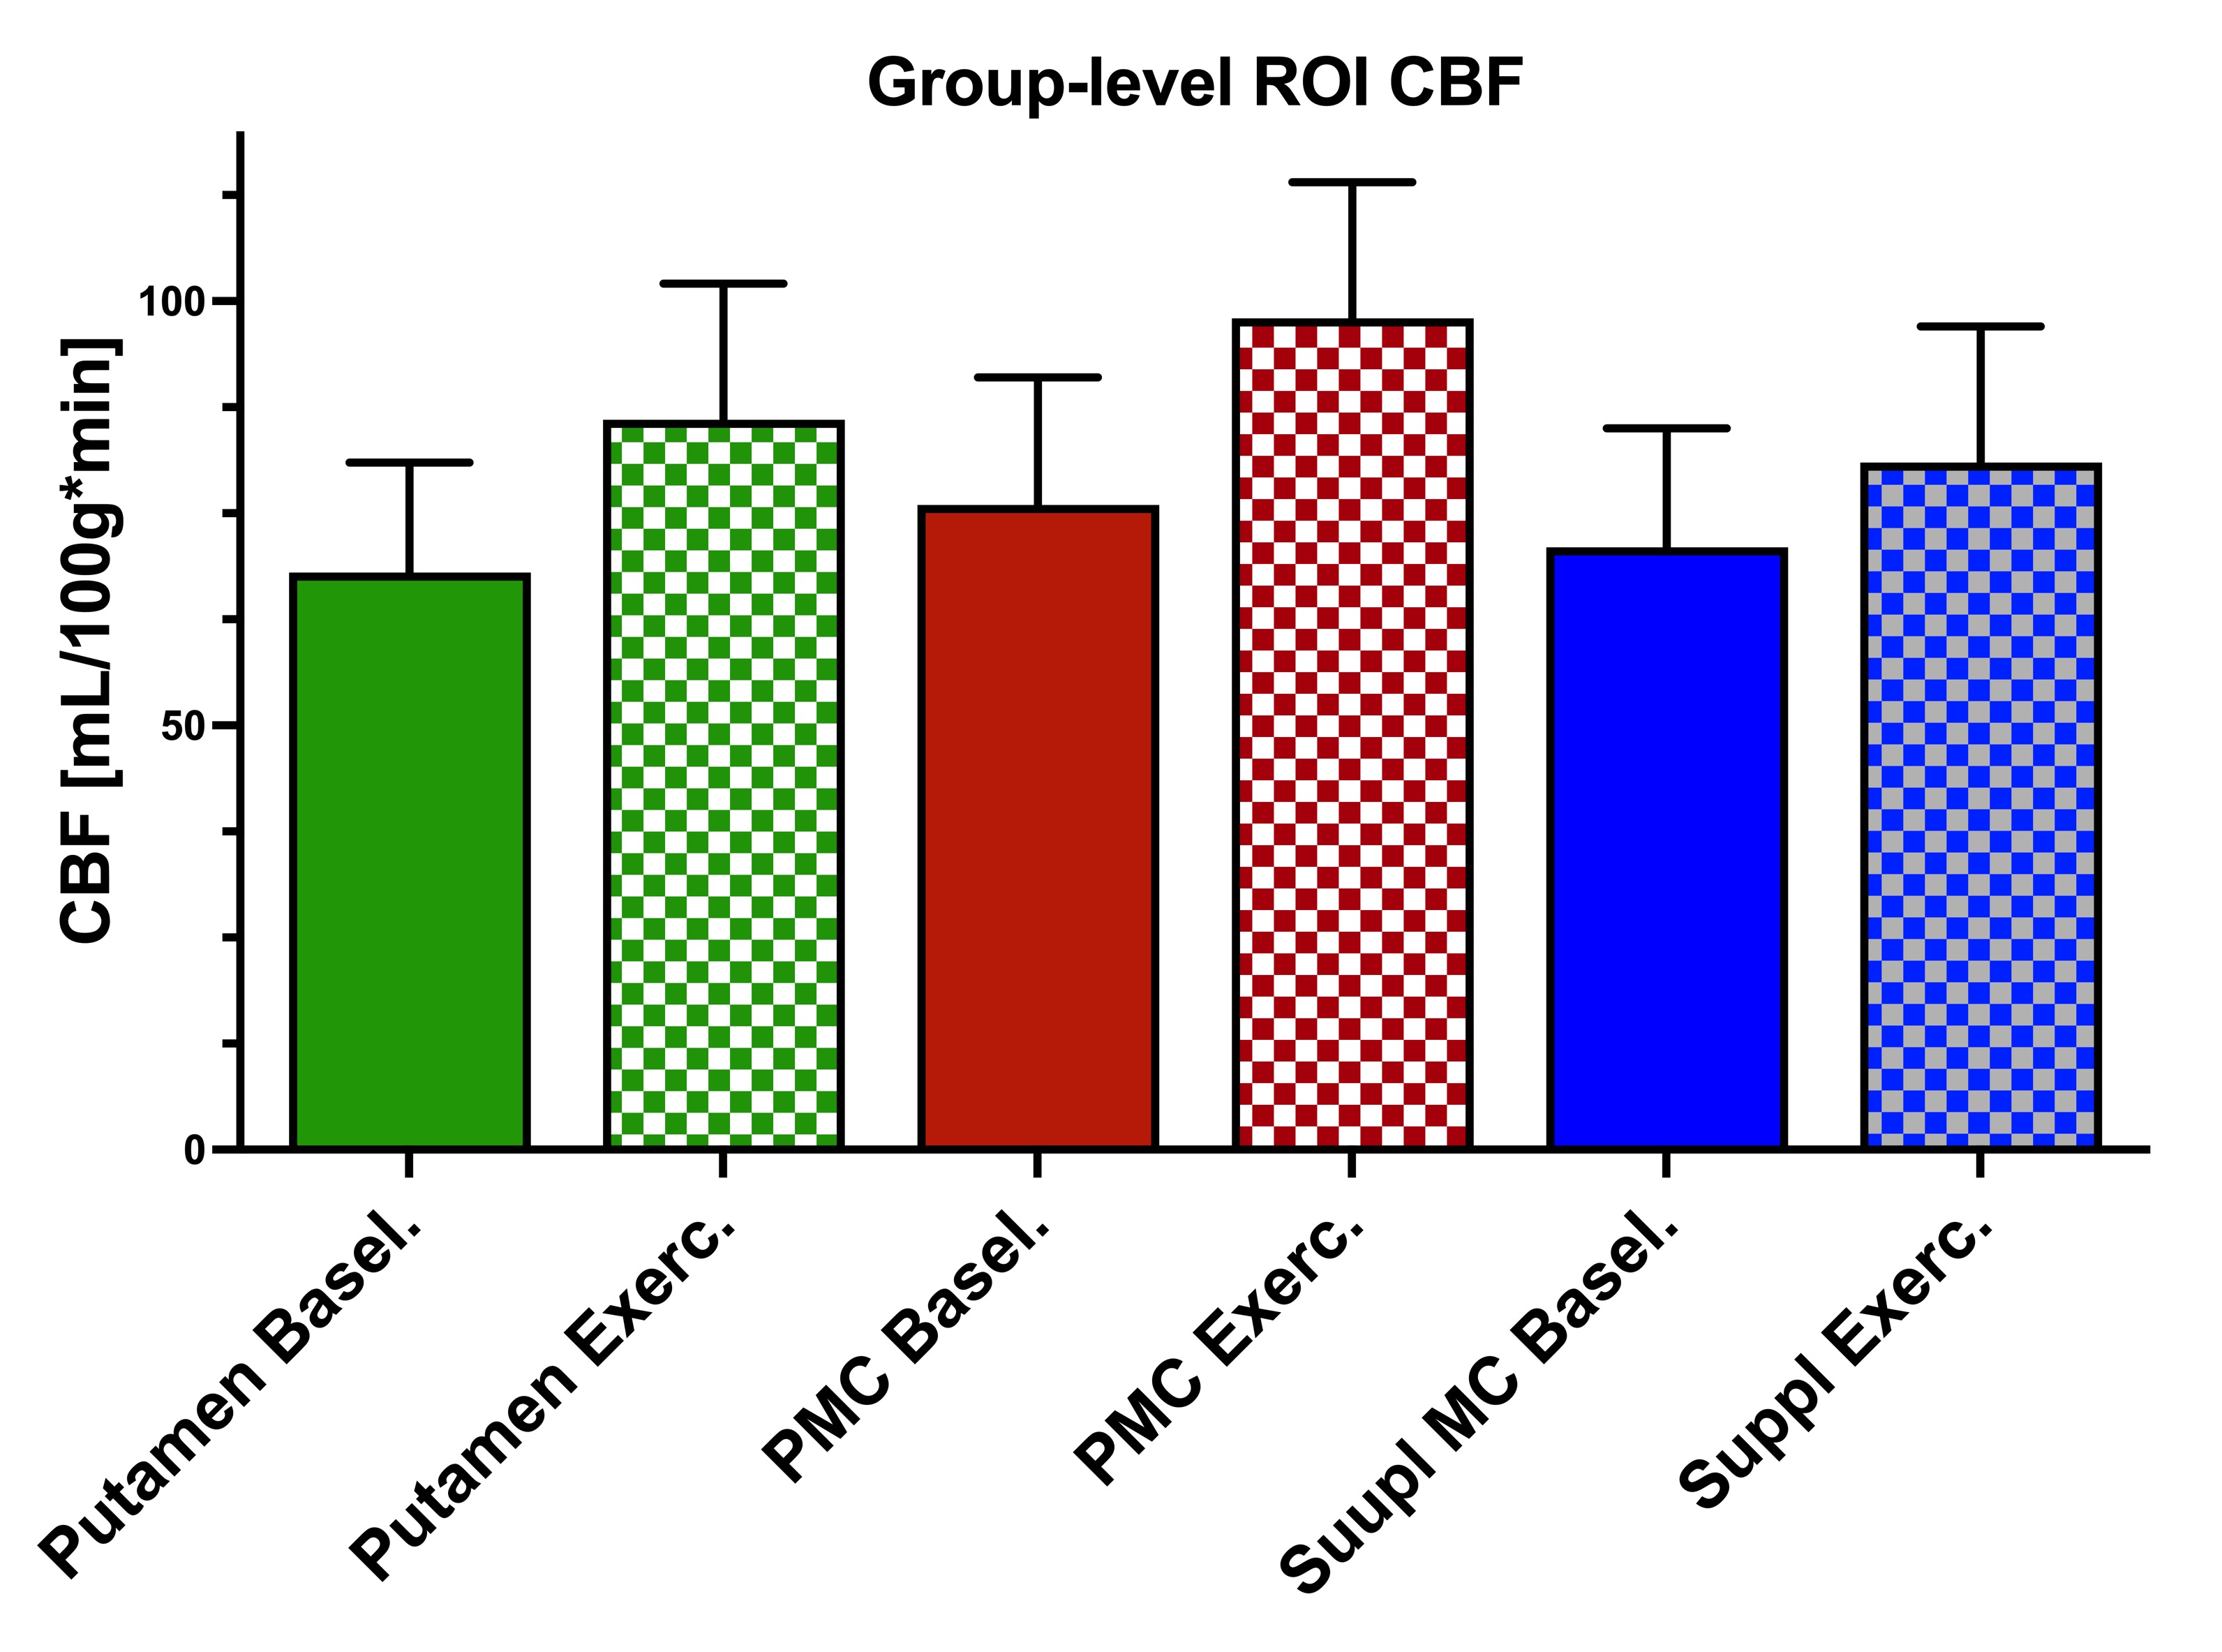
Figure-2 shows the time-course of CBF and Force in the primary motor cortex (PMC) for one of the participants; data from all participants showed a similar pattern in that there was: (1) an increase in CBF with exercise; (2) a gradual decrease in CBF during "rest"; (3) a lag in the onset of the CBF decrease to the baseline level and the decline in force. For the same participant, regions where CBF was significantly higher during exercise compared with baseline CBF are shown in Figure-3.At the group level: The correlation between CBF and time at baseline and during exercise was found to be negligible (R2 < 0.004, p > 0.7). Force exhibited a pronounced hyperbolic decline (R2 = 0.877, p = 0.0001). During the "rest" period, CBF showed a discernible negative slope (R2 = 0.48, p = 0.001). The primary motor control (PMC), the supplementary (Suppl), Putamen, and Anterior Cerebellum were the ROIs that showed significant change in CBF with exercise; results from these ROIs are summarized in Figure-4, with Figure-5 showing the T-maps from the paired T-test analysis.
Discussion
This study marks the first instance of using ASL MRI to assess dynamic changes in tissue CBF associated with maximum-effort isometric muscle contraction. The regional, tissue-level results appear to align with patterns observed in major arteries using Doppler and Xe-clearance techniques1, confirming there is an initial increase in CBF followed by a gradual return to baseline levels1. All participants exhibited a delay in the onset of CBF decrease back to baseline compared to the onset of fatigue. However, there were variations in this overall pattern among individuals, suggesting that other factors may influence the CBF response to fatigue6.Acknowledgements
Authors are grateful to Samira Bouyagoub for helping with the experimental set-up and data collection, and Daniel Brooks for his assistance with 3D printing.References
1Ogoh S. and Ainslie P. N., J Appl Physiol 107 (2009); 2Mast I.H. et al., NeuroImage 250 (2022); 3Kluger et al., Neurology 80(4) (2013); 4Alsop D.C., et al., Mag Res Med, 73(1), (2015); 5Asllani I, et al., Mag Res Med 60(6), 2008. 6Smith K.J. and Ainslie P.N., Experimental Physiol., (2017).Figures