2968
Lesion-Aware Myelin-Weighted Connectomics in the phase II SYNERGY Trial1Diffusion Imaging and Connectivity Estimation (DICE) Lab, Department of Computer Science, University of Verona, Verona, Italy, 2Translational Imaging in Neurology (ThINK) Basel, Department of Biomedical Engineering, University of Basel, Basel, Switzerland
Synopsis
Keywords: Multiple Sclerosis, Neurodegeneration
Motivation: Microstructure-informed tractography methods face challenges in presence of focal lesions.
Goal(s): This study aims to apply an extension of Myelin Streamline Decomposition (MySD) which accounts for lesions to patients with multiple sclerosis (MS) enrolled in a completed phase 2 clinical trial (SYNERGY) with conventional DTI acquisitions.
Approach: We applied our novel approach to perform network analysis in SYNERGY’s secondary progressive (SP) and relapsing-remitting (RR) patients.
Results: Using MySD applied to patients with focal pathology, we showed that SPMS patients had increased alterations in myelin-weighted network properties compared to RRMS. Myelin-weighted networks also exhibited correlations with motor and cognitive impairment.
Impact: For the first time, we applied our novel connectomics approach explicitly designed to cope with focal pathology to MS patients in a clinical trial, demonstrating its sensitivity and adaptability to real-world clinical data.
Introduction
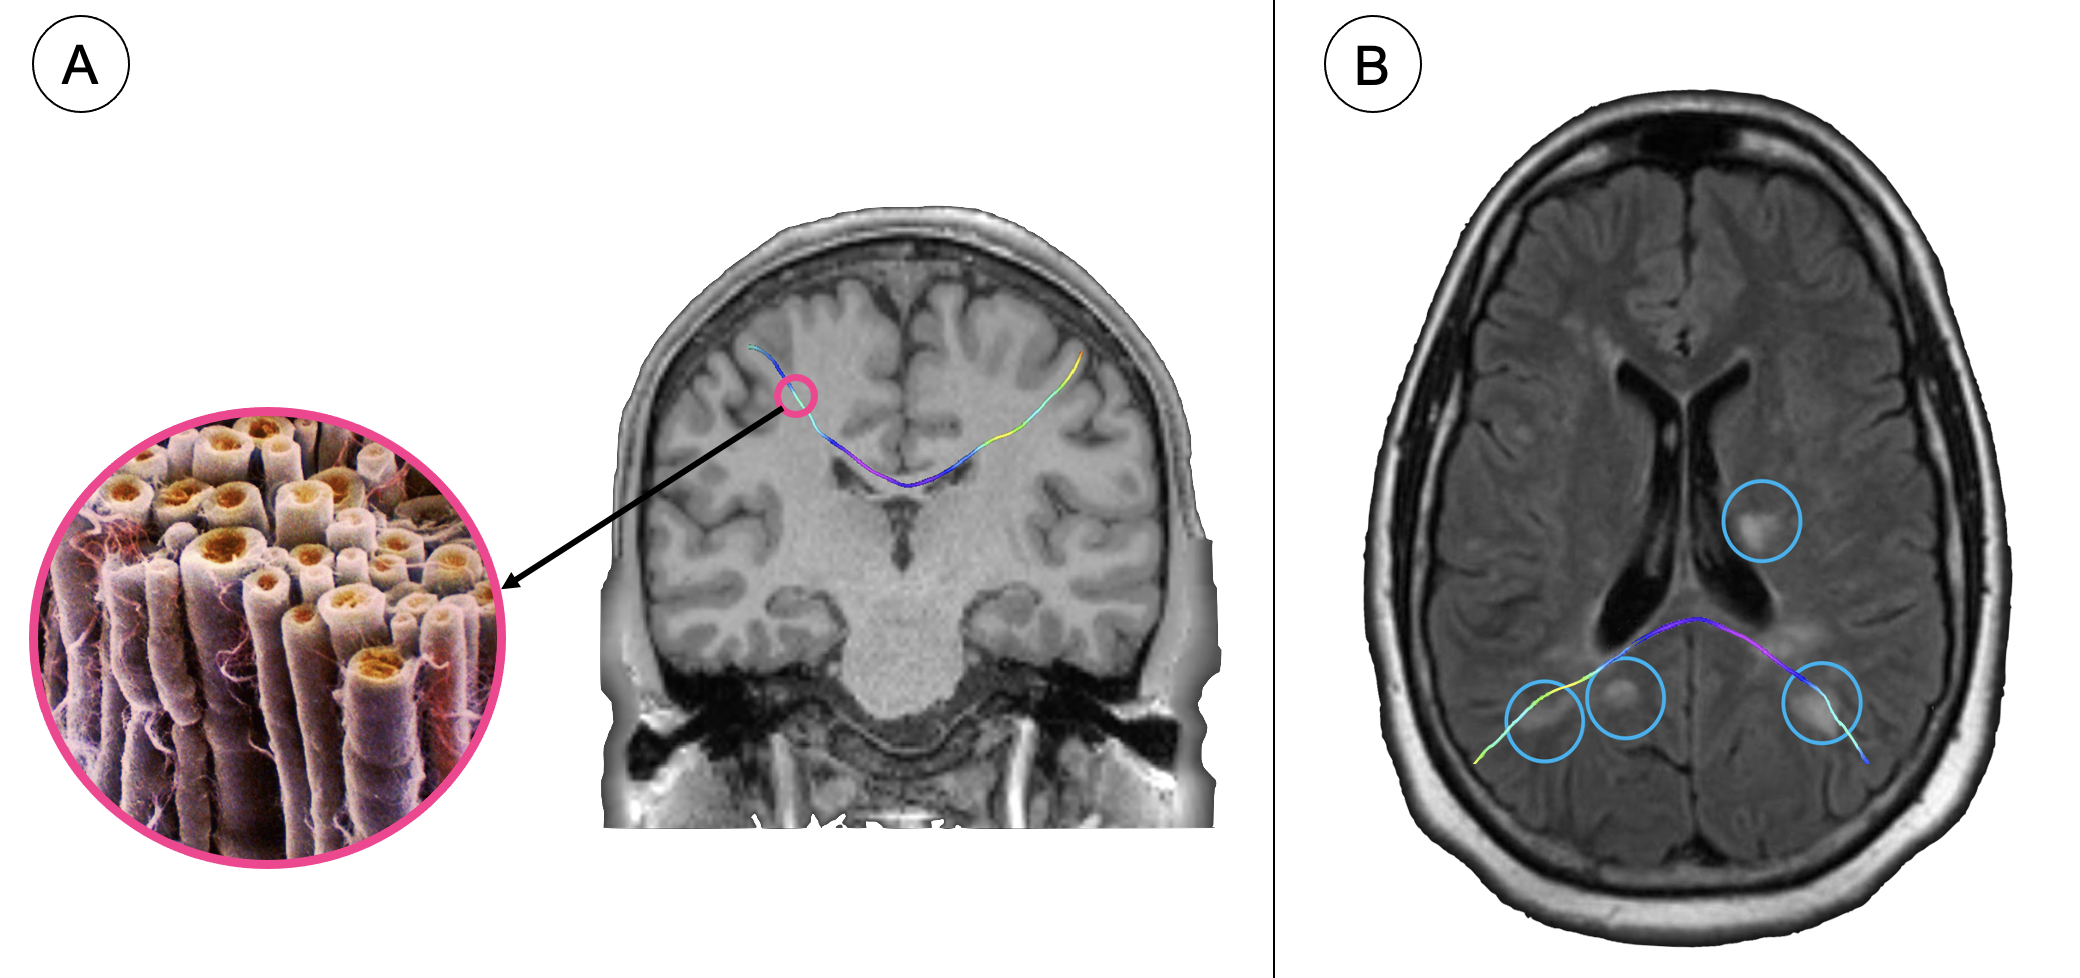
In recent years, microstructure-informed tractography methods have shown to provide biologically meaningful tractography by extracting quantitative information from diffusion-weighted images (DWI)1–7. However, these methods assume constant microstructural values along streamlines, which may not be reliable in the presence of focal white matter (WM) lesions (Figure 1). Myelin Streamline Decomposition (MySD) is a microstructure-informed tractography method that allows the unbiased assessment of the effective myelin cross-sectional area of each WM bundle7. A recent extension of the model enabled the application of MySD in the presence of focal WM lesions. This adapted model proved to be reliable in advanced acquisition protocols typically used for research purposes. In this study, we explored MySD's applicability to multiple sclerosis (MS) patients in a phase 2 clinical trial.This work innovates in three key aspects: (i) the integration of myelin-sensitive maps into structural connectivity estimation, (ii) the extension of the MySD technique to pathologies that are characterized by focal lesions, and (iii) the application to data acquired using standard acquisition protocols in a clinical trial setting.
Methods
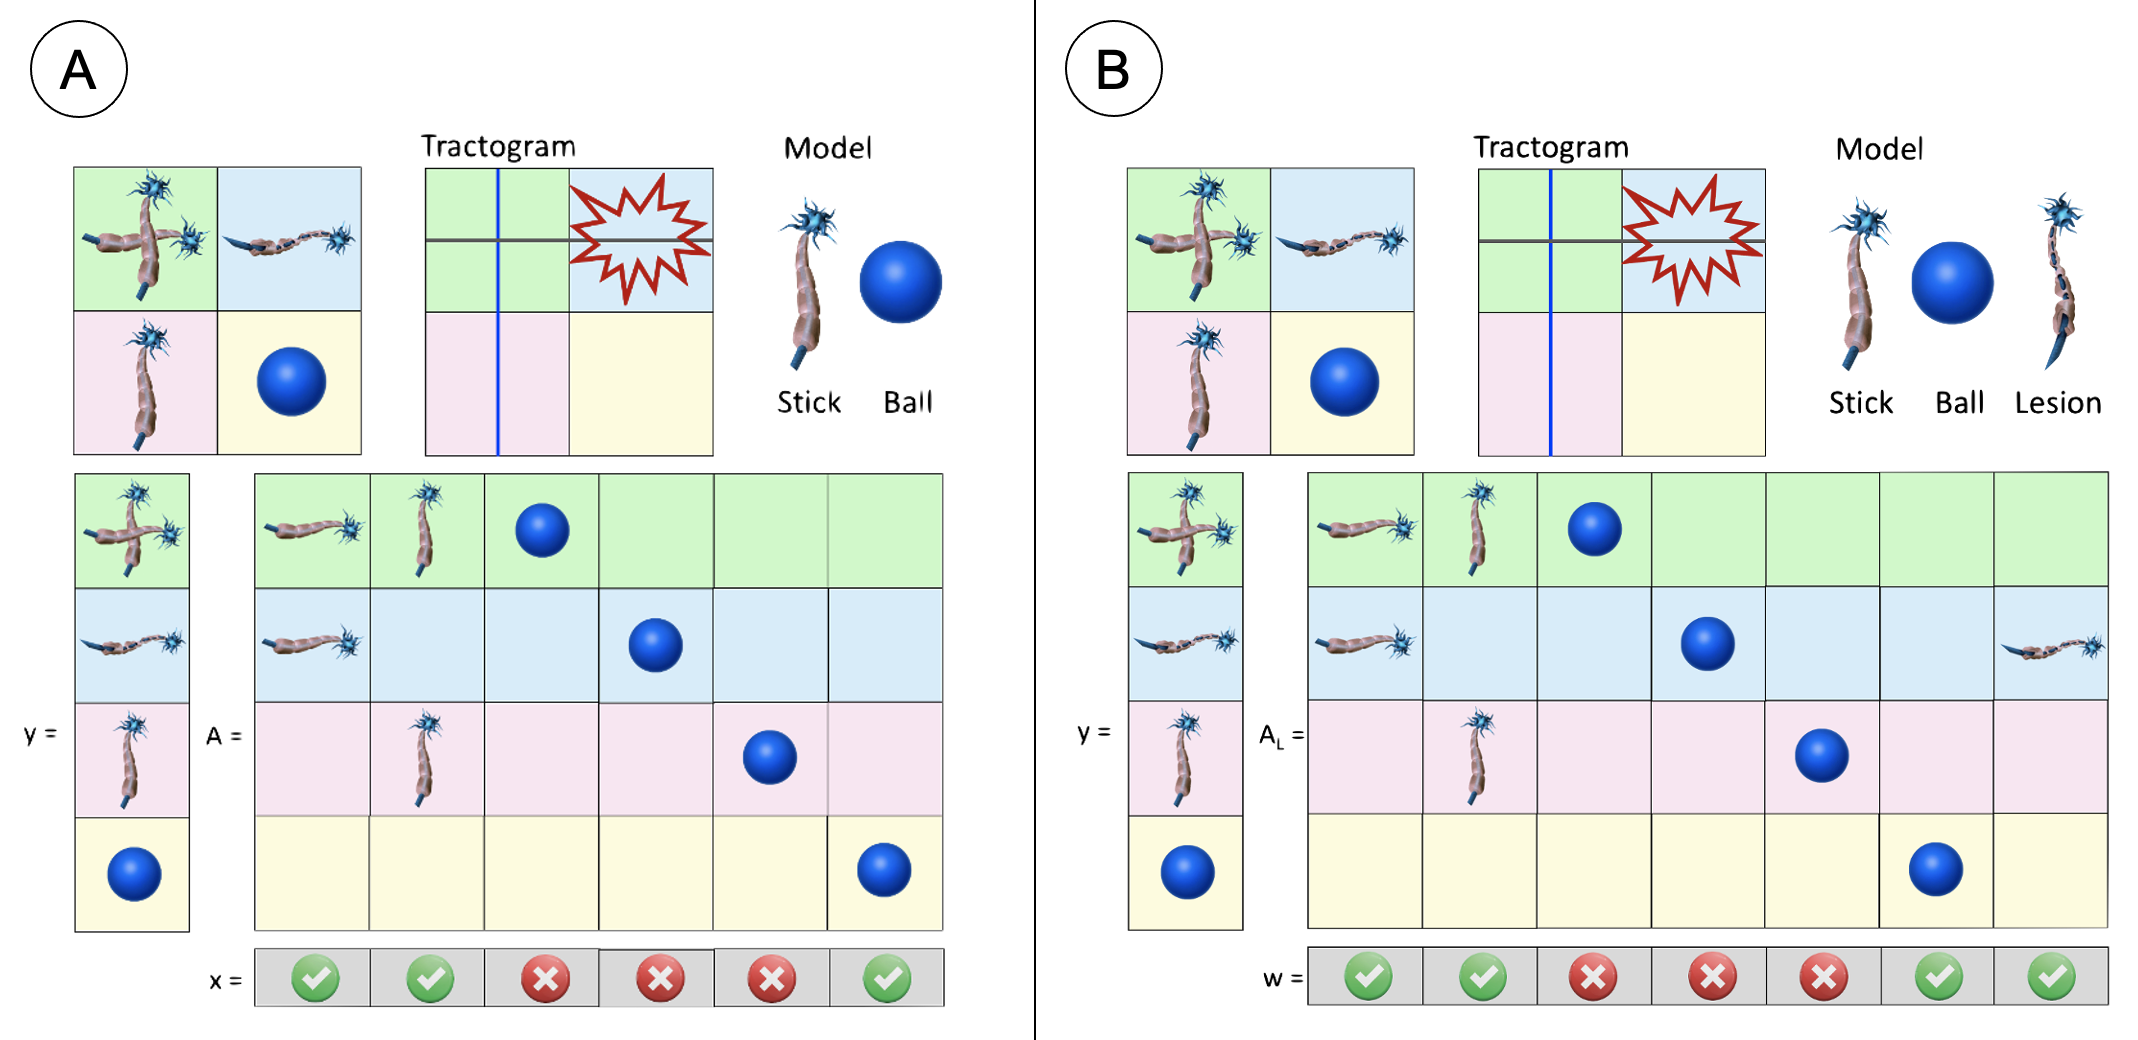
In its original version, MySD uses a matrix A to describe the signal in each voxel (Figure 2A). The extension of the model (lesion sensitive MySD) expands matrix A to AL by adding a column for each lesion voxel to describe the signal loss at those locations. The model's fitted contributions w = [wM | wL] combine contributions from both the myelin and lesion compartments. Furthermore, a reduction coefficient R is introduced to account for axonal damage sensitivity, derived from the relative variance between myelin and lesion contributions. The weight assigned to each streamline is now equal to the myelin contribution fitted by the model, multiplied by the minimum R found along its path: $$\hat{c}_i = \mathbf{x}^{M}_{i} \min_{0<i<1} R[s(t)]$$ (Figure 2B).The method was applied cross-sectionally to baseline data from the SYNERGY clinical trial8 consisting of 112 relapsing-remitting (RR) (70 female, mean age 37.29±9.42, mean Expanded Disability Status Scale-EDSS 2.9±1.2) and 33 secondary progressive (SP) MS patients. The images were acquired on a 1.5T and 3T Siemens scanners. The acquisition protocol included single shell DWI (TR/TE=9.8/0.102) 1.25x1.25x2.5mm3, with b=0,1000s/mm2 and 1/30 measurements; pre-gadolinium T1-w (TR/TE=0.03/0.007) 1x1x3mm3, and Magnetization Transfer (MT) with and without MT pulse (TR/TE=0.035/0.007). Lesion-sensitive MySD was applied on images with and without MT pulse enabling MTR-weighted connectome calculation as previous described in9. From each connectome, we extracted 4 global network measures: mean strength, efficiency, modularity, and clustering coefficient. We used a robust linear regression model to test two main hypotheses: H01) Demyelination's impact on weighted global networks is similar between RR and SP MS patients, controlling for sex, age, age2, and educational years; H02) Changes in the weighted network are unrelated to cognitive (Symbol Digit Modality Test, SDMT) and disability (expanded disability status scale, EDSS) scores, controlling for age of disease onset, age, age2, sex, and number of relapses in the last two years.
Results
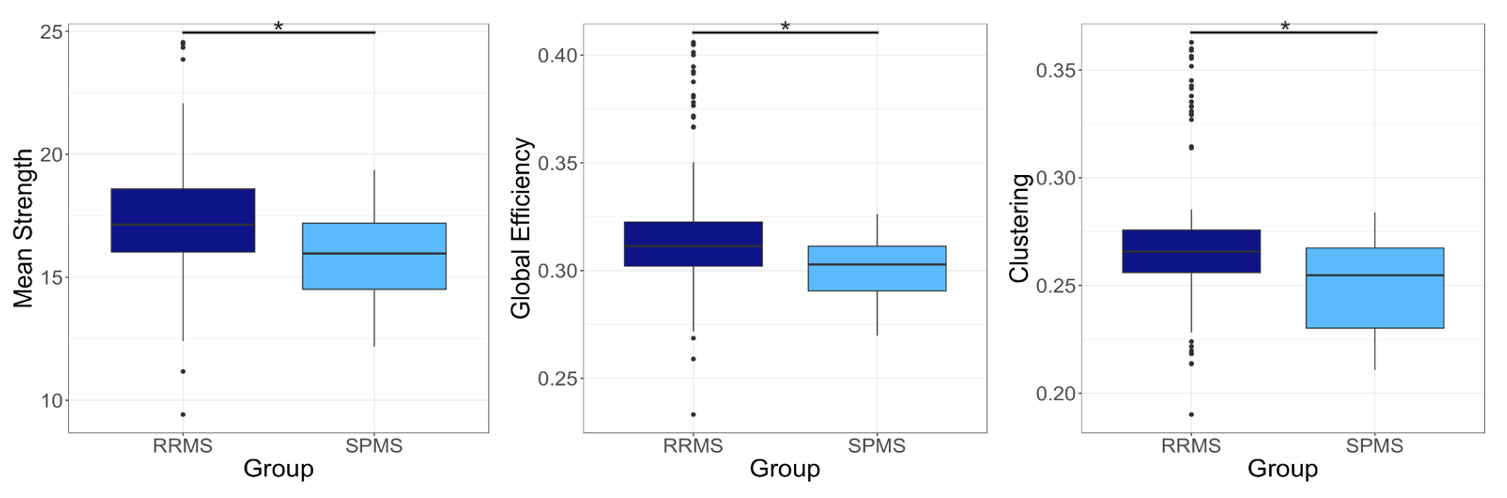
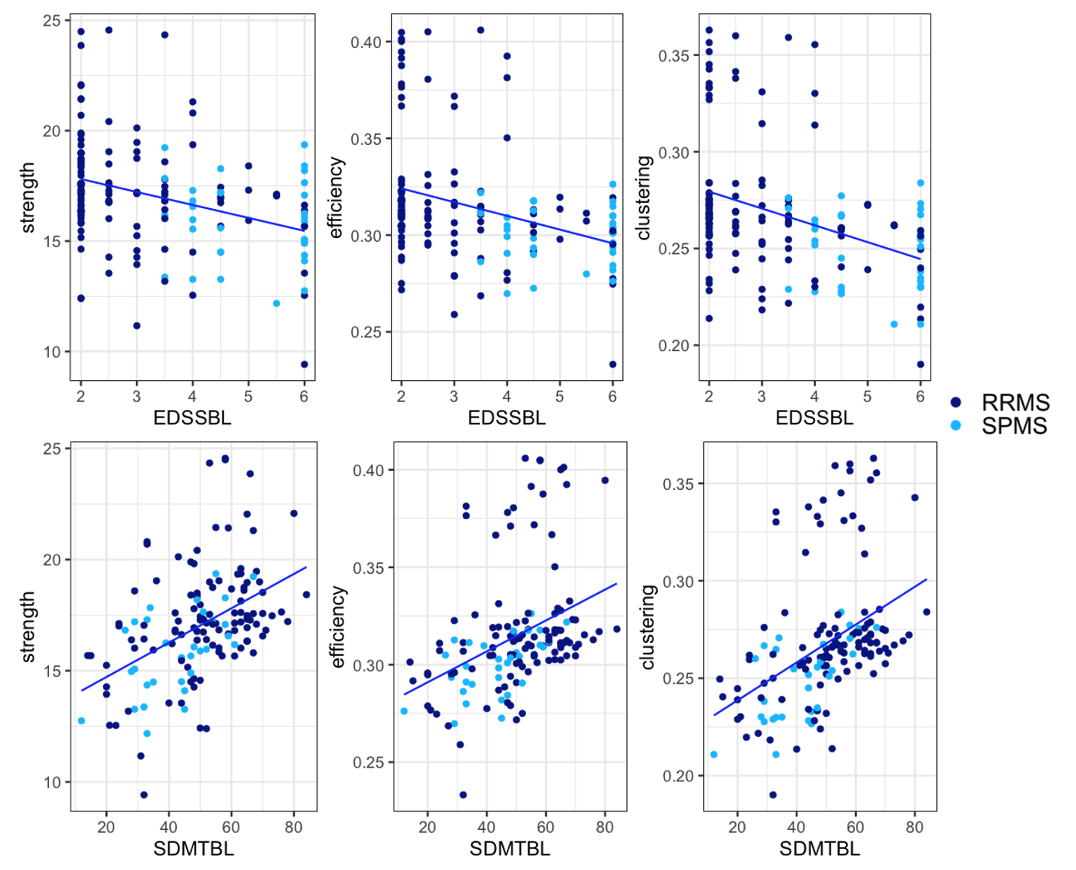
Our results (Figure 3) show that MS pathology has a greater overall impact on the MTR of SP patients than RR patients. SP patients have significantly lower values of mean strength (p = 0.029, R2 = 0.10), efficiency (p = 0.021, R2 = 0.53), and clustering coefficient (p = 0.020, R2 = 0.14) compared to RR patients. In addition, changes in mean strength (p = 0.03, R2 = 0.37) and clustering coefficient (p = 0.01, R2 = 0.38) of weighted networks in MTR of MS patients are found to be negatively correlated with EDSS. Furthermore, the mean strength (p < 0.001, R2 = 0.42), the efficiency (p = 0.019, R2 = 0.36), and the clustering coefficient (p = 0.003, R2 = 0.38) of the MTR-weighted networks of MS patients are positively correlated with SDMT.Discussion
Lesion-sensitive MySD shows that progressive MS patients have less integrated networks and weaker MTR values compared to RRMS. Moreover, the changes that occur globally in the MTR-weighted networks of MS patients significantly relate to their disability and cognitive impairment.Conclusion
We have shown that lesion-sensitive MySD can be applied to study myelin-based network alterations in progressive vs RR MS patients. Our data also provide first evidence that this method can be applied to standard clinical trial data, hereby providing measures that are significantly associated to patients’ disability and cognition.Acknowledgements
This work was funded by Biogen.References
1. Pestilli, F. et al. LiFE: Linear Fascicle Evaluation a new technology to study visual connectomes. J Vis 14, 1122 (2014).
2. Daducci, A., Dal Palù, A., Lemkaddem, A. & Thiran, J.-P. P. COMMIT: convex optimization modeling for microstructure informed tractography. IEEE Trans Med Imaging 34, 246–257 (2014).
3. Smith, R. E., Tournier, J. D., Calamante, F. & Connelly, A. SIFT: Spherical-deconvolution informed filtering of tractograms. Neuroimage 67, 298–312 (2013).
4. Schiavi, S. et al. A new method for accurate in vivo mapping of human brain connections using microstructural and anatomical information. Sci Adv (2020) doi:10.1126/sciadv.aba8245.
5. Smith, R. E., Tournier, J.-D., Calamante, F. & Connelly, A. SIFT2: Enabling dense quantitative assessment of brain white matter connectivity using streamlines tractography. Neuroimage 119, 338–351 (2015).
6. Ocampo-Pineda, M. et al. Hierarchical microstructure informed tractography. Brain Connect 11, 75–88 (2021).
7. Schiavi, S. et al. Bundle myelin fraction (BMF) mapping of different white matter connections using microstructure informed tractography. Neuroimage 249, 118922 (2022).
8. Cadavid, D. et al. Safety and efficacy of opicinumab in patients with relapsing multiple sclerosis (SYNERGY): a randomised, placebo-controlled, phase 2 trial. Lancet Neurol18, 845–856 (2019).
9. Leppert, I. R. et al. Dual-encoded magnetization transfer and diffusion imaging and its application to tract-specific microstructure mapping. Imaging Neuroscience (2023) doi:10.1162/imag_a_00019.
Figures