2966
Longitudinal Quantitative synthetic MRI assessment of hippocampus in early-stage multiple sclerosis: correlation with cognitive scores1Xuanwu hospital, Beijing, China
Synopsis
Keywords: Multiple Sclerosis, Multiple Sclerosis
Motivation: The longitudinal changes of the quantitative MRI parameters in the hippocampus of MS patients and their correlation with clinical factors remains unclear.
Goal(s): This study aimed to characterize the longitudinal changes of quantitative parameters in the hippocampus and explore the relevance of these changes to cognitive assessment.
Approach: Quantitative values calculated using Synthetic MRI technique and extracted for different subregions of the hippocampus.
Results: Compared with healthy controls, significant differences of quantitative values in the hippocampus, particularly in the subiculum, were observed. At 1-year follow-up, clinical improvement was associated with lower T2 values in the entire hippocampus.
Impact: Synthetic MRI can effectively evaluate changes in the normal-appearing hippocampus of MS patients and may be useful for monitoring disease progression clinically.
Introduction
Multiple sclerosis (MS) is a chronic neurological disorder which can cause inflammation and damage to the central nervous system, resulting in impaired cognitive, physical, and psychological functions. Previous studies have shown that the hippocampus plays a key role in understanding the physiological mechanism and neuropsychological impairment of MS. Although Synthetic MRI has been applied to MS patients in previous studies, which found higher T1, T2, and PD values in lesions compared to normal brain tissue, longitudinal changes of the quantitative parameters in the hippocampus of MS patients and their correlation with clinical factors remains unclear. The goals of this study were to (1) characterize the longitudinal quantitative changes in the hippocampus of MS patients and (2) explore the relevance of these changes to cognitive assessment.Materials and methods
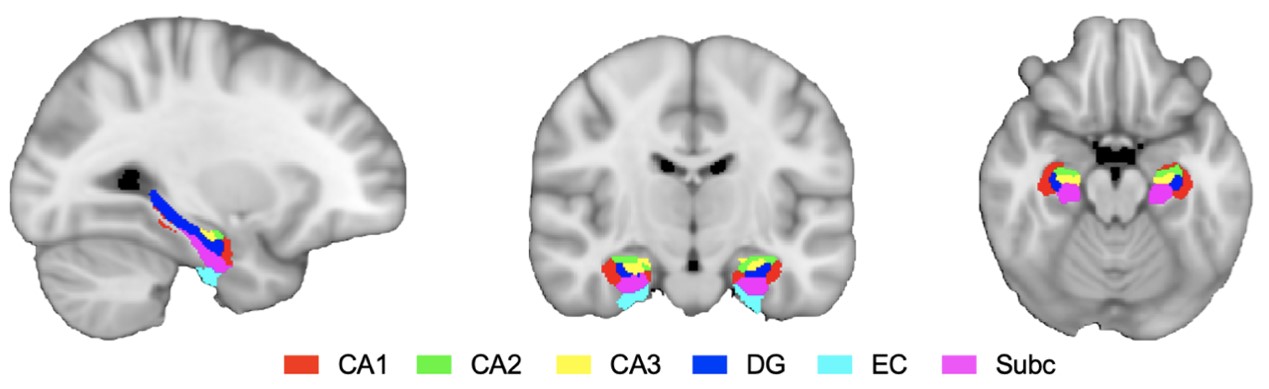
Thirty patients with relapsing-remitting MS (19 females and 11 males), diagnosed based on the 2017 McDonald criteria, were recruited. These patients were relapse-free for at least 3 months and conventional MRI showed no lesions in their hippocampus. Among them, 19 completed 1-year follow-up including clinical assessments and imaging. They had no clinical relapse during follow-up, did not use corticosteroid, and did not change DMT (in case patients were on DMT at baseline). Additionally, 26 sex- and age-matched healthy controls (21 females and 5 males) with no history of neurologic impairment were included. MAGnetic resonance imaging Compilation (MAGiC) (35 axial sections; TR/TE = 2000/30 ms; flip angle = 90°; slice thickness = 3 mm; gap = 1 mm; in-plane resolution, 3.5 mm × 3.5 mm and matrix size = 64 × 64) and 3D T1 weighted images (TR/TE = 1600/2.13 ms, TI= 1000 ms, flip angle = 8°, 1.0 mm isotropic voxel) were acquired from a 3.0 T MR system (SIGNA Premier, GE Healthcare) with a 48-channel head coil. The 3D T1 weighted images were co-registered to the MAGiC T1 mapping and then segmented using the Computational Anatomy Toolbox (CAT12). Quantitative maps were spatial normalized and average quantitative values within each hippocampus subregions were extracted based on an atlas. Entorhinal cortex (EC), subiculum (Subc), CA1, CA2, CA3, dentate gyrus (DG) & CA4 along the full-length of the hippocampus was included in this study (Figure 1). The hippocampus and subregions volume were computed as grand total of left and right thalami acquired from the segmentation and normalized to the estimated total intracranial volume to eliminate the difference in individual brain size. Two-sample t-tests were used for cross sectional investigation while paired t-tests were used for longitudinal investigation. Pearson's correlation analysis was employed to investigate the relationship between cognitive scores and quantitative parameters.Results
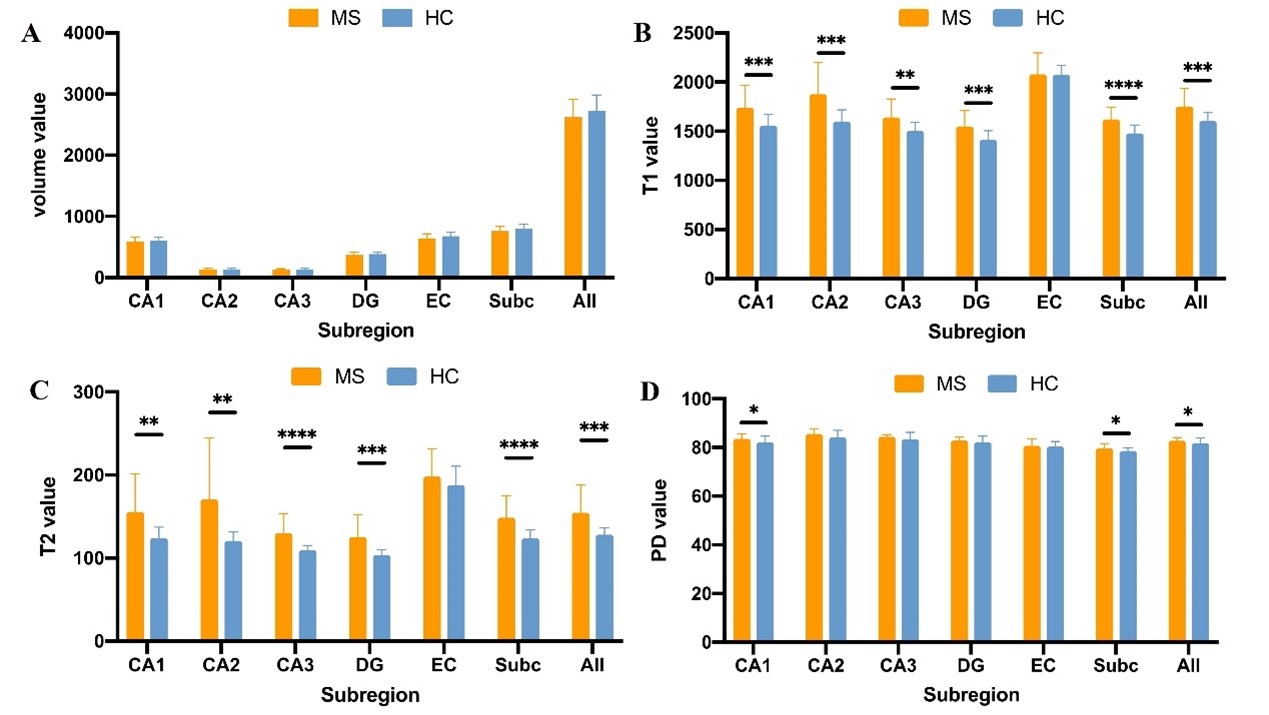
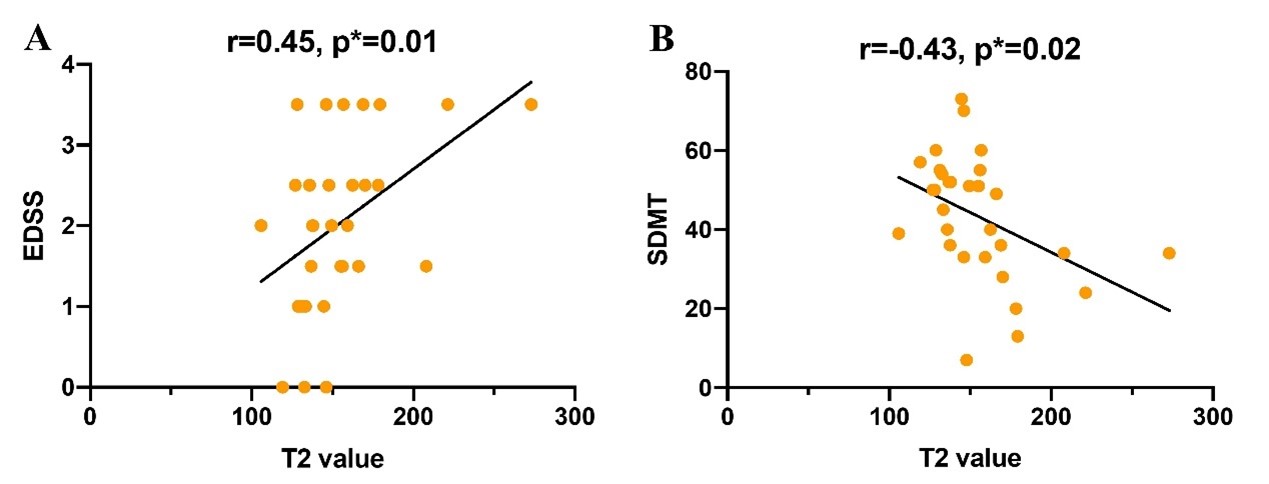
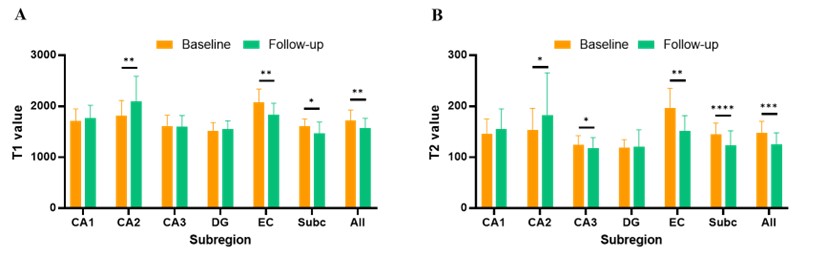
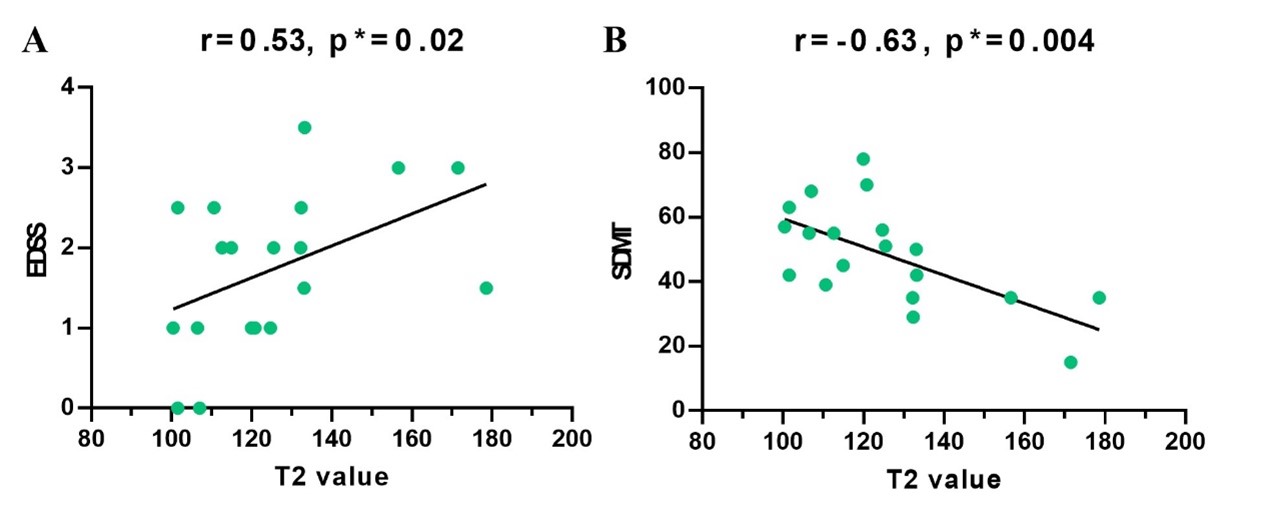
There were no significant differences in the volume of hippocampus and its subregions between MS patients and healthy controls. However, significant differences in quantitative parameters within these regions were observed (Figure 2). The Expanded Disability Status Scale (EDSS) score showed a significant positive correlation with T2 value (P = 0.01, r = 0.45, Fig.3A), while Symbol Digit Modalities Test (SDMT) score was significantly negatively correlated with T2 value (P = 0.02, r = - 0.43, Fig.3B). Compared to baseline measurements, significant change in T1 and T2 values can be observed over time (Figure 4). The T2 value was significantly positively correlated with EDSS score (P = 0.02, r = 0.53, Fig.5A) and negatively correlated with the SDMT score (P = 0.004, r = - 0.53, Fig.5B) at follow-up.Discussion
In this study, even though the cohort showed no difference in the volume of the hippocampus and its subregions compared with healthy controls, pathological changes in the hippocampus, particularly in the subiculum, were obviously observed using Synthetic MRI techniques. Hippocampal damage is associated with cognitive impairment and depressive symptoms, which can be involved early in the disease. At 1-year follow-up, clinical improvement (lower EDSS and higher SDMT scores) was associated with lower T2 values in the entire hippocampus, suggesting that T2 values may objectively reflect the degree of clinical disability (both physical and cognitive) and could be used as an imaging marker for dynamic assessment of hippocampal injury.Conclusion
Synthetic MRI can evaluate the changes of the normal-appearing hippocampus and its subregions in patient with MS, which may be used as an imaging indicator for evaluating and monitoring the condition in clinical practice.Acknowledgements
The authors thank Boyan Xu and Juan Wei from GE Healthcare for supporting this study. The authors also thank the participants for their commitment.References
1. Compston A, Coles A. Multiple sclerosis. Lancet. 2008; 372: 1502-17.
2. Rocca MA, Barkhof F, De Luca J, et al. The hippocampus in multiple sclerosis. The Lancet Neurology. 2018, 17(10):918-926.
3. Tanenbaum LN, Tsiouris AJ, Johnson AN, et al. Synthetic MRI for clinical neuroimaging: results of the magnetic resonance image compilation (MAGiC) prospective, multicenter, multireader trial. American Journal of Neuroradiology. 2017, 38(6):1103-1110.
4. Jiang Y, Yu L, Luo X, et al. Quantitative synthetic MRI for evaluation of the lumbar intervertebral disk degeneration in patients with chronic low back pain. European Journal of Radiology. 2020, 124:108858.
5. Thompson AJ, Banwell BL, Barkhof F, et al. Diagnosis of multiple sclerosis: 2017 revisions of the McDonald criteria. Lancet Neurology. 2018, 17(2):162-173.
6. Wisse L, Gerritsen L, Zwanenburg J, et al. Subfields of the hippocampal formation at 7T MRI: in vivo volumetric assessment. Neuroimage. 2012, 61(4):1043-1049.
7. Granberg T, Uppman M, Hashim F, et al. Clinical Feasibility of Synthetic MRI in Multiple Sclerosis: A Diagnostic and Volumetric Validation Study. American Journal of Neuroradiology, 2016, 37(6):1023-1029. 8. Wijnen AV, Petrov F, Maiworm M, et al. Cortical quantitative MRI parameters are related to the cognitive status in patients with relapsing-remitting multiple sclerosis. European radiology. 2020, 30(2):1045-1053.
9. Al-Radaideh A, Athamneh I, Alabadi H A, et al. Deep gray matter changes in relapsing-remitting multiple sclerosis detected by multi-parametric, high-resolution magnetic resonance imaging (MRI). European Radiology. 2020, 31(2):706-715.
10. Zheng F, Li Y, Zhuo Z, et al. Structural and functional hippocampal alterations in Multiple sclerosis and neuromyelitis optica spectrum disorder. Multiple sclerosis (Houndmills, Basingstoke, England). 2022, 28(5) :707-717.
11. Benedict RHB, Tomic D, Cree BA, et al. Siponimod and Cognition in Secondary Progressive Multiple Sclerosis: EXPAND Secondary Analyses. Neurology. 2021, 96(3): e376-e386.
12. Manca R, Sharrack B, Paling D, et al. Brain connectivity and cognitive processing speed in multiple sclerosis: A systematic review. J Neurol Sci. 2018; 388: 115-127.
Figures