2965
Myelin imaging with myelin-sensitive inversion recovery (MySIR) in multiple sclerosis1Department of Radiology, Chiba University Hospital, Chiba, Japan, 2Diagnostic Radiology and Radiation Oncology, Graduate School of Medicine, Chiba University, Chiba, Japan, 3Philips Japan, Tokyo, Japan, 4Phillips Canada, Mississauga, ON, Canada
Synopsis
Keywords: Multiple Sclerosis, Brain, Myelin imaging
Motivation: Myelin imaging that can assess demyelination needs to be established for testing new drugs and determining treatment strategies in multiple sclerosis (MS).
Goal(s): To investigate the correlation between myelin-sensitive inversion recovery imaging (MySIR) and inhomogeneous magnetization transfer (ihMT) to determine whether MySIR is feasible as myelin imaging in MS.
Approach: We evaluated the correlation between MySIR and ihMT in MS plaque and normal-appearing white matter (NAWM).
Results: MySIR correlated with ihMT in plaques of MS, and the discrimination ability between plaque and normal-appearing white matter of MySIR was equivalent to that of ihMT.
Impact: MySIR is feasible as myelin imaging for MS plaque. MySIR can achieve high resolution and has the potential to measure myelin content accurately.
INTRODUCTION
Multiple sclerosis has demyelinating plaques, and myelin levels are known to correlate strongly with clinical severity. In addition, therapies are currently under development for multiple sclerosis aimed at protecting or restoring myelin and preventing axonal denervation. Therefore, quantitative imaging of myelin is needed to assess demyelination and remyelination1. Prior reports of myelin imaging include short-TR adiabatic inversion recovery (STAIR), phase-sensitive inversion recovery (PSIR), and inhomogeneous magnetization transfer (ihMT). The STAIR is an inversion recovery (IR) method using a short TR, and it is possible to image only myelin with a short T2 value by setting the null point for the magnetization of intracellular/extracellular water with a long T2 value2. After inversion time from the IR pulse, PSIR acquires a T1 contrast intensity image using a fast gradient echo method and a reference image at a low flip angle just before the next IR pulse. By reconstructing the real image using the two images, an image that corrects for signal polarity inversion due to IR can be obtained3.Myelin-sensitive inversion recovery imaging (MySIR) is an imaging technique that combines STAIR and PSIR. It is possible to image myelin. The ihMT selectively images tissue with a long dipole relaxation time (T1D) component, such as myelin, by reflecting changes in magnetization4. In animal studies, ihMT has shown a strong correlation with myelin content5. This study aims to examine the correlation between MySIR and ihMT to determine whether MySIR is feasible as myelin imaging.METHODS
Fourteen patients with clinically diagnosed multiple sclerosis (MS) were included in this study. They underwent a 3-tesla MRI (Ingenia, Philips Healthcare) including 3D-FLAIR, ihMT, and MySIR. The imaging parameters are shown in Figure 1. ihMT and MySIR were acquired in the same axial plane, and 3D-FLAIR was reconstructed to the same plane. the ihMT ratio (ihMTR) map was calculated using ihTM images. Circle ROI was placed in areas of high signal in 3D-FLAIR that were likely to be MS plaque. ROI of the same size was placed in the immediately adjacent normal-appearing white matter (NAWM). Then, ROIs were copied onto ihMTR and MySIR images, and the mean values within the ROIs were measured. Since MySIR outputs a T1-weighted image, the values of T1-weighted image were also collected. Then, MySIR ratio (MySIRR) was calculated from the MySIR and T1-weighted image values to acquire quantitative values using the following formula.MySIRR = SignalMySIR / SignalT1WI
ihMTR and MySIRR were collected in 62 lesions of 14 patients. We evaluated the correlation between ihMTR and MySIRR in the plaque and adjacent NAWM. We also compared plaque and NAWM and evaluated the discriminative ability between plaque and NAWM by ROC analysis.
RESULTS
There were significant differences between MS plaque and NAWM in each of ihMTR and MySIRR (p < 0.001 and < 0.001). MySIRR significantly correlated with ihMTR in MS plaque (r = 0.427, p = 0.001), but not in NAWM (r = 0.244, p = 0.056). Furthermore, both inMTR and MySIRR have high area under the curve (AUC) for discriminating MS plaque and NAWM (AUC = 0.960 and 0.958).DISCUSSION
MySIRR showed a statistically significant difference between MS plaque and NAWM, suggesting that MySIR can reflect differences in myelin content. We also found a significant positive correlation between MySIRR and ihMTR in MS plaque, suggesting that MySIR may reflect a decrease in myelin content as well as ihMT. We found prior reports that ihMT is highly correlated with myelin content in animal experiments using genetically modified mice5. On the other hand, ihMT requires a long acquisition time, complex processing6, and multiple parametric images for creating an ihMTR map7. MySIR used in this study can achieve shorter imaging times when acquiring the same resolution as ihMT (Figure 1). MySIR is also capable of high-resolution imaging and can delineate white matter tracts (Figure 5). On the other hand, we found no significant correlation between ihMTR and MySIRR in NAWM. One possible cause is that myelin content in the cerebral white matter is known to vary from region to region, and the selected regions for the ROIs may have caused variability. To evaluate NAWM more, further studies using normal volunteers are needed.CONCLUSION
MySIR is feasible as myelin imaging in multiple sclerosis plaques.Acknowledgements
No acknowledgement found.References
1. Oh J, Ontaneda D, Azevedo C, et al. Imaging outcome measures of neuroprotection and repair in MS: A consensus statement from NAIMS. Neurology. 2019 Mar 12;92(11):519-533.
2. Ma YJ, Jang H, Wei Z, et al. Myelin Imaging in Human Brain Using a Short Repetition Time Adiabatic Inversion Recovery Prepared Ultrashort Echo Time (STAIR-UTE) MRI Sequence in Multiple Sclerosis. Radiology. 2020 Nov;297(2):392-404.
3. Sethi V, Yousry TA, Muhlert N, et al. Improved detection of cortical MS lesions with phase-sensitive inversion recovery MRI. J Neurol Neurosurg Psychiatry. 2012 Sep;83(9):877-82.
4. Varma G, Duhamel G, de Bazelaire C, Alsop DC. Magnetization transfer from inhomogeneously broadened lines: A potential marker for myelin. Magn Reson Med. 2015 Feb;73(2):614-22.
5. Duhamel G, Prevost VH, Cayre M, et al. Validating the sensitivity of inhomogeneous magnetization transfer (ihMT) MRI to myelin with fluorescence microscopy. Neuroimage. 2019 Oct 1;199:289-303.
6. Portnoy S, Stanisz GJ. Modeling pulsed magnetization transfer. Magn Reson Med. 2007 Jul;58(1):144-155.
7. Yarnykh VL. Fast macromolecular proton fraction mapping from a single off-resonance magnetization transfer measurement. Magn Reson Med. 2012 Jul;68(1):166-78.
Figures
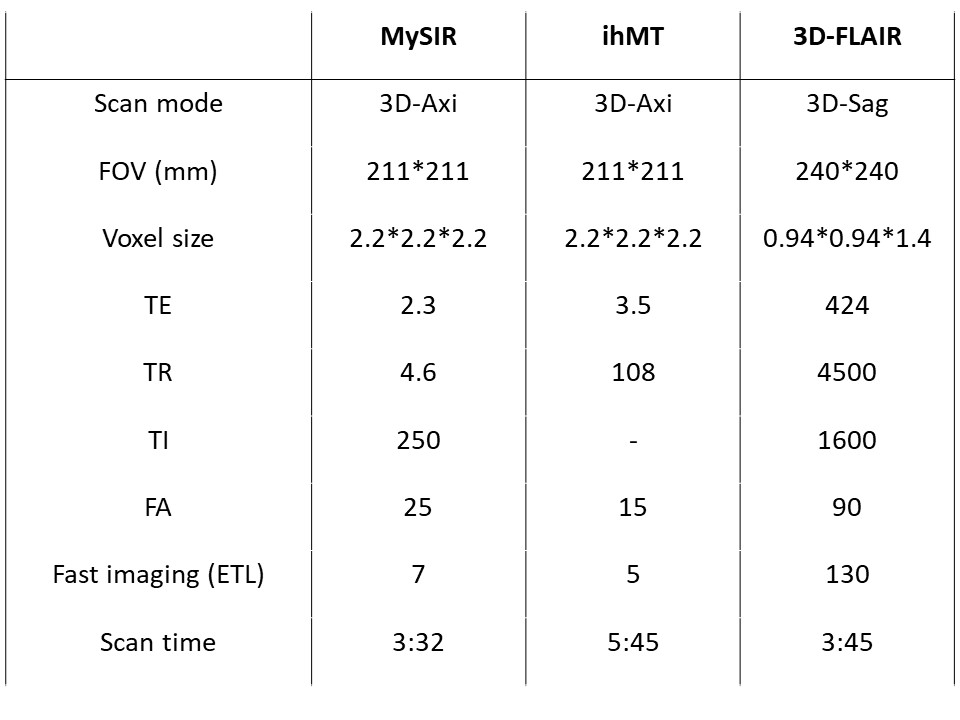
Figure: 1
Scan parameters of MySIR*, ihMT** and 3D-FLAIR
*MySIR: myelin-sensitive inversion recovery imaging
**ihMT: inhomogeneous magnetization transfer
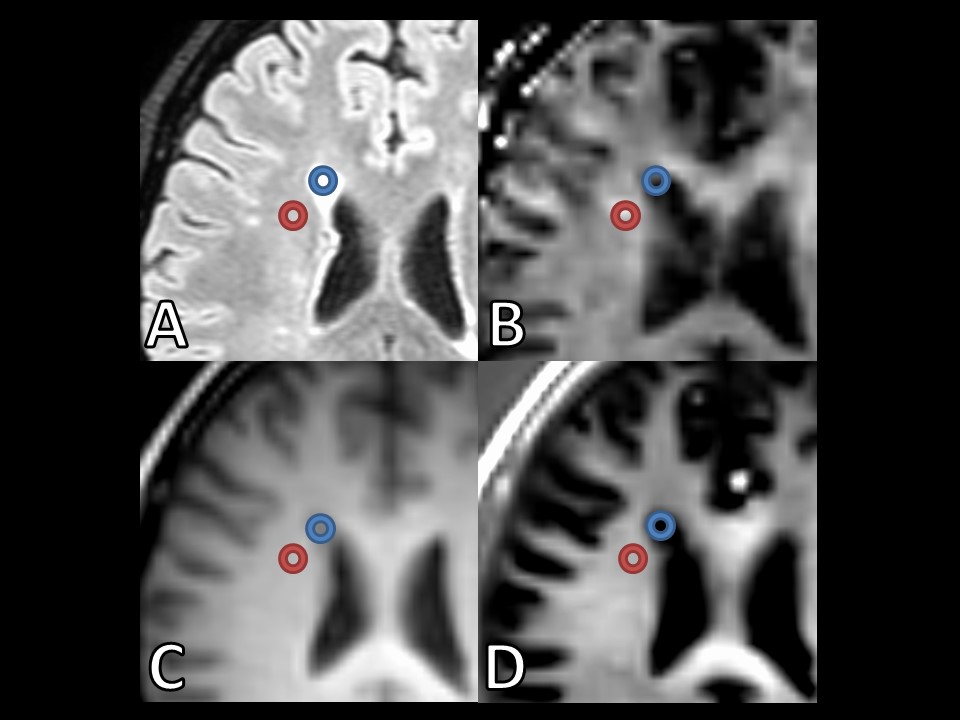
Figure: 2
A 47-year-old woman with multiple sclerosis (MS)
A, 3D-FLAIR; B, ihMTR*; C, T1WI simultaneously acquired from MySIR**; D, MySIR
The blue ROI corresponds to MS plaque with an abnormally high signal in 3D-FLAIR. The red ROI corresponds to NAWM. We have copied both ROIs in 3D-FLAIR to the corresponding areas in ihMTR and MySIR. In ihMTR and MySIR, MS plaques look like cerebrospinal fluid, but these signals reflects severe demyelination actually.
*ihMTR: inhomogeneous magnetization transfer ration
**MySIR: myelin-sensitive inversion recovery imaging
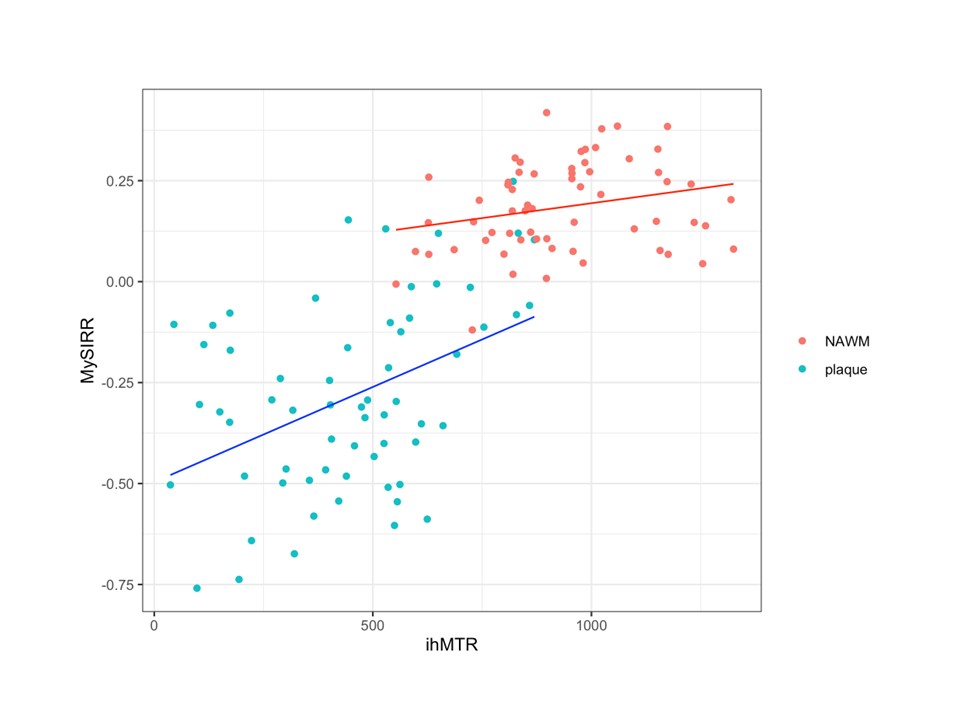
Figure: 3
Scatterplots of ihMT* ration (ihMTR) and MySIR** ration (MySIRR), with plaque values indicated by blue dots and normal-appearing white matter (NAWM) values in red. Straight lines indicate the respective approximate straight line calculated by linear regression. Plaque values are significantly correlated for ihMTR and MySIRR (r = 0.473, p < 0.001), but not for NAWM (r = 0.244, p = 0.056).
*ihMT: inhomogeneous magnetization transfer
**MySIR: myelin-sensitive inversion recovery imaging
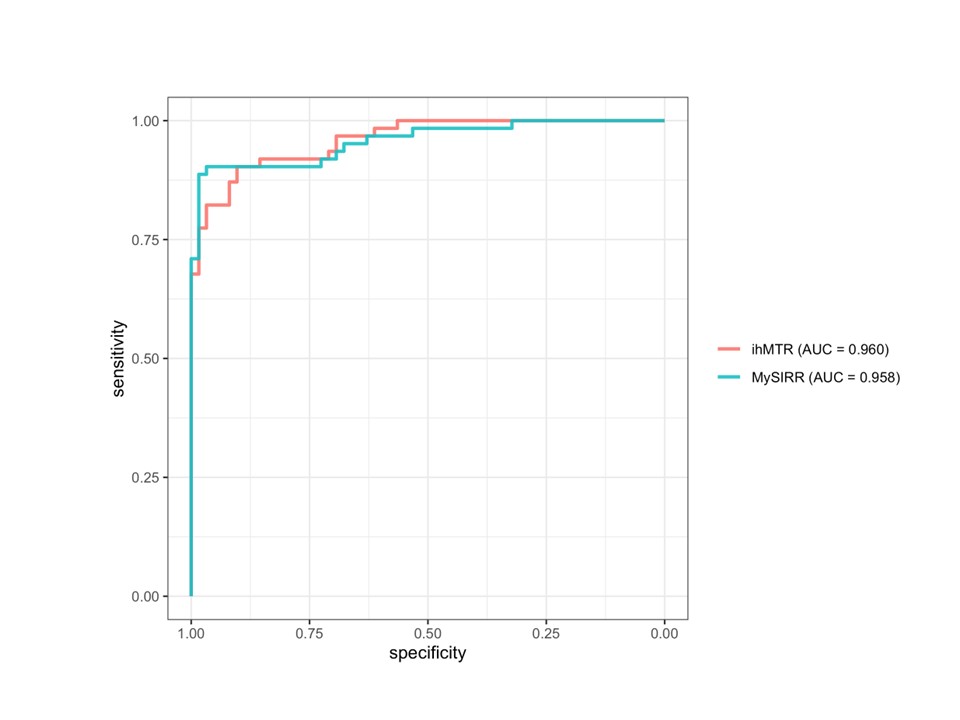
Figure: 4
The discriminatory ability of ihMT* ratio (ihMTR) and MySIR** ratio (MySIRR) between plaque and surrounding normal-appearing white matter in patients with multiple sclerosis. Both ihMTR and MySIRR show high area under the curves (AUC = 0.960 and 0.958).
*ihMT: inhomogeneous magnetization transfer
**MySIR: myelin-sensitive inversion recovery imaging
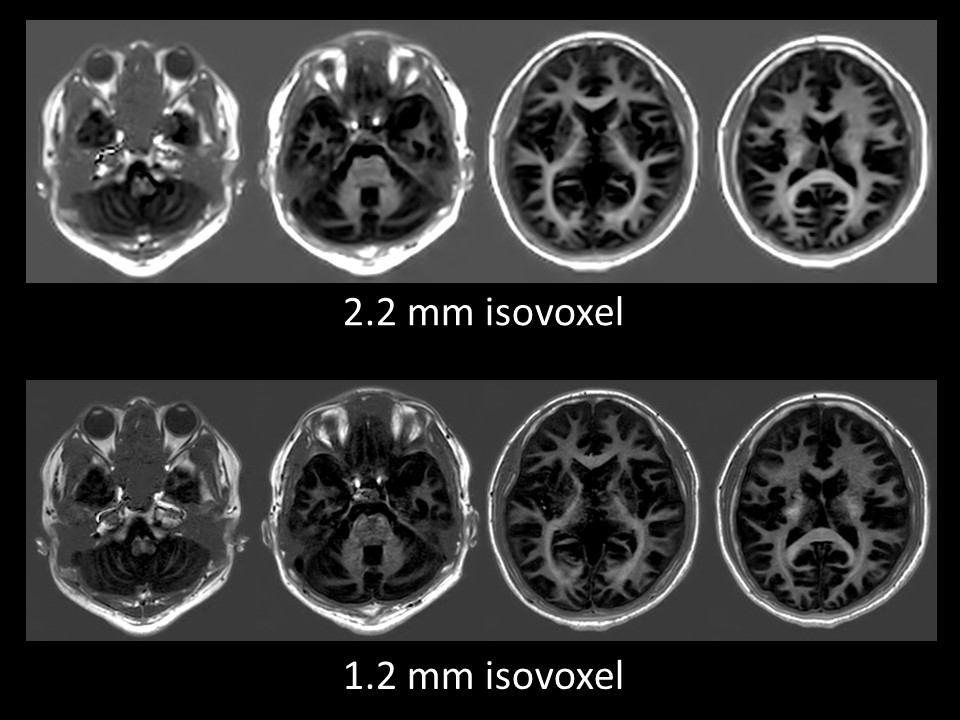
Figure: 5
(Upper row) MySIR* of 2.2 mm isovoxel (Lower row) MySIR of 1.2 mm isovoxel
The medulla oblongata pyramidal to pyramidal commissure, pontine transverse fibers, internal capsule, optic radiations, and corpus callosum show higher signals. These structures are more clearly delineated in the 1.2 mm isovoxel images.
*MySIR: myelin-sensitive inversion recovery imaging