2964
Cross-sectional multiparametric subtyping of multiple sclerosis lesions informs on their longitudinal evolution1Advanced Clinical Imaging Technology, Siemens Healthineers International AG, Lausanne, Geneva and Zurich, Switzerland, 2Department of Radiology, Lausanne University Hospital and University of Lausanne, Lausanne, Switzerland, 3LTS5, Ecole Polytechnique Fédérale de Lausanne, Lausanne, Switzerland, 4Department of Neurology and Center of Clinical Neuroscience, First Faculty of Medicine, Charles University and General University of Prague, Prague, Czech Republic, 5CIBM Centre for Biomedical Imaging, Geneva, Switzerland, 6Swiss Centre for Musculoskeletal Imaging (SCMI), Balgrist Campus, Zurich, Switzerland, 7Department of Radiology, First Faculty of Medicine, Charles University and General University of Prague, Prague, Czech Republic
Synopsis
Keywords: Multiple Sclerosis, Relaxometry, White Matter; quantitative imaging
Motivation: In multiple sclerosis, slowly expanding lesions have been suggested as a hallmark of a steadily worsening disease course. However, identifying these lesions is challenging, as their growth rates are at the detection limit of today's processing algorithms or MRI data must be available over a long period of time.
Goal(s): To identify and characterise slowly expanding lesions in cross-sectional data.
Approach: We compared changes in quantitative T1, T2 and T2/T1-ratio inside lesions and in perilesional tissue for enlarging/stable/shrinking/new lesion phenotypes.
Results: Z-scores of multiparametric quantitative maps carry discriminative information to classify lesion evolution from single time point data.
Impact: Our findings suggest that quantitative multiparametric analyses allow a better in vivo characterisation of microstructural tissue pathology in multiple sclerosis; this furthers the understanding of different lesion evolutions and might enable to already distinguish them from cross-sectional data.
Introduction
In multiple sclerosis (MS), chronic active lesions (CALs) are a hallmark of disease progression1–3. CALs are characterised by two radiological features: their enlargement over time (slowly expanding lesions, SELs4,5) and the presence of macrophages at their border (paramagnetic rim lesions, PRLs). While PRLs can be identified using T2*-weighted imaging cross-sectionally, the detection of SELs requires long-term longitudinal data, thereby limiting their clinical applicability. However, PRLs cannot be used as a cross-sectional surrogate of SELs, as recent literature showed that only a limited overlap between the two groups6,7.We therefore explored in this work whether multiparametric MRI can be used to derive growth characteristics of lesions based on single-time-point data.
Methods
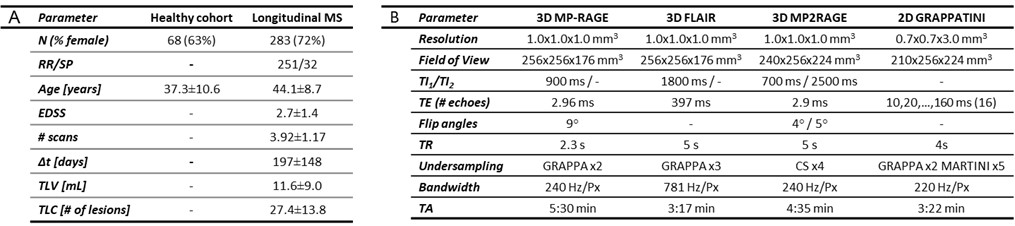
Study population, MR protocol and pre-processingA cohort of 68 healthy subjects and 283 MS patients were scanned at 3T (MAGNETOM Skyra, Siemens Healthcare, Erlangen, Germany) using MP-RAGE and FLAIR sequences as well as MP2RAGE8,9 and GRAPPATINI10 research application sequences for T1 and T2 mapping, respectively (demographics and protocol parameters in Table 1). MS patients received follow-up scans every six months for up to four years.
To quantify the coupling of T1 and T2 changes in the brain, T2/T1 ratio maps were computed by dividing the respective T2 maps by the corresponding T1 maps for every subject11. Subsequently, reference T1, T2 and T2/T1 atlases were generated from the scans of the healthy cohort following Piredda et al.12. For each patient and quantitative map, z-score maps were calculated showing the voxel-wise deviations from age- and sex-matched reference values12.
Longitudinal lesion phenotypes
MS lesions were segmented with a fully automated white matter hyperintensities13,14 AI-Rad Companion Brain MR software. To also probe the tissue surrounding a lesion, two perilesional rings of normal-appearing white matter tissue were defined by including voxels at a distance below 2 mm and 3.5 mm away from the lesion border, respectively. The Reproducibility-Informed Method for Longitudinal Assessment (RIMLA)15 – a bootstrapping-based technique that allows to estimate longitudinal volumetric changes while accounting for the robustness of the underlying lesion segmentation algorithm – was used to identify significant longitudinal changes in lesion volumes. Lesions were thus labelled either as “enlarging”, “shrinking”, “stable” or “new” (the latter if they were solely detected in the last time point).
Statistical Analysis
The average and standard deviation (SD) of z-scores was compared between lesion classes using a non-parametric aligned-rank transform ANOVA method, with fixed effects for patients and disease courses. The contribution of each microstructural metric to a classification task predicting the lesion type was studied using a random forest model using 3000 lesions for training and 264 for testing. The average variable importance was estimated across 50 permutations.
Results
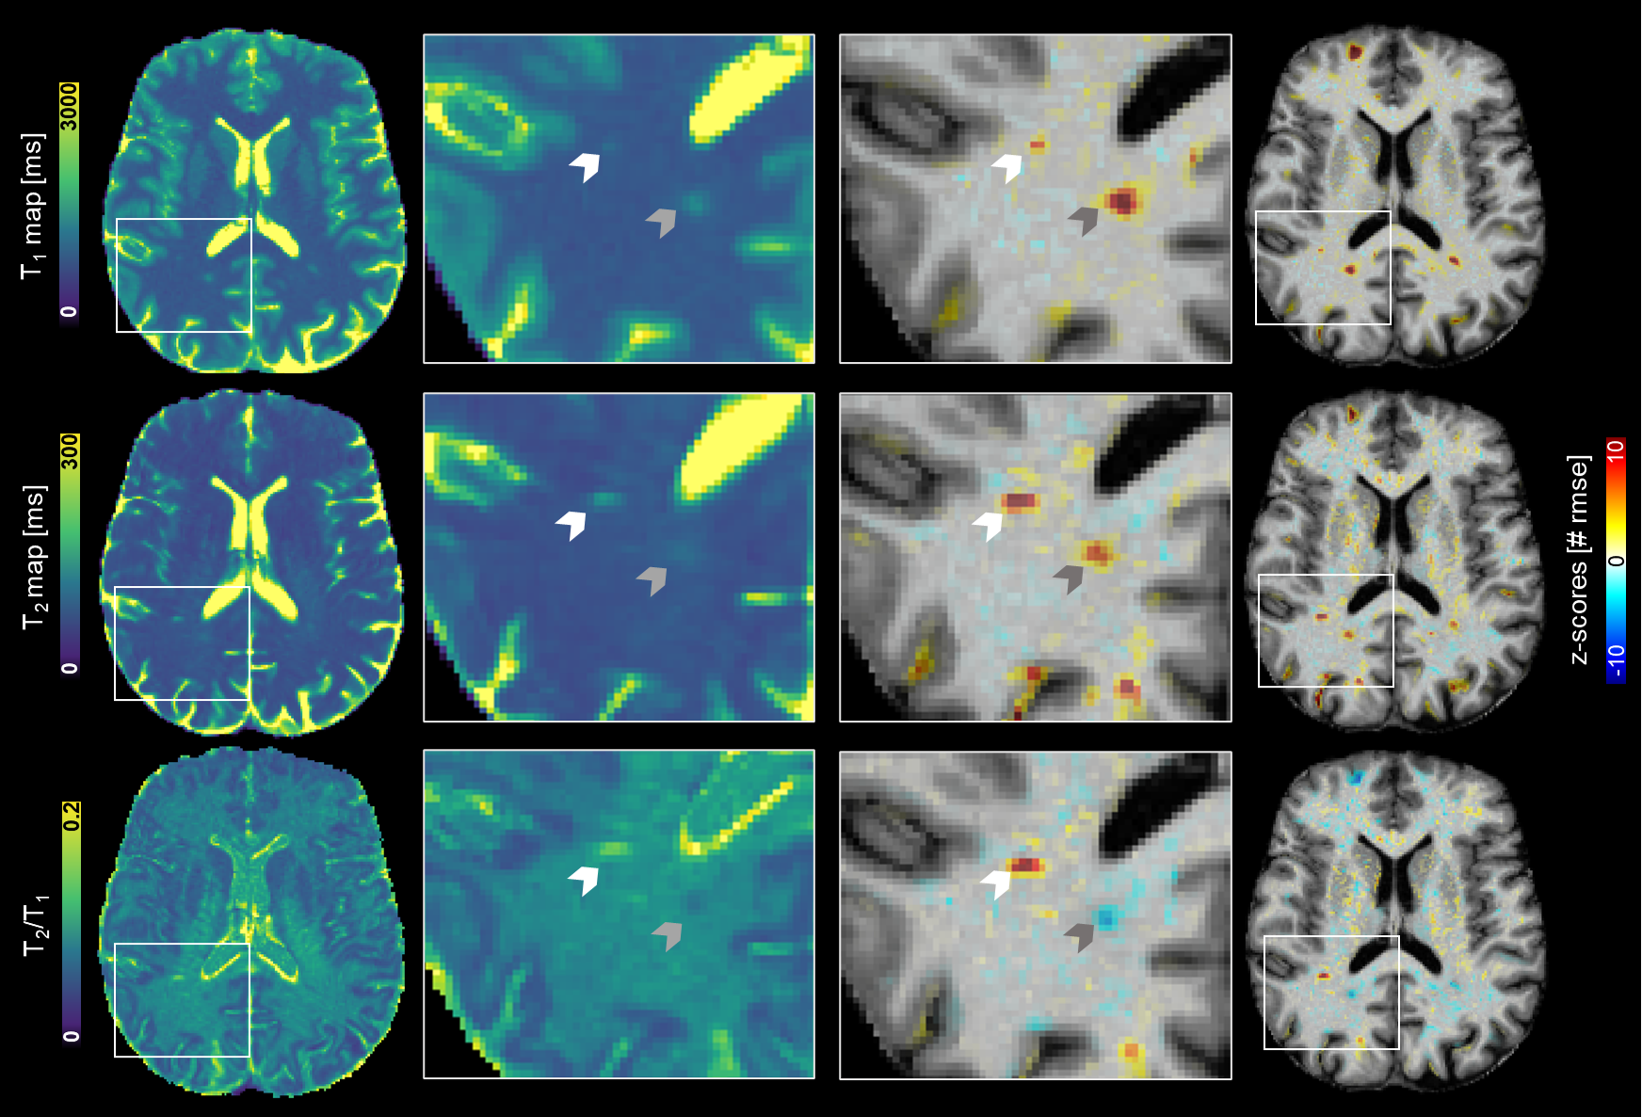
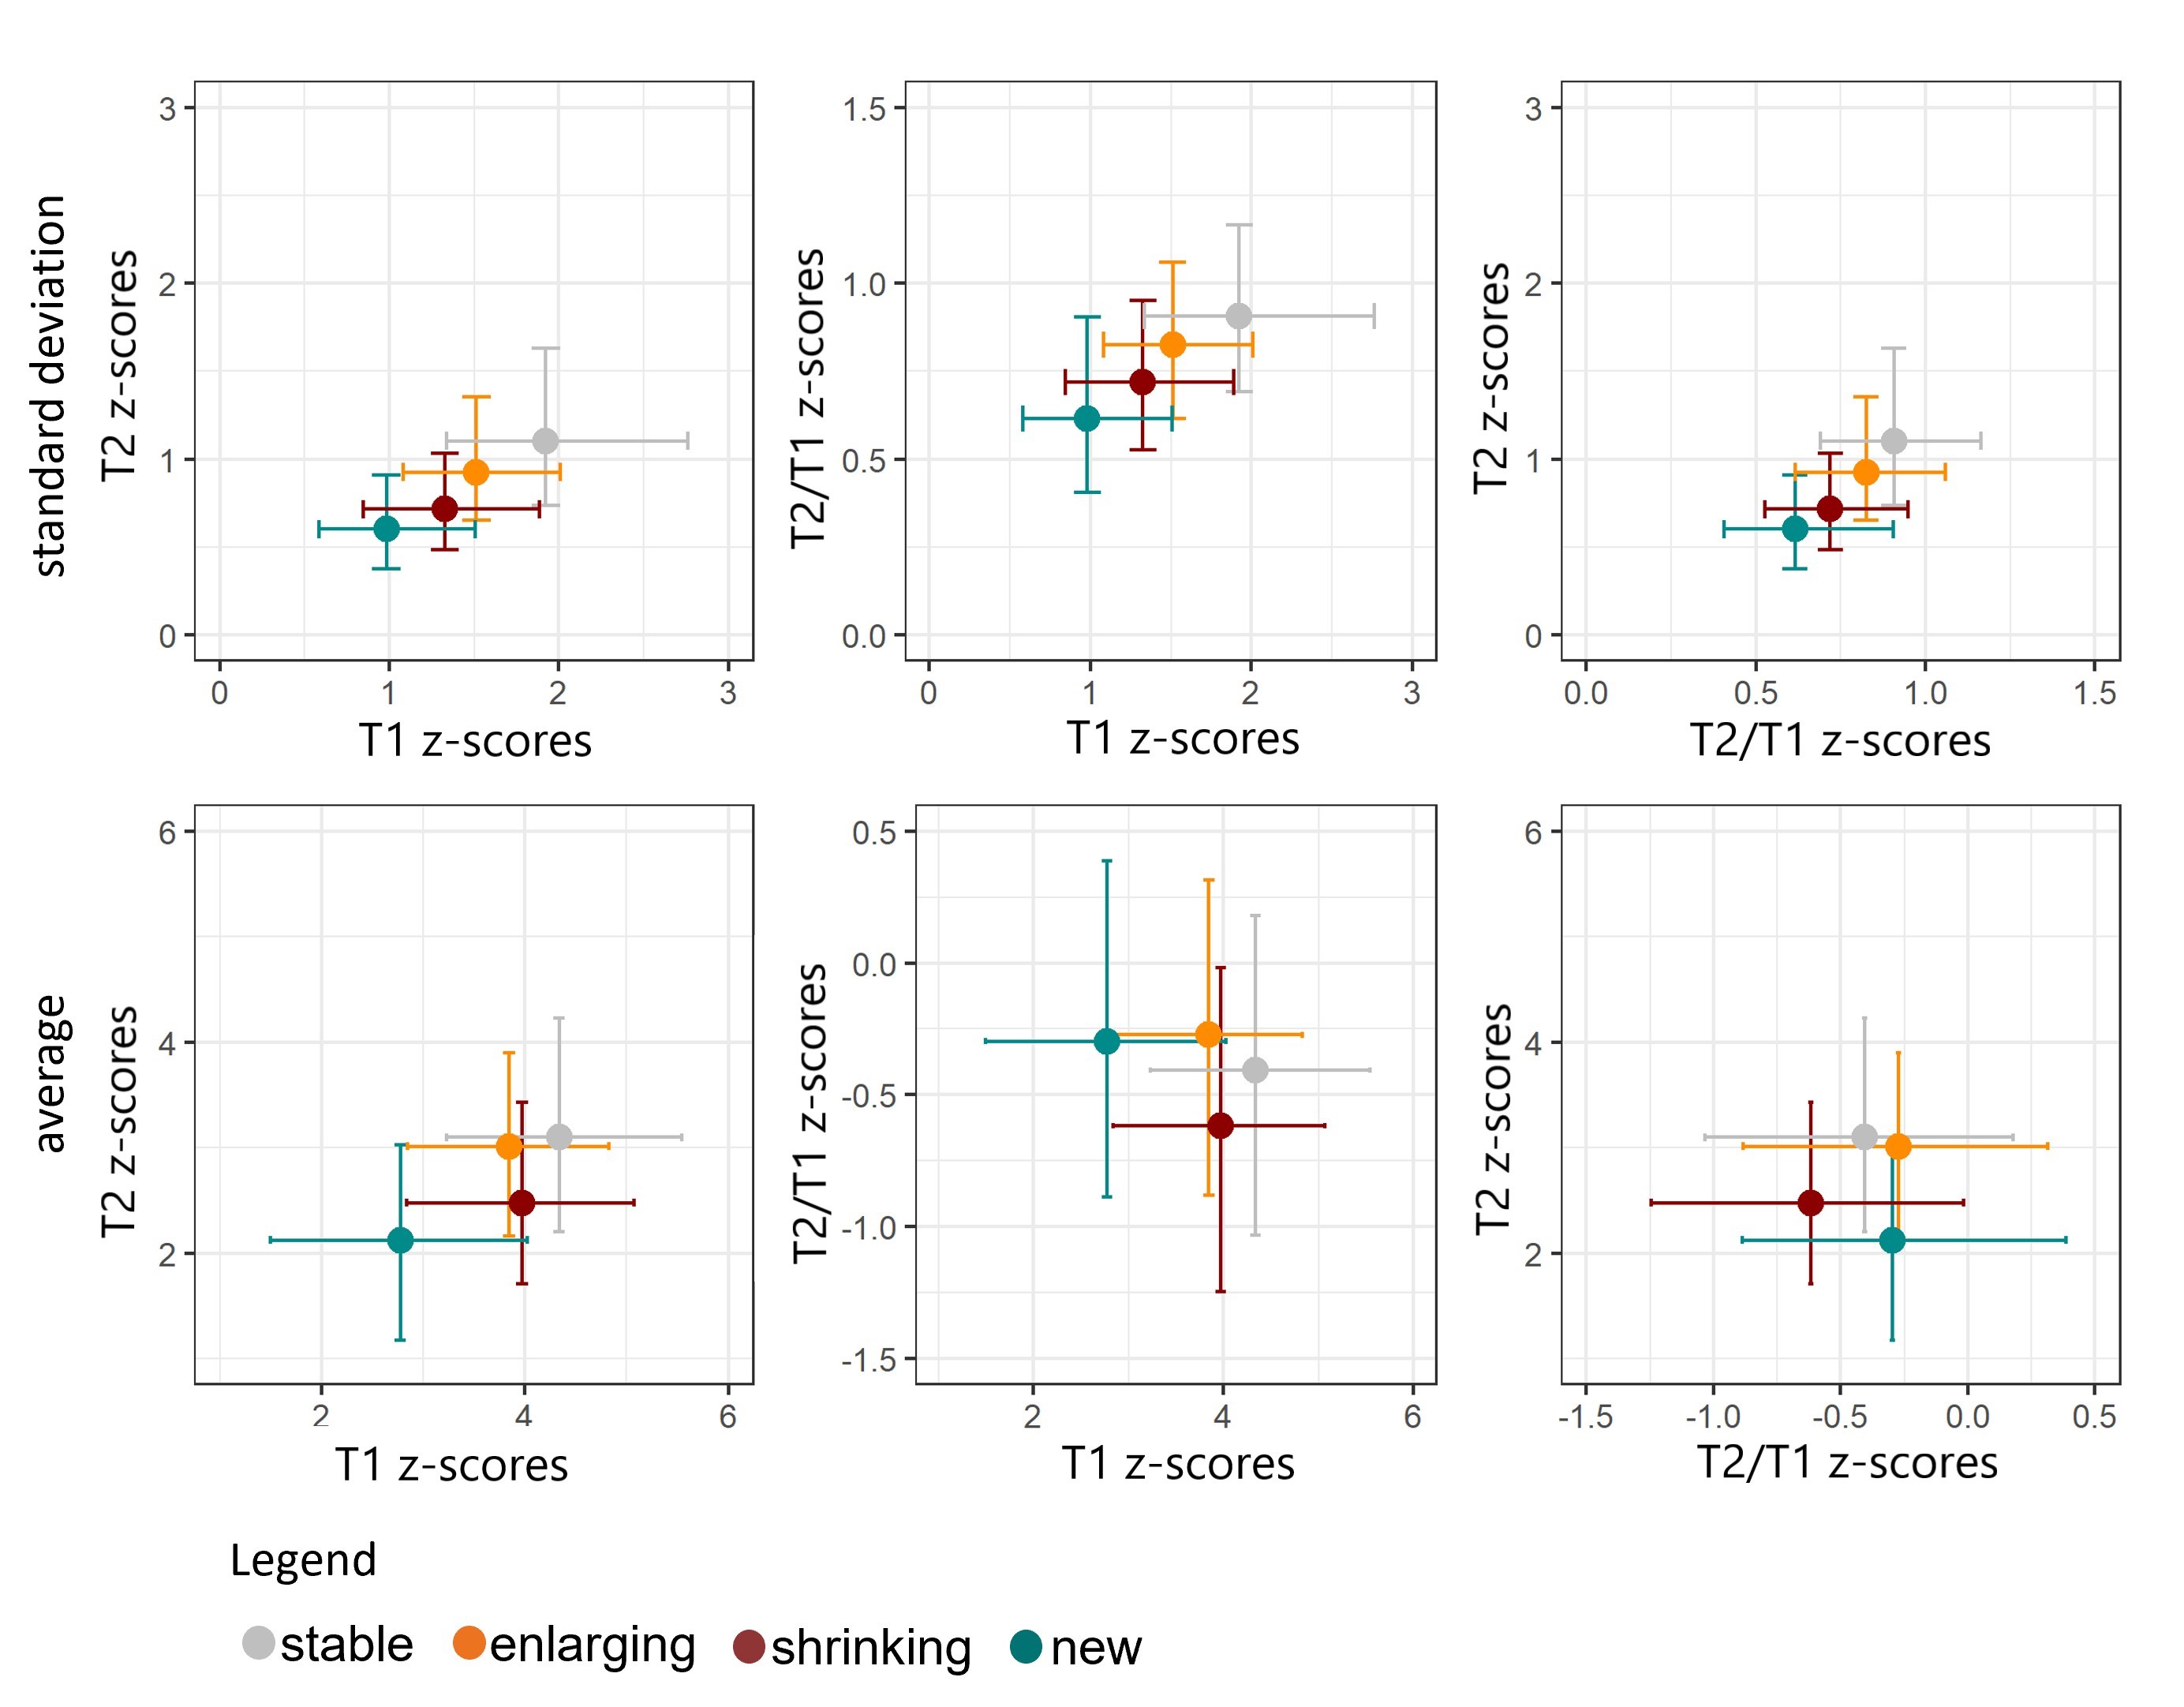
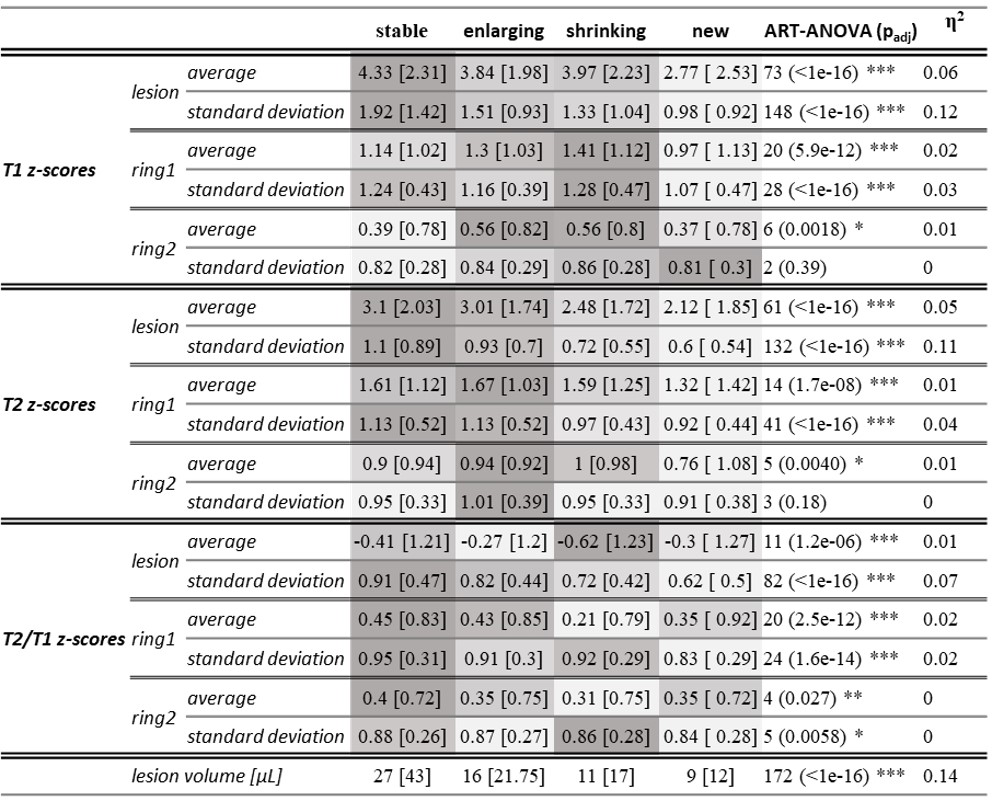
Figure 1 reports the measured quantitative maps and their respective deviation values in one example patient where two different lesions showed positive and negative T2/T1 z-scores, respectively. Table 2 reports the median and interquartile range for each lesion class, along with the results of the aligned-rank transform ANOVA. Figure 2 shows an intuitive visual representation of lesion class medians in T1 vs. T2 vs. T2/T1 z-scores.Stable lesions exhibited the highest average T1 and T2 z-scores and the highest SD of T1, T2 and T2/T1 z-scores. Conversely, new lesions had the lowest T1 and T2 z-scores both in terms of average and SD. In the first perilesional ring, shrinking lesions presented the highest T1 average and SD of z-scores. Considering the T2 z-scores, the highest average values in the first perilesional ring were observed for enlarging lesions.
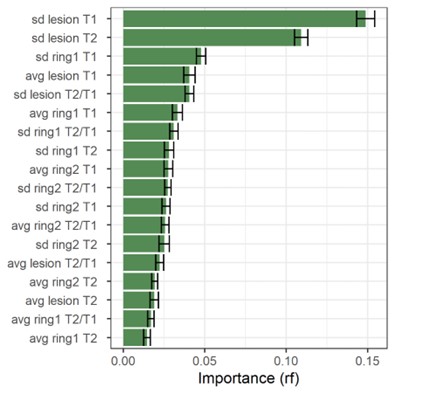
The random forest classifier achieved an overall accuracy of 73%, estimated using the multiclass area under the curve. The balanced accuracy was estimated at 64%, 55%, 54% and 67% for enlarging, shrinking, stable and new lesions, respectively. Figure 3 shows the discriminative importance, reported hereafter as mean±SD across permutations. The metrics that contribute the most to the classification task were:
- the SD of T1 and T2 z-scores in lesion tissue (T1: 0.15±0.005, T2: 0.11±0.004),
- T1 values in the first perilesional ring (0.048±0.003),
- the T2/T1 ratio in lesion tissue (0.040±0.003),
- the average T1 z-score in lesion tissue (0.040±0.004).
Discussion and Conclusion
We showed that z-scores estimated from quantitative T1, T2 and T2/T1 maps in lesion and perilesional tissue carry discriminative and complementary information to classify longitudinal lesion phenotypes. These are encouraging results towards a better understanding of the pathophysiological mechanisms underlying MS disease progression and towards an evaluation of future lesion evolution based on single time point data, which could result in surrogate imaging biomarkers for the detection of SELs.Acknowledgements
The project has received funding by Roche (Healthy controls) - clinical trial NTC03706118, Biogen (scan-rescan dataset) – clinical trial NCT04123353, Czech Ministry of Health project - grants NU 22-04-00193 and institutional support of the hospital research RVO VFN 64165, and Czech Ministry of Education- project Cooperation LF1, research area Neuroscience.References
1. Calvi A, Haider L, Prados F, Tur C, Chard D, Barkhof F. In vivo imaging of chronic active lesions in multiple sclerosis. Mult Scler J. 2022;28(5):683-690. doi:10.1177/1352458520958589
2. Calvi A, Carrasco FP, Tur C, et al. Association of Slowly Expanding Lesions on MRI With Disability in People With Secondary Progressive Multiple Sclerosis. Neurology. 2022;98(17):E1783-E1793. doi:10.1212/WNL.0000000000200144
3. Absinta M, Sati P, Masuzzo F, et al. Association of Chronic Active Multiple Sclerosis Lesions with Disability in Vivo. JAMA Neurol. 2019;76(12):1474-1483. doi:10.1001/jamaneurol.2019.2399
4. Preziosa P, Pagani E, Meani A, et al. Slowly Expanding Lesions Predict 9-Year Multiple Sclerosis Disease Progression. Neurol Neuroimmunol neuroinflammation. 2022;9(2):1-11. doi:10.1212/NXI.0000000000001139
5. Elliott C, Wolinsky JS, Hauser SL, et al. Slowly expanding/evolving lesions as a magnetic resonance imaging marker of chronic active multiple sclerosis lesions. Mult Scler J. 2019;25(14):1915-1925. doi:https://doi.org/10.1177/1352458518814117
6. Calvi A, Clarke MA, Prados F, et al. Relationship between paramagnetic rim lesions and slowly expanding lesions in multiple sclerosis. Mult Scler. 2023;29(3):352-362. doi:10.1177/13524585221141964
7. Elliott C, Rudko DA, Arnold DL, et al. Lesion-level correspondence and longitudinal properties of paramagnetic rim and slowly expanding lesions in multiple sclerosis. Mult Scler J. 2023:1-11. doi:10.1177/13524585231162262
8. Marques JP, Kober T, Krueger G, van der Zwaag W, Van de Moortele P-F, Gruetter R. MP2RAGE, a self bias-field corrected sequence for improved segmentation and T1-mapping at high field. Neuroimage. 2010;49(2):1271-1281. doi:10.1016/j.neuroimage.2009.10.002
9. Mussard E, Hilbert T, Forman C, Meuli R, Thiran JP, Kober T. Accelerated MP2RAGE imaging using Cartesian phyllotaxis readout and compressed sensing reconstruction. Magn Reson Med. 2020;84(4):1881-1894. doi:10.1002/mrm.28244
10. Hilbert T, Sumpf TJ, Weiland E, et al. Accelerated T 2 mapping combining parallel MRI and model-based reconstruction: GRAPPATINI. J Magn Reson Imaging. 2018;48(2):359-368. doi:10.1002/jmri.25972
11. Ravano V, Caneschi S, Krasensky J, et al. Normative brain atlas of T2 over T1 relaxation times ratio for detection of microstructural pathology. ISMRM, Toronto 2023.
12. Piredda GF, Hilbert T, Granziera C, et al. Quantitative brain relaxation atlases for personalized detection and characterization of brain pathology. Magn Reson Med. 2020;83(1):337-351. doi:10.1002/mrm.27927
13. Fartaria MJ, Todea A, Kober T, et al. Partial volume-aware assessment of multiple sclerosis lesions. NeuroImage Clin. 2018;18(January):245-253. doi:10.1016/j.nicl.2018.01.011
14. Fartaria MJ, Bonnier G, Roche A, et al. Automated detection of white matter and cortical lesions in early stages of multiple sclerosis. J Magn Reson Imaging. 2016;43(6):1445-1454. doi:10.1002/jmri.25095
15. Ravano V, Andelova M, Piredda GP, et al. RIMLA: Reproducibility-Informed Method for Longitudinal Assessment. Submitted in parallel to ISMRM 2024.
Figures