2962
Pathophysiology of Multiple Sclerosis (MS) Lesions Identified by Quantitative Ultra High Spatial Resolution (UHSR) MRI1Department of Neurosciences, Lerner Research Institute, The Cleveland Clinic, Cleveland, OH, United States, 2Imaging Institute, The Cleveland Clinic, Cleveland, OH, United States, 3Mellen Center for Multiple Sclerosis Treatment and Research, Neurological Institute, The Cleveland Clinic, Cleveland, OH, United States, 4Department of Biomedical Engineering, Lerner Research Institute, The Cleveland Clinic, Cleveland, OH, United States
Synopsis
Keywords: Multiple Sclerosis, Quantitative Imaging
Motivation: Remyelination is proposed as a strategy for neural repair in multiple sclerosis. Imaging biomarkers quantifying myelin are expected to play an important role for advancing remyelinating therapies.
Goal(s): To assess quantitative T2* (QT2*) as an indicator of myelin density.
Approach: MRI of a fixed MS brain hemisphere was used to identify lesions in gray and white matter. The lesions were subsequently analyzed with histology.
Results: Significant correlations between QT2* and myelin histology were observed within and among lesions.
Impact: Histology provides information on pathophysiology in exquisite detail but cannot be performed on the whole brain. This study demonstrates how quantitative UHSR can direct histology while evaluating potential imaging biomarkers for myelin density.
INTRODUCTION
There are few treatment options for the progressive stages of MS. Remyelination is an emerging strategy for therapeutics to slow or reverse disease progression.1 Development of MR biomarkers of myelin density are therefore a subject of intense interest.2 One barrier is the gap in length scale between MR imaging and histology, making it difficult to validate MR biomarkers. A typical field of view (FOV) for a microscope slide is approximately 1cm2 in plane and 30 microns thick, making it difficult to comprehensively sample tissue in different regions of brain. Conventional MR can capture images of the entire brain within minutes, but can miss features due to limitations in spatial resolution. UHSR MRI of the entire brain3 has the potential to provide a bridge between histology and MR. Here, we demonstrate the use of quantitative UHSR to direct histologic investigation while validating the use of QT2* as a measure of myelin density.METHODS
Tissue from one MS patient was acquired through the Cleveland Clinic rapid autopsy program.4 The left hemisphere was placed in paraformaldehyde within 12 hours of death. After 60 hours, the tissue is placed in cryoprotection solution and stored at 4°C. The tissue was then prepared for imaging on a 7T Terra (Siemens Healthineers, Erlangen).5 Imaging included a FLASH acquisition at 170 micron isotropic resolution (TE/TR=20/51ms) and the ASPIRE implementation of a multi-echo gradient echo at 200 micron isotropic resolution (TE=5,10,15,20,25,30,35,40ms. TR=56ms).6 Quantitative T2* maps were generated using the ROMEO package.7 The hemisphere was then sliced at 1 cm intervals in a brain cutting box and photographed to facilitate coregistration between UHSR MRI and histology. Immunohistochemical stains included proteolipid (PLP) for myelin. Myelin was quantified by capturing 20X images of PLP stains. Slides were scanned on an Aperio AT2 (Leica Biosystems). Myelin density was quantified by measuring the percent area occupied by PLP using an in house script using NIH/Fiji.8 To assess the correspondence between QT2* and myelin density, 1mm2 regions of interest (ROI) were hand-drawn on QT2* maps and on corresponding regions of PLP-stained tissue. Linear regression between mean QT2* and PLP area fraction within each ROI was performed using R Studio (2023.06.0, build 421). Two lesions, one in white matter and one on the border between white matter and gray matter were selected for the regression analysis. 18 regions with low, intermediate and high QT2* values were selected for correlation with PLP area fraction.RESULTS
Figure 1 illustrates the varying degrees of intensity within a lesion on a QT2* corresponding to variation of intensity on PLP stains. QT2* showed significant correlation with myelin density (p = 0.004. Figure 2). Higher T2* corresponds to lower myelin density.DISCUSSION
This work demonstrates the potential of quantitative UHSR to identify ROIs for detailed inspection by immunohistochemistry while providing a framework for validating imaging markers of myelination. Quantitative UHSR MR was used to identify small lesions with a heterogeneous appearance that would have been difficult to identify on gross pathology or with conventional MR. Note that, at conventional spatial resolution, it can be difficult to appreciate variable signal intensity within a lesion, making it difficult to distinguish completely demyelinated lesions from partially demyelinated lesions. The results also lend support to the use ofQT2* as a proxy for myelin.9 The precision of coregistration between tissue and imaging is limited in our current protocol, forcing the use of hand-drawn ROIs instead of voxelwise correlation. Future work will focus on correlations with other immunohistochemical markers to assess the use of quantitative UHSR to reveal pathophysiology beyond demyelination, such as chronic immune activity10 and axonal swelling.11
CONCLUSIONS
UHSR MRI is a promising approach for guiding immunohistochemistry analysis of MS tissue and may contribute to validation of imaging biomarkers for disease progression.Acknowledgements
We gratefully acknowledge support from the American Society of Neuroradiology (ASNR2206), NIH/NINDS K23 NS109328, National Multiple Sclerosis Society, Biogen, Novartis and Sanofi Genzyme. We thank the patients and their families for their support and invaluable gift to the MS rapid autopsy program.
References
1. Plemel, J. R., Liu, W. Q. & Yong, V. W. Remyelination therapies: a new direction and challenge in multiple sclerosis. Nat Rev Drug Discov 2017; 16:617-634.
2. Lazari, A. & Lipp, I. Can MRI measure myelin? Systematic review, qualitative assessment, and meta-analysis of studies validating microstructural imaging with myelin histology. Neuroimage 2021; 230:117744.
3. Edlow, B. L., Mareyam, A., Horn, A., Polimeni, J. R., Witzel, T., Tisdall, M. D., Augustinack, J. C., Stockmann, J. P., Diamond, B. R., Stevens, A., Tirrell, L. S., Folkerth, R. D., Wald, L. L., Fischl, B. & van der Kouwe, A. 7 Tesla MRI of the ex vivo human brain at 100 micron resolution. Sci Data 2019; 6:244.
4. Dutta, R., Mahajan, K. R., Nakamura, K., Ontaneda, D., Chen, J., Volsko, C., Dudman, J., Christie, E., Dunham, J., Fox, R. J. & Trapp, B. D. Comprehensive Autopsy Program for Individuals with Multiple Sclerosis. J Vis Exp 2019;
5. Kim, S., Sakaie, K., Blumcke, I., Jones, S. & Lowe, M. J. Whole-brain, ultra-high spatial resolution ex vivo MRI with off-the-shelf components. Magn Reson Imaging 2021; 76:39-48.
6. Eckstein, K., Dymerska, B., Bachrata, B., Bogner, W., Poljanc, K., Trattnig, S. & Robinson, S. D. Computationally Efficient Combination of Multi-channel Phase Data From Multi-echo Acquisitions (ASPIRE). Magn Reson Med 2018; 79:2996-3006.
7. Dymerska, B., Eckstein, K., Bachrata, B., Siow, B., Trattnig, S., Shmueli, K. & Robinson, S. D. Phase unwrapping with a rapid opensource minimum spanning tree algorithm (ROMEO). Magn Reson Med 2021; 85:2294-2308.
8. Schindelin, J., Arganda-Carreras, I., Frise, E., Kaynig, V., Longair, M., Pietzsch, T., Preibisch, S., Rueden, C., Saalfeld, S., Schmid, B., Tinevez, J. Y., White, D. J., Hartenstein, V., Eliceiri, K., Tomancak, P. & Cardona, A. Fiji: an open-source platform for biological-image analysis. Nat Methods 2012; 9:676-682.
9. Du, Y. P., Chu, R., Hwang, D., Brown, M. S., Kleinschmidt-DeMasters, B. K., Singel, D. & Simon, J. H. Fast multislice mapping of the myelin water fraction using multicompartment analysis of T2* decay at 3T: a preliminary postmortem study. Magn Reson Med 2007; 58:865-870.
10. Kolb, H., Absinta, M., Beck, E. S., Ha, S. K., Song, Y., Norato, G., Cortese, I., Sati, P., Nair, G. & Reich, D. S. 7T MRI Differentiates Remyelinated from Demyelinated Multiple Sclerosis Lesions. Ann Neurol 2021; 90:612-626.
11. Fisher, E., Chang, A., Fox, R. J., Tkach, J. A., Svarovsky, T., Nakamura, K., Rudick, R. A. & Trapp, B. D. Imaging correlates of axonal swelling in chronic multiple sclerosis brains. Ann Neurol 2007; 62:219-228.
Figures
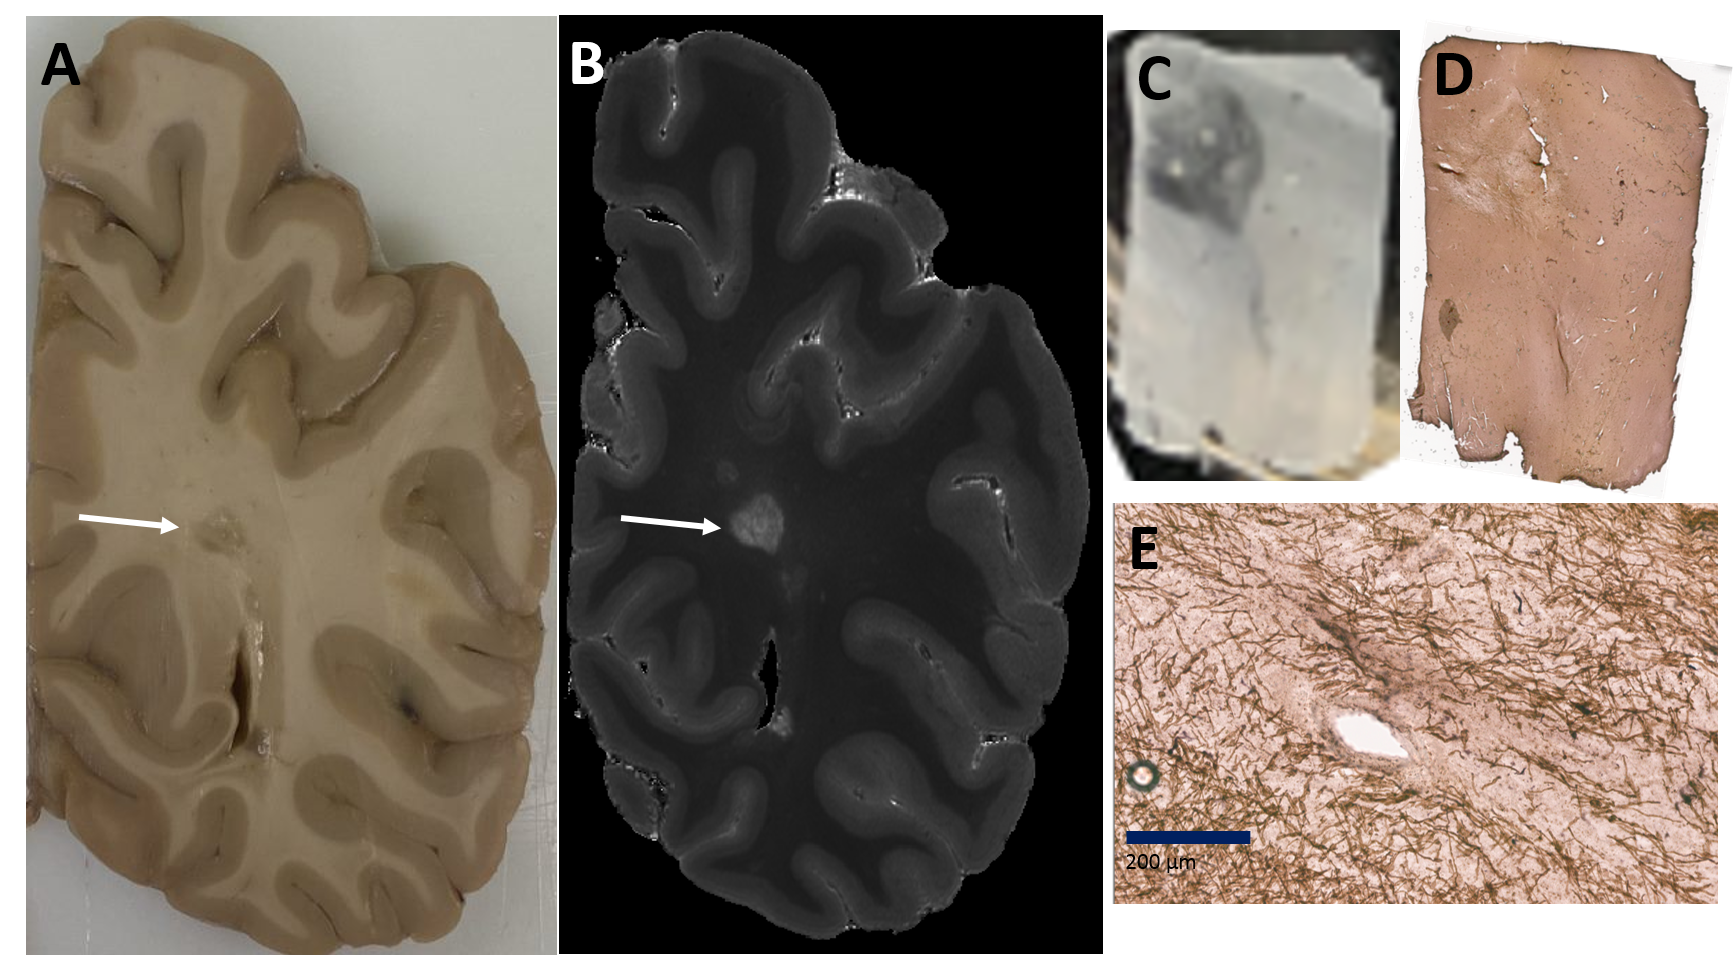
Figure 1. UHSR QT2* indicates variable degrees of demyelination within a lesion. A) Gross pathology shows a lesion on the surface of cut tissue. B) On QT2*, the lesion has a patchy appearance. C) 30 micron thick tissue section of lesion before and D) after PLP stain for myelin. E) Magnified region of PLP stain shows partial demyelination (scale bar = 200μm).
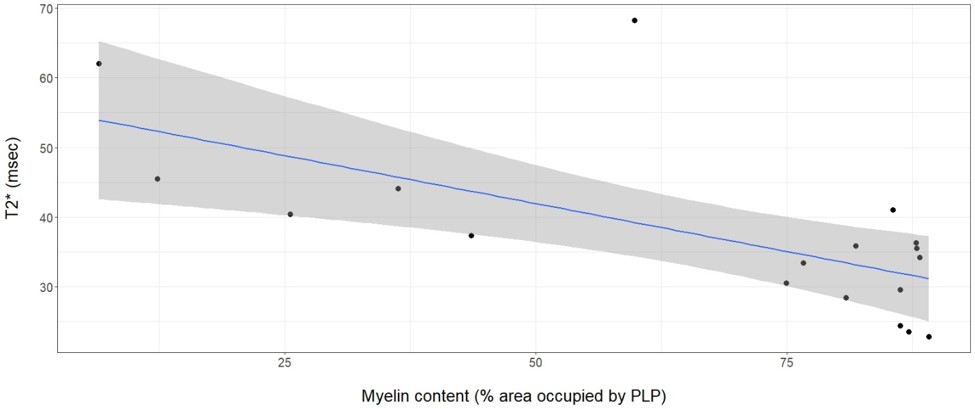
Figure 2. T2* correlates with myelin content. In our model (QT2* = -0.28*PLP + 55.72, p = 0.004)