2961
Unveiling the Association between Gray Matter Atrophy and Impaired Blood Flow in EAE Mouse Model of MS with 9.4T MRI1Department of Radiology, University of Calgary, Calgary, AB, Canada, 2Hotchkiss Brain Institute, University of Calgary, Calgary, AB, Canada, 3Experimental Imaging Centre, University of Calgary, Calgary, AB, Canada, 4Cumming School of Medicine, University of Calgary, Calgary, AB, Canada
Synopsis
Keywords: Multiple Sclerosis, Brain, arterial spin labeling, high field MRI, Atrophy, Perfusion
Motivation: The underlying mechanisms of Multiple Sclerosis (MS) remain unclear, and treatments are lacking. In MS, cerebral atrophy, and impaired cerebral blood flow (CBF), are both aspects of GM pathology.
Goal(s): We aim to assess the relationship between atrophy and CBF in MS, and their changes with disease duration and severity.
Approach: We applied non-invasive ASL-MRI and Atlas-based volumetrics to measure CBF and atrophy in the EAE mouse model of MS, over disease course.
Results: EAE mice showed reduced CBF during peak and long-term disease but atrophy just during long-term disease. Long-term clinical disability and atrophy were correlated with CBF.
Impact: Reduced CBF may relate to pathology in MS, including progression and atrophy. Future studies combining ASL-MRI and atlas-based volumetrics may be useful for investigating the processes underlying neurodegeneration in MS.
INTRODUCTION
Multiple Sclerosis (MS) is characterized by inflammation and progressive neurodegeneration culminating in atrophy1-6. Atrophy has become an important clinical marker of disease progression due to its association with declining neurological function in MS7-15. However, the underlying mechanisms of neurodegeneration and atrophy are not clear, and treatments are lacking. One mechanism of interest is cerebral perfusion, measured via cerebral blood flow (CBF). CBF plays an integral role in MS pathophysiology16-22, and has promise as a non-invasive clinical measurement of gray matter (GM) pathology, either as a promoter or a marker of atrophy. To assess the relationship between atrophy and CBF in MS, we use the experimental autoimmune encephalomyelitis (EAE) mouse model of MS, as it experiences GM neurodegeneration and atrophy at long-term disease duration23. The EAE model also experiences hypoxia during peak inflammation24-26, which could result in reduced blood supply. The aim of this study is to determine how CBF changes with disease duration in the cortex of EAE mice, and whether there is an association between atrophy and CBF. This study will demonstrate whether Arterial Spin Labeling (ASL) MRI could be a non-invasive method of assessing GM pathology.METHODS
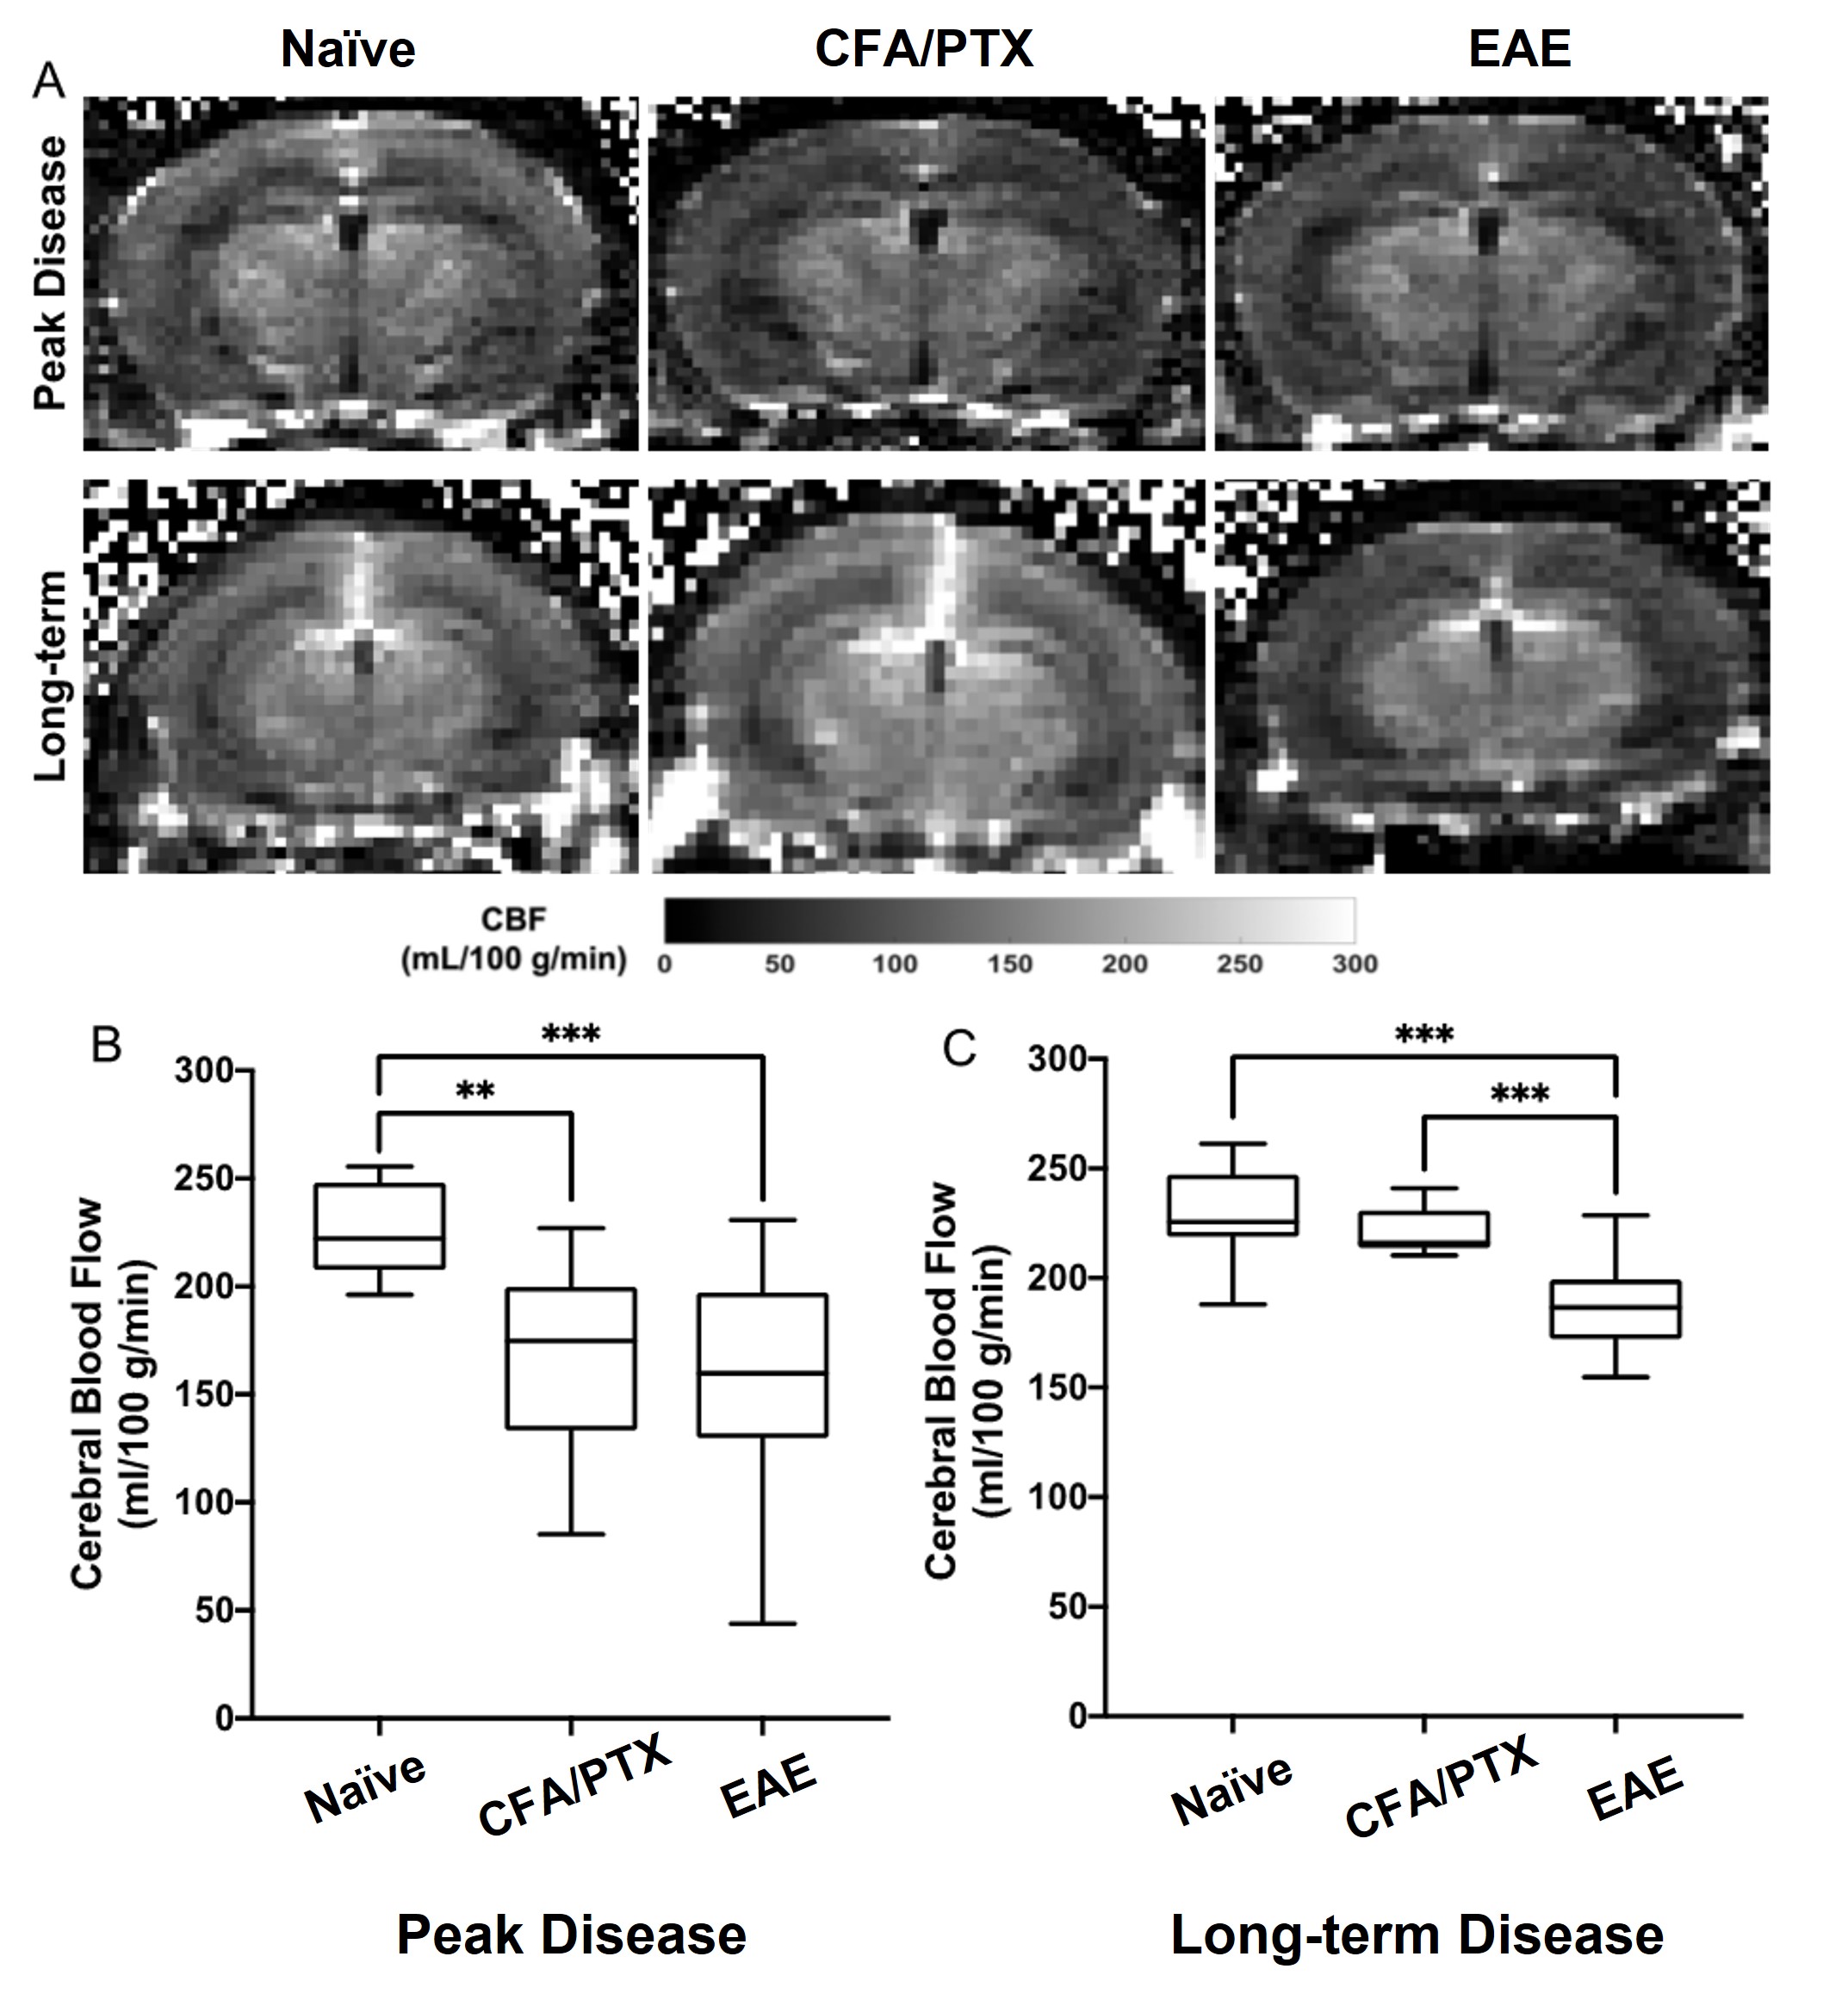
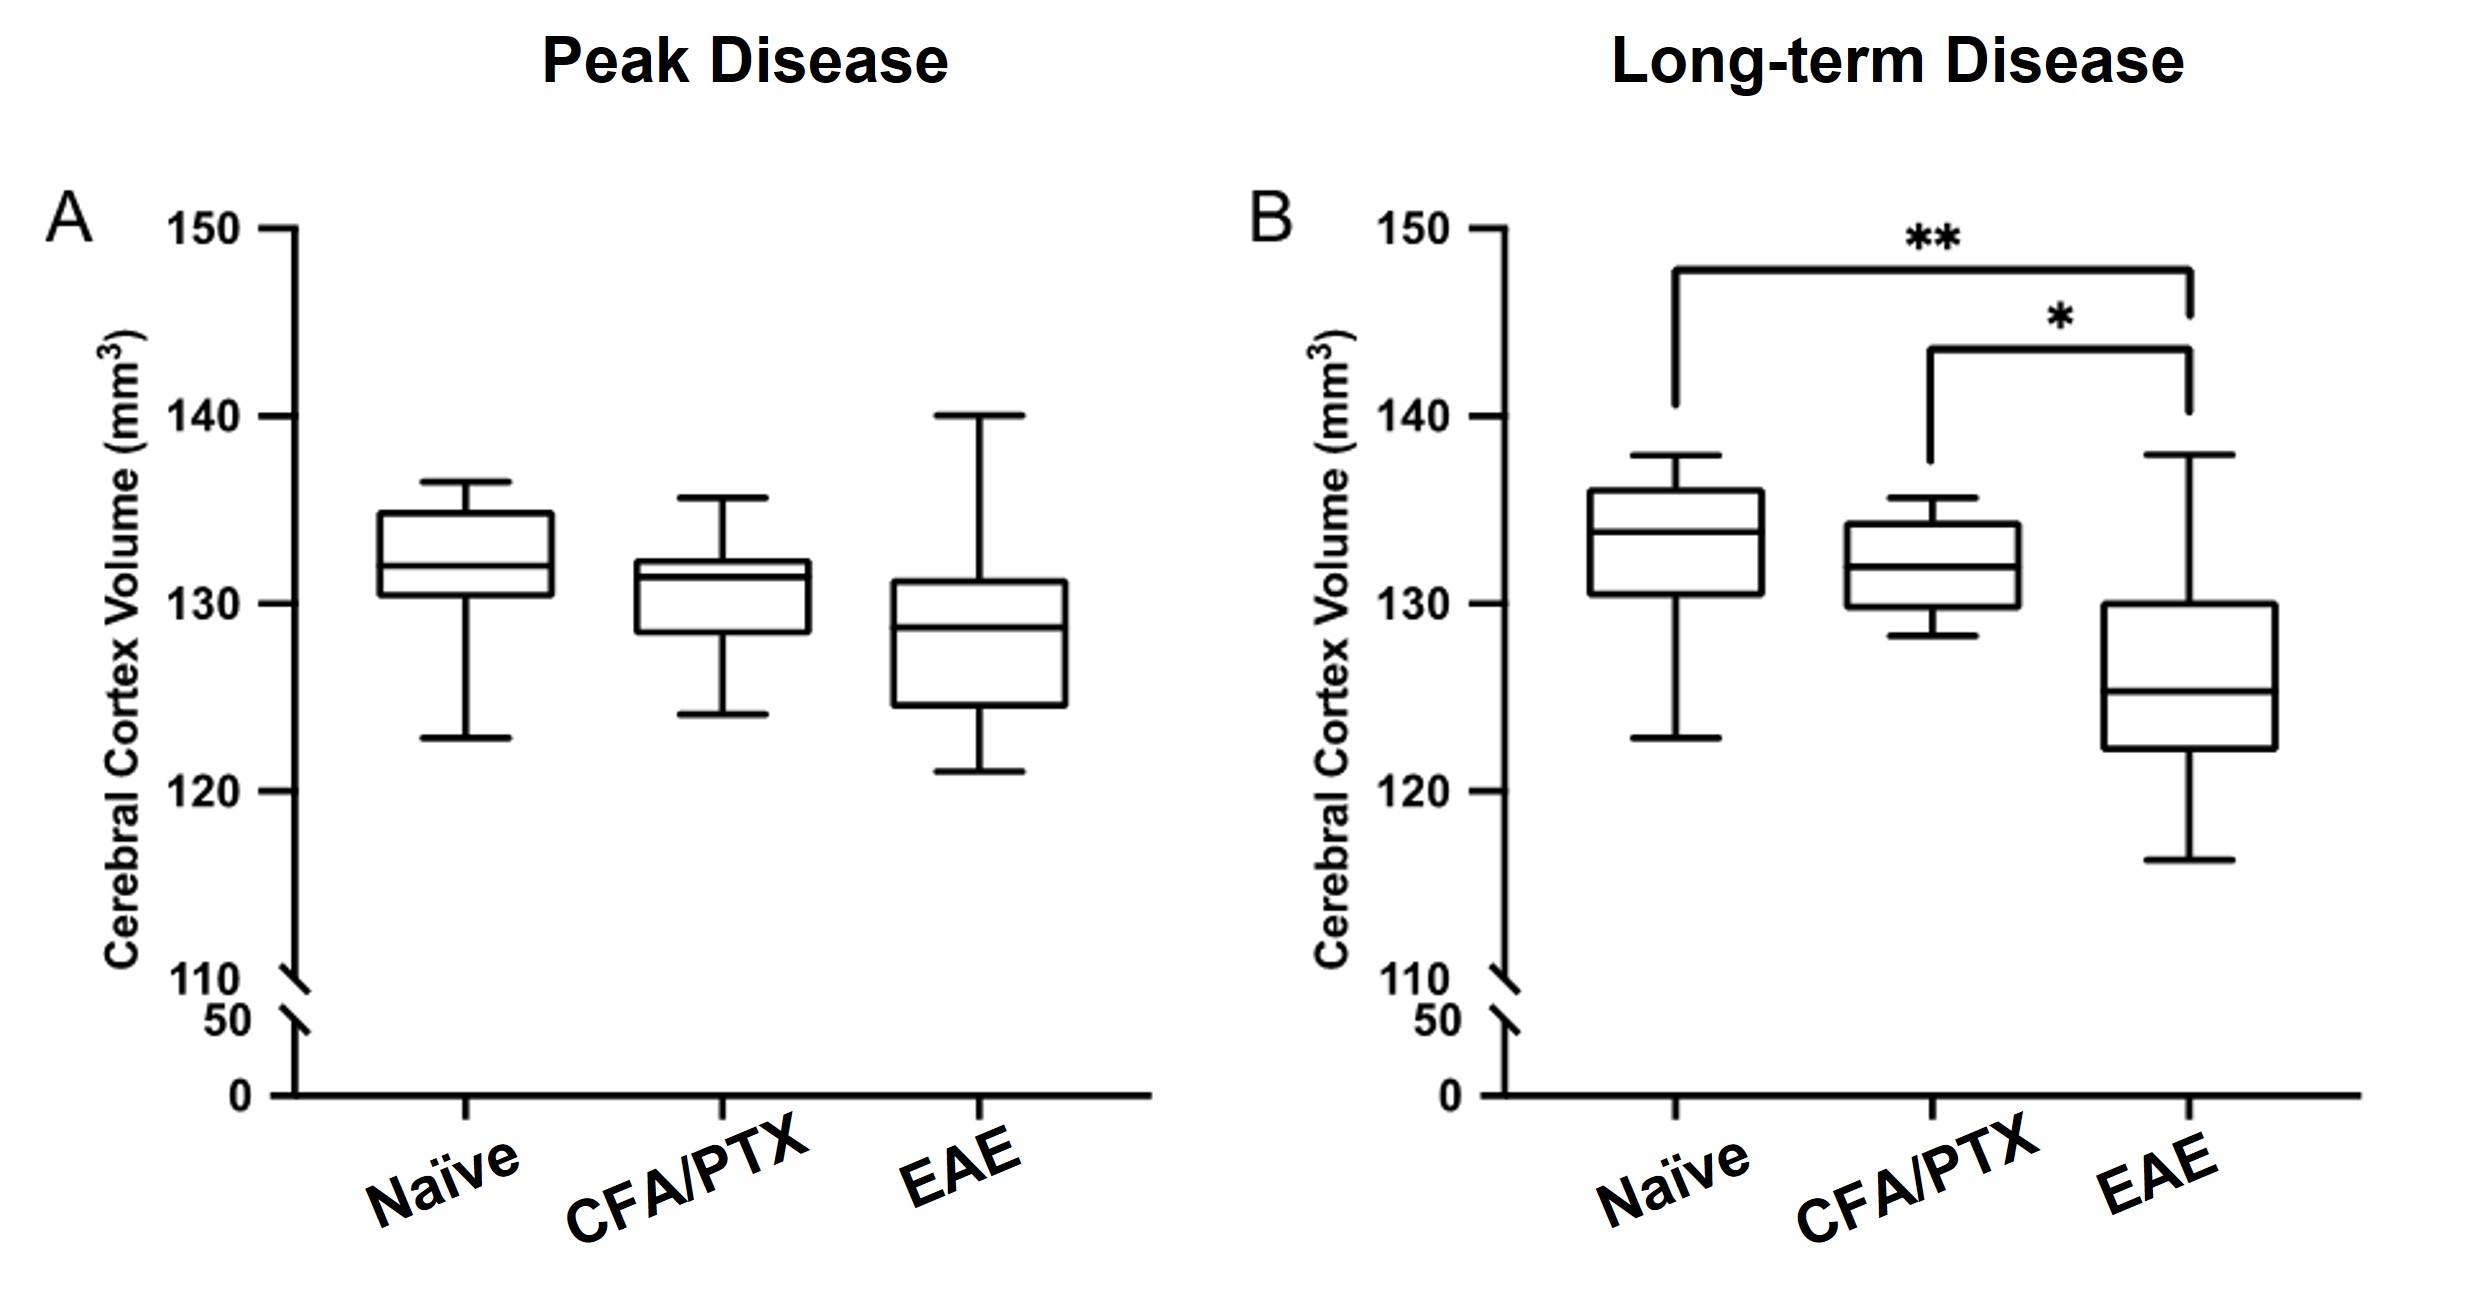
Forty-three C57BL/6J female mice were separated into naïve (n=10), CFA/PTX control (n=10) and EAE (n=23) groups. Naïve mice are controls without interventions. CFA/PTX mice were injected with complete Freund’s adjuvant (CFA) and pertussis toxin (PTX). EAE mice were injected with MOG35-55 peptide emulsified in CFA and PTX. Mice were imaged at “Peak” clinical disease severity and “long-term” disease (14-16 days and 40 days post EAE induction, respectively). Imaging was performed for all groups at the same time points. During imaging, the mice were spontaneously ventilated with a gas mixture of 70% N2/30% O2 and 2% isoflurane. Normal physiological temperature and respiration rate were maintained at 36.5°C and 60 breaths/min. Imaging was conducted using a 9.4T Bruker MRI with an Avance console (Bruker Biospin GmbH, Germany), paravision 5.1, and a 35mm quadrature volume coil. For single-slice perfusion imaging, axial slices were acquired around the bregma with a CASL-HASTE sequence. To account for magnetization transfer, four images consisting of two control and two tagged images were acquired with the following parameters: matrix size=128x128; FOV=30mmx30mm; TR=3000ms; TE=2.66ms; number of averages=16; RARE factor=36; voxel size=0.23mmx0.23mmx1mm; acquisition time=8 minutes. Following this, a T1 map was acquired in the same location using a rapid acquisition with refocused echoes variable repetition time (RARE-VTR) sequence with the following parameters: matrix=128x128; FOV=30mmx30mm; TR=100, 500, 1000, 3000, 7500ms; TE=10ms; voxel size=0.23mmx0.23mmx1mm; acquisition time=6 minutes. The total acquisition time for each perfusion image was 14 minutes. CBF was calculated on a voxel-by-voxel basis from an ROI in the cortex27. A subset of mice at long-term (n=10 naïve, 10 CFA, 10 EAE) were also imaged using anatomical MRI for atlas-based volumetric analysis. These images were collected using a T2-weighted rapid acquisition with refocusing echoes (RARE) sequence where: matrix size=256x256; FOV=20mmx20mm; slice number=30; TR=4500ms; TE=32ms; number of averages=3; RARE factor=36; voxel size=78µm×78µm×500µm. Using the Niftyreg28 software, an averaged brain atlas29 was registered to individual images, and used for volumetric analysis.RESULTS
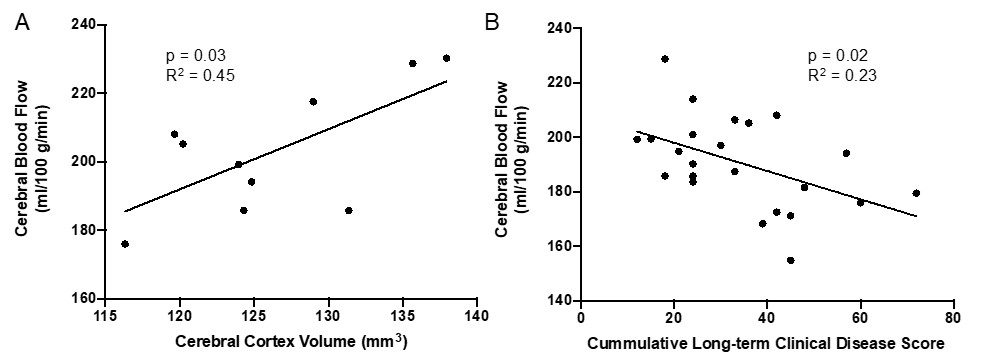
At peak clinical disease, EAE and CFA/PTX mice experienced reduced cortical perfusion compared to naïve controls. At long-term disease, CBF was restored to normal levels in CFA/PTX but not in EAE mice. Leukocyte congestion was found in the cortical microvasculature of EAE at peak clinical disease, and CFA/PTX mice as well. At long-term disease, EAE mice had significantly smaller cortical volume compared to naïve and CFA/PTX controls, while there was no evidence of atrophy at peak clinical disease. Cortical CBF correlated with cortical brain volume and clinical disability at long-term disease.DISCUSSION
At peak clinical disease, reduced CBF could be partially related to inflammation, as a similar reduction was found in the CFA/PTX mouse model of inflammation. Perivascular inflammation is prominent in MS and may disrupt the microvasculature and CBF regulation30-35. Inflammation within the vessels may also disrupt blood flow by directly occluding vessels36,37. At long-term disease, reduced CBF in EAE mice relates to atrophy. It is possible that prolonged reduced CBF plays a role in atrophy by promoting hypoxia and therefore cell death. Alternatively, reduced CBF could be the direct result of GM volume loss, which in turn leads to a decrease in metabolic demand, and therefore lower CBF38,39.CONCLUSION
This study identifies atrophy and reduced CBF in the EAE model. It also supports the use of ASL-MRI and atlas-based volumetrics in future studies to investigate the processes that promote neurodegeneration and atrophy in MS.Acknowledgements
This work was supported by the Sciences and Engineering Research Council (NSERC) RGPIN/05225Discovery grant and CIHR project 173416.References
1. Trapp BD, Ransohoff RM, Fisher E, et al. Neurodegeneration in Multiple Sclerosis: Relationship to Neurological Disability. The Neuroscientist 1999; 5: 48-57. DOI: 10.1177/107385849900500107.
2. Friese MA, Schattling B and Fugger L. Mechanisms of neurodegeneration and axonal dysfunction in multiple sclerosis. Nat Rev Neurol 2014; 10: 225-238. DOI: 10.1038/nrneurol.2014.37.
3. Stadelmann C, Wegner C and Brück W. Inflammation, demyelination, and degeneration — Recent insights from MS pathology. Biochimica et Biophysica Acta (BBA) - Molecular Basis of Disease 2011; 1812: 275-282. DOI: http://dx.doi.org/10.1016/j.bbadis.2010.07.007.
4. Haider L, Simeonidou C, Steinberger G, et al. Multiple sclerosis deep grey matter: the relation between demyelination, neurodegeneration, inflammation and iron. J Neurol Neurosurg Psychiatry 2014; 85. DOI: 10.1136/jnnp-2014-307712.
5. Calabrese M, Magliozzi R, Ciccarelli O, et al. Exploring the origins of grey matter damage in multiple sclerosis. Nat Rev Neurosci 2015; 16. DOI: 10.1038/nrn3900. 6. Horakova D, Kalincik T, Blahova Dusankova J, et al. Clinical correlates of grey matter pathology in multiple sclerosis. BMC Neurology 2012; 12: 10. DOI: 10.1186/1471-2377-12-10.
7. Moll NM, Rietsch AM, Ransohoff AJ, et al. Cortical demyelination in PML and MS: Similarities and differences. Neurology 2008; 70: 336-343. 2007/10/05. DOI: 10.1212/01.WNL.0000284601.54436.e4.
8. Popescu V, Schoonheim MM, Versteeg A, et al. Grey Matter Atrophy in Multiple Sclerosis: Clinical Interpretation Depends on Choice of Analysis Method. PLoS One 2016; 11: e0143942. 2016/01/09. DOI: 10.1371/journal.pone.0143942.
9. Stadelmann C, Albert M, Wegner C, et al. Cortical pathology in multiple sclerosis. Curr Opin Neurol 2008; 21: 229-234. 2008/05/03. DOI: 10.1097/01.wco.0000318863.65635.9a.
10. Tallantyre EC, Bø L, Al-Rawashdeh O, et al. Clinico-pathological evidence that axonal loss underlies disability in progressive multiple sclerosis. Mult Scler 2010; 16: 406-411. 2010/03/11. DOI: 10.1177/1352458510364992.
11. van Horssen J, Witte ME and Ciccarelli O. The role of mitochondria in axonal degeneration and tissue repair in MS. Multiple Sclerosis Journal 2012; 18: 1058-1067. DOI: 10.1177/1352458512452924.
12. Larochelle C, Uphaus T, Prat A, et al. Secondary Progression in Multiple Sclerosis: Neuronal Exhaustion or Distinct Pathology? Trends in Neurosciences 2016; 39: 325-339. DOI: http://dx.doi.org/10.1016/j.tins.2016.02.001.
13. Simon JH. Brain and spinal cord atrophy in multiple sclerosis: role as a surrogate measure of disease progression. CNS Drugs 2001; 15: 427-436.
14. Bakshi R, Benedict RHB, Bermel RA, et al. Regional Brain Atrophy Is Associated With Physical Disability in Multiple Sclerosis: Semiquantitative Magnetic Resonance Imaging and Relationship to Clinical Findings. Journal of Neuroimaging 2001; 11: 129-136. DOI: 10.1111/j.1552-6569.2001.tb00022.x.
15. Calabrese M, Agosta F, Rinaldi F, et al. Cortical lesions and atrophy associated with cognitive impairment in relapsing-remitting multiple sclerosis. Arch Neurol 2009; 66: 1144-1150. DOI: 10.1001/archneurol.2009.174.
16. Hojjat S-P, Cantrell CG, Carroll TJ, et al. Perfusion reduction in the absence of structural differences in cognitively impaired versus unimpaired RRMS patients. Multiple sclerosis (Houndmills, Basingstoke, England) 2016; 22: 1685-1694. 2016/02/04. DOI: 10.1177/1352458516628656.
17. Vitorino R, Hojjat SP, Cantrell CG, et al. Regional Frontal Perfusion Deficits in Relapsing-Remitting Multiple Sclerosis with Cognitive Decline. AJNR Am J Neuroradiol 2016; 37: 1800-1807. 2016/05/21. DOI: 10.3174/ajnr.A4824.
18. Inglese M, Park S-J, Johnson G, et al. Deep Gray Matter Perfusion in Multiple Sclerosis: Dynamic Susceptibility Contrast Perfusion Magnetic Resonance Imaging at 3 T. Archives of Neurology 2007; 64: 196-202. DOI: 10.1001/archneur.64.2.196.
19. Inglese M, Adhya S, Johnson G, et al. Perfusion magnetic resonance imaging correlates of neuropsychological impairment in multiple sclerosis. Journal of cerebral blood flow and metabolism : official journal of the International Society of Cerebral Blood Flow and Metabolism 2008; 28: 164-171. 2007/05/02. DOI: 10.1038/sj.jcbfm.9600504.
20. Paing D, Thade Petersen E, Tozer DJ, et al. Cerebral arterial bolus arrival time is prolonged in multiple sclerosis and associated with disability. Journal of cerebral blood flow and metabolism : official journal of the International Society of Cerebral Blood Flow and Metabolism 2014; 34: 34-42. 2013/09/18. DOI: 10.1038/jcbfm.2013.161.
21. Fancis PL, Jakubovic R, Connor P, et al. Robust Perfusion Deficits in Cognitively Impaired Patients with Secondary-Progressive Multiple Sclerosis. American Journal of Neuroradiology 2013; 34: 62. DOI: 10.3174/ajnr.A3148.
22. Aviv RI, Francis PL, Tenenbein R, et al. Decreased frontal lobe gray matter perfusion in cognitively impaired patients with secondary-progressive multiple sclerosis detected by the bookend technique. AJNR Am J Neuroradiol 2012; 33: 1779-1785. 2012/04/28. DOI: 10.3174/ajnr.A3060.
23. Hamilton AM, Forkert ND, Yang R, et al. Central nervous system targeted autoimmunity causes regional atrophy: a 9.4T MRI study of the EAE mouse model of Multiple Sclerosis. Scientific Reports 2019; 9: 8488. DOI: 10.1038/s41598-019-44682-6.
24. Johnson TW, Wu Y, Nathoo N, et al. Gray Matter Hypoxia in the Brain of the Experimental Autoimmune Encephalomyelitis Model of Multiple Sclerosis. PLOS ONE 2016; 11: e0167196. DOI: 10.1371/journal.pone.0167196.
25. Nathoo N, Agrawal S, Wu Y, et al. Susceptibility-weighted imaging in the experimental autoimmune encephalomyelitis model of multiple sclerosis indicates elevated deoxyhemoglobin, iron deposition and demyelination. Mult Scler 2013; 19: 721-731. 2012/10/03. DOI: 10.1177/1352458512460602.
26. Davies AL, Desai RA, Bloomfield PS, et al. Neurological deficits caused by tissue hypoxia in neuroinflammatory disease. Ann Neurol 2013; 74: 815-825. 2013/09/17. DOI: 10.1002/ana.24006.
27. Buxton RB. Quantifying CBF with arterial spin labeling. Journal of magnetic resonance imaging : JMRI 2005; 22: 723- 726. 2005/11/02. DOI: 10.1002/jmri.20462.
28. Modat M, Ridgway GR, Taylor ZA, et al. Fast free-form deformation using graphics processing units. Computer methods and programs in biomedicine 2010; 98: 278-284. 2009/10/13. DOI: 10.1016/j.cmpb.2009.09.002.
29. Dorr AE, Lerch JP, Spring S, et al. High resolution three-dimensional brain atlas using an average magnetic resonance image of 40 adult C57Bl/6J mice. Neuroimage 2008; 42: 60-69. DOI: 10.1016/j.neuroimage.2008.03.037.
30.Takeshita Y, Obermeier B, Cotleur AC, et al. Effects of neuromyelitis optica-IgG at the blood-brain barrier in vitro. Neurol Neuroimmunol Neuroinflamm 2017; 4: e311. 2016/12/27. DOI: 10.1212/nxi.0000000000000311.
31. Laupacis A, Lillie E, Dueck A, et al. Association between chronic cerebrospinal venous insufficiency and multiple sclerosis: a meta-analysis. Cmaj 2011; 183: E1203-1212. 2011/10/05. DOI: 10.1503/cmaj.111074.
32. Debernard L, Melzer TR, Van Stockum S, et al. Reduced grey matter perfusion without volume loss in early relapsing-remitting multiple sclerosis. Journal of Neurology, Neurosurgery & Psychiatry 2014; 85: 544-551. DOI: 10.1136/jnnp-2013-305612.
33. Mulligan SJ and MacVicar BA. Calcium transients in astrocyte endfeet cause cerebrovascular constrictions. Nature 2004; 431: 195-199. 2004/09/10. DOI: 10.1038/nature02827.
34. D'Haeseleer M, Hostenbach S, Peeters I, et al. Cerebral hypoperfusion: a new pathophysiologic concept in multiple sclerosis? Journal of cerebral blood flow and metabolism : official journal of the International Society of Cerebral Blood Flow and Metabolism 2015; 35: 1406-1410. 2015/06/24. DOI: 10.1038/jcbfm.2015.131.
35. Wuerfel J, Paul F and Zipp F. Cerebral blood perfusion changes in multiple sclerosis. J Neurol Sci 2007; 259: 16-20. 2007/03/27. DOI: 10.1016/j.jns.2007.02.011.
36. Wakefield AJ, More LJ, Difford J, et al. Immunohistochemical study of vascular injury in acute multiple sclerosis. J Clin Pathol 1994; 47: 129-133. 1994/02/01. DOI: 10.1136/jcp.47.2.129.
37. Weller RO. A Colour Atlas of Multiple Sclerosis and Other Myelin Disorders. Journal of Neurology, Neurosurgery, and Psychiatry 1989; 52: 1216-1217.
38. Venkat P, Chopp M and Chen J. New insights into coupling and uncoupling of cerebral blood flow and metabolism in the brain. Croat Med J 2016; 57: 223-228. 2016/07/05. DOI: 10.3325/cmj.2016.57.223.
39. Muoio V, Persson PB and Sendeski MM. The neurovascular unit - concept review. Acta Physiol (Oxf) 2014; 210: 790-798. 2014/03/19. DOI: 10.1111/apha.12250.
Figures