2959
SHAP Interpretation of Machine Learning Model for Subcortical White Matter Biomarkers in Cognitive Impairment in Multiple Sclerosis Patients1Biomedical Imaging Center, Pontificia Universidad Catolica de Chile, Santiago, Chile, 2Radiology Department, School of Medicine, Pontificia Universidad Catolica de Chile, Santiago, Chile, 3Millennium Institute for IntelligentHealthcare Engineering - iHEALTH, Pontificia Universidad Catolica de Chile, Santiago, Chile, 4Physics Department, Faculty of Science, Universidad de Santiago, Santiago, Chile, 5School of of Civil Engineering, Computer Science and Telecommunications, Faculty of Engineering, Universidad Finis Terrae, Santiago, Chile, 6Department of Informatics and Computing, Faculty of Engineering,, Universidad Tecnológica Metropolitana, Santiago, Chile, 7Radiology Department, Instituto de Neurocirugía – Dr. Alfonso Asenjo, Santiago, Chile, 8Neurology Department, School of Medicine, Pontificia Universidad Catolica de Chile, Santiago, Chile, 9Interdisciplinary Center of Neurosciences, Pontificia Universidad Catolica de Chile, Santiago, Chile, 10Neurology Service, Hospital Dr. Sótero del Río, Santiago, Chile
Synopsis
Keywords: Multiple Sclerosis, Multiple Sclerosis, .
Motivation: Multiple Sclerosis patients present cognitive decline at the early stages of the disease. Current neurocognitive batteries may not identify early changes. FA evaluates microstructural changes in white matter. To consider clinicopathological correlation remains complex and needs to be understood.
Goal(s): A biomarker that could detect patients with cognitive deficits might benefit from early diagnosis and treatment.
Approach: ML to identify subcortical white matter biomarkers between Healthy Controls with Cognitive Preserved and Relapsing-Remitting Multiple Sclerosis patients with or without cognitive impairment in verbal episodic memory.
Results: We found six FA biomarkers, all located in the frontal lobes. These features maximized the accuracy, obtained: 62.22±17.33%.
Impact: Since the MRI is the gold standard for MS diagnosis, we can obtain new insights about not only the patient's condition but also detect early changes in patients with cognitive impairment.
Introduction
Cognitive decline is recognized as a prevalent symptom at early stages of Multiple sclerosis (MS) disease (1). The patients present cognitive impairment, especially in episodic memory (2). This has been related to gray matter atrophy and white matter lesions in subcortical areas (3-5). The auditory Verbal Learning Test (AVLT) is a validated tool to evaluate changes in verbal episodic memory (6).Fractional Anisotropy (FA) evaluates microstructural changes from myelination of white matter tracts, reducing MS (7). However, its effect and clinicopathological correlation remain complex and must be fully understood (8).
Machine Learning (ML) algorithms showed promising results in classifying MRI of patients with neurologic disorders (9,10). Tree-based ML models are mainly used as a predictive approach; nevertheless, they do not explain how they perform associations (11). To overcome this, Shapley Additive exPlanations (SHAP) values assign each feature a weight for a particular prediction and allow us to understand the model. In this study, we used a tree-based ML approach to identify subcortical white matter biomarkers between Healthy Controls Cognitively Preserved (HC-CP) and relapsing-remitting MS (RRMS) patients with or without cognitive impairment (RRMS-CP, RRMS-CI, respectively) in verbal episodic memory as determined by the results from the AVLT test.
Methods
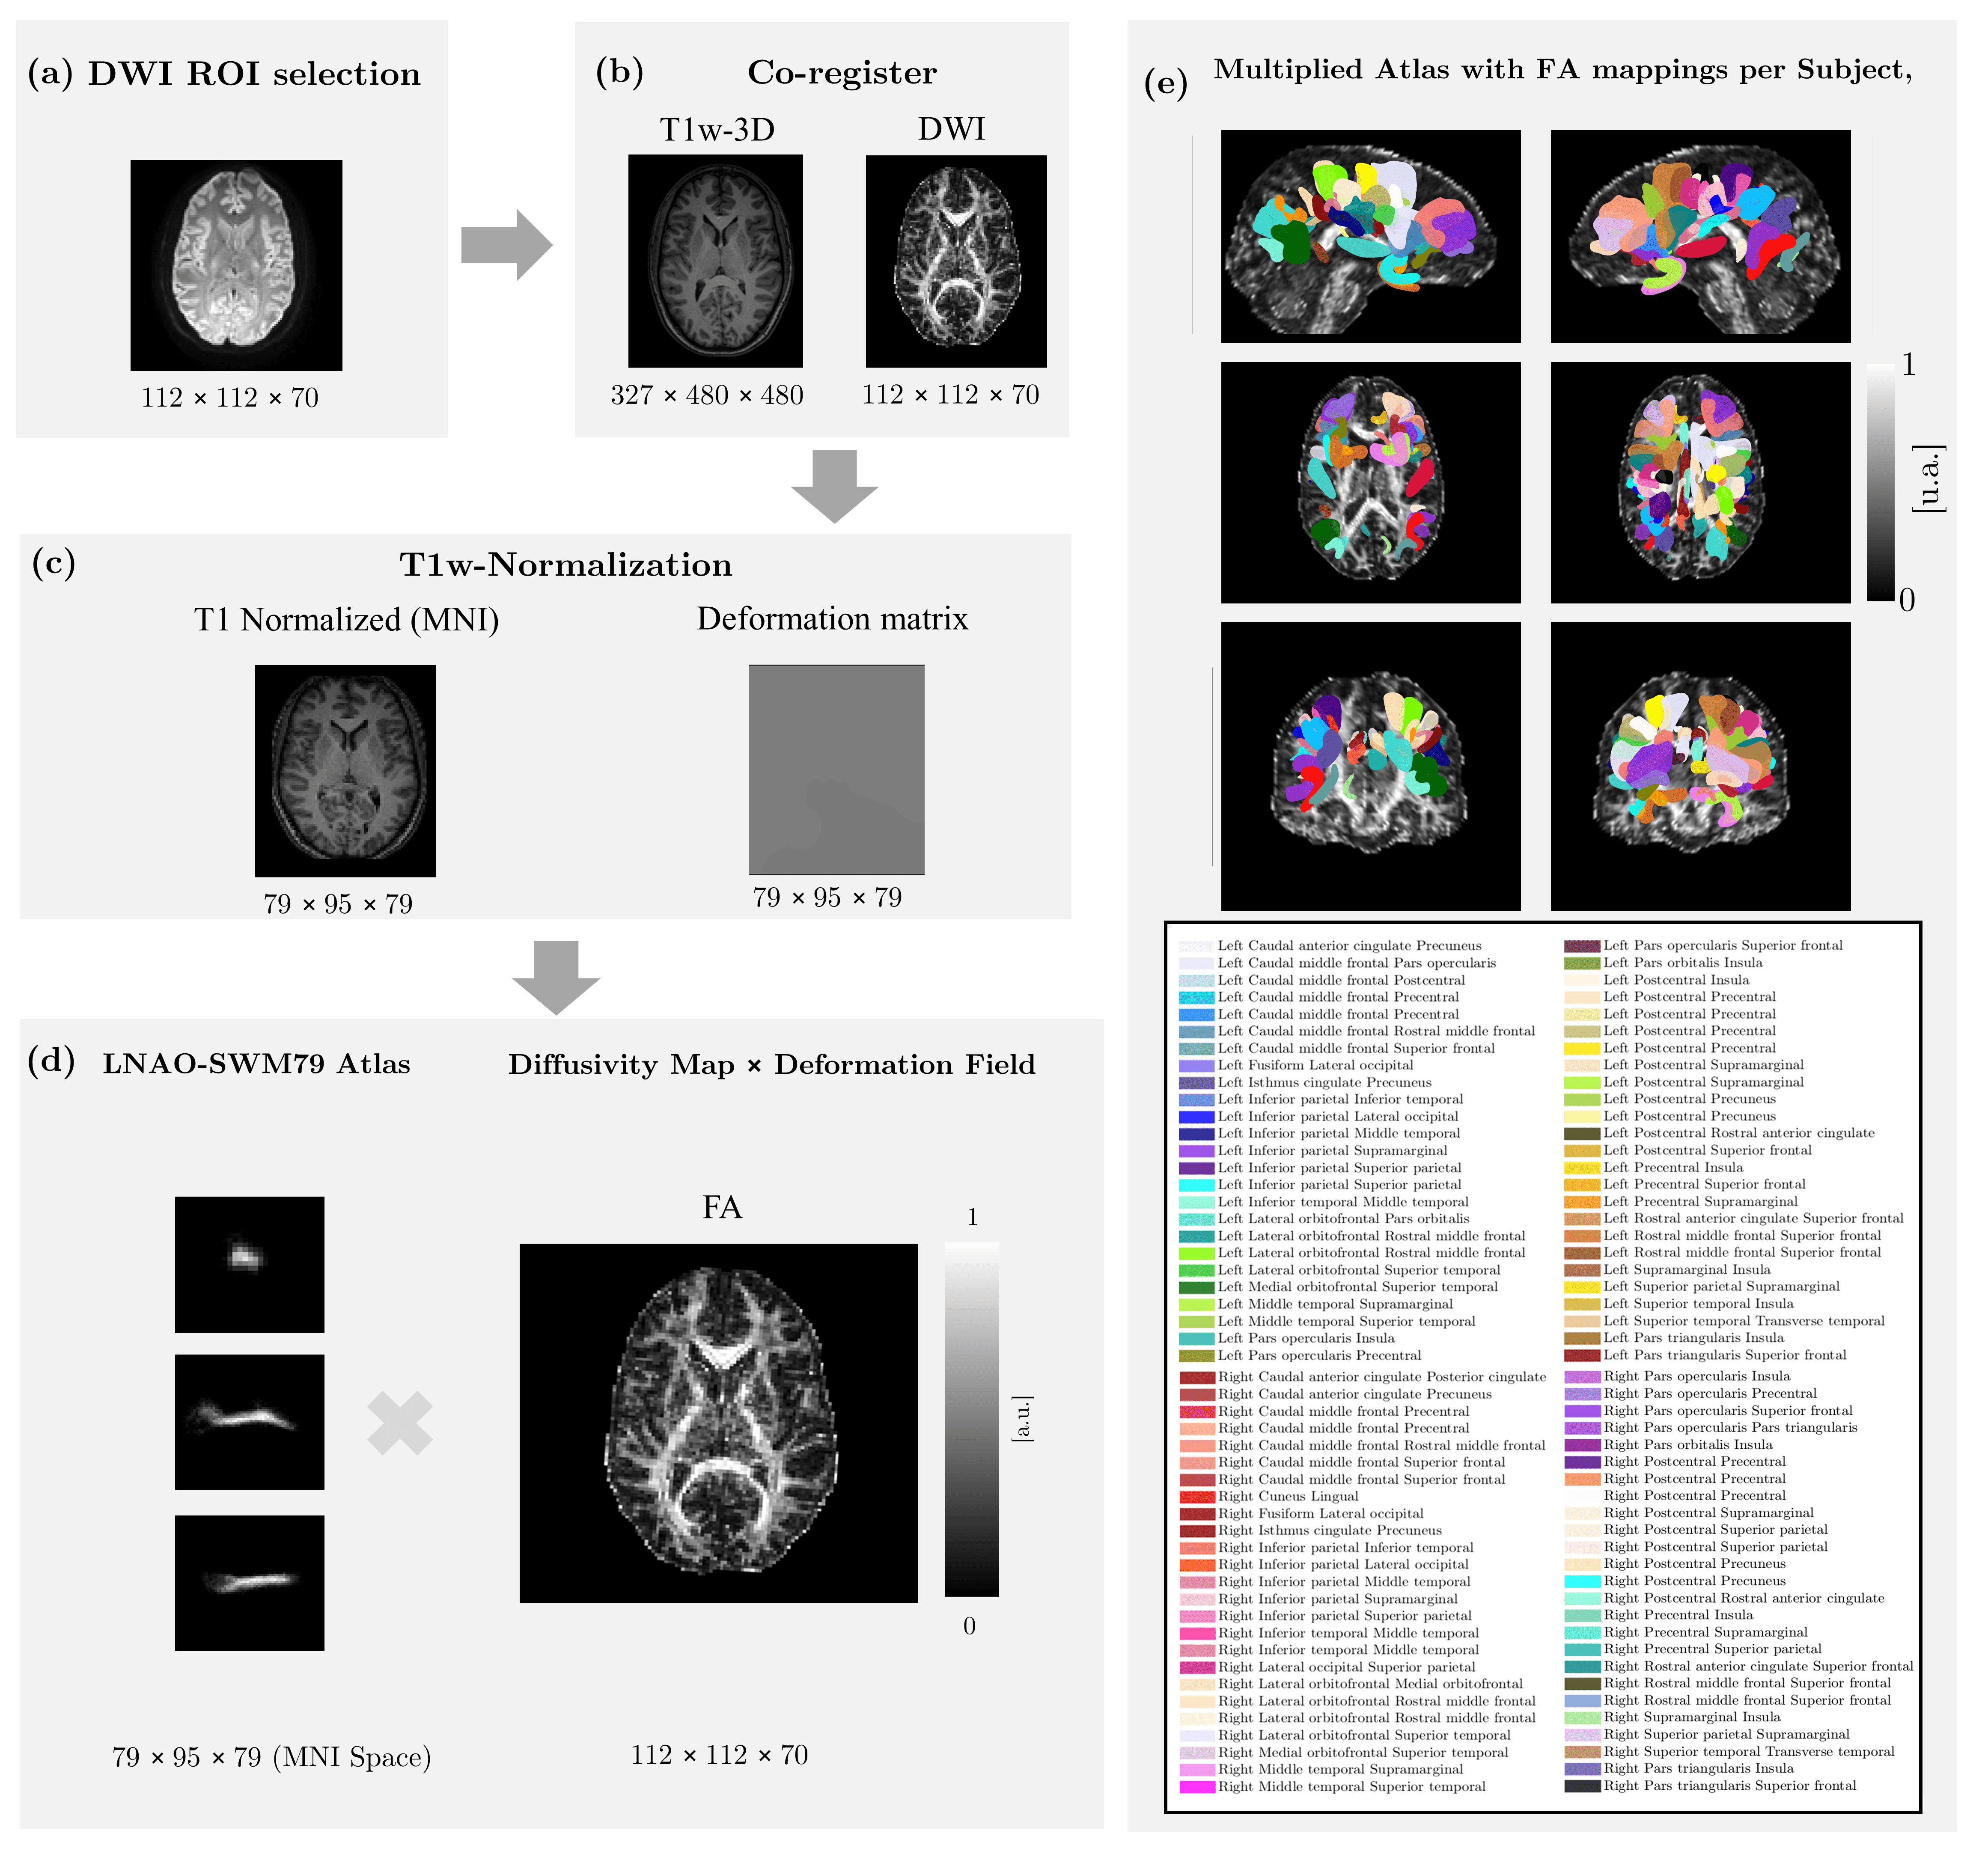
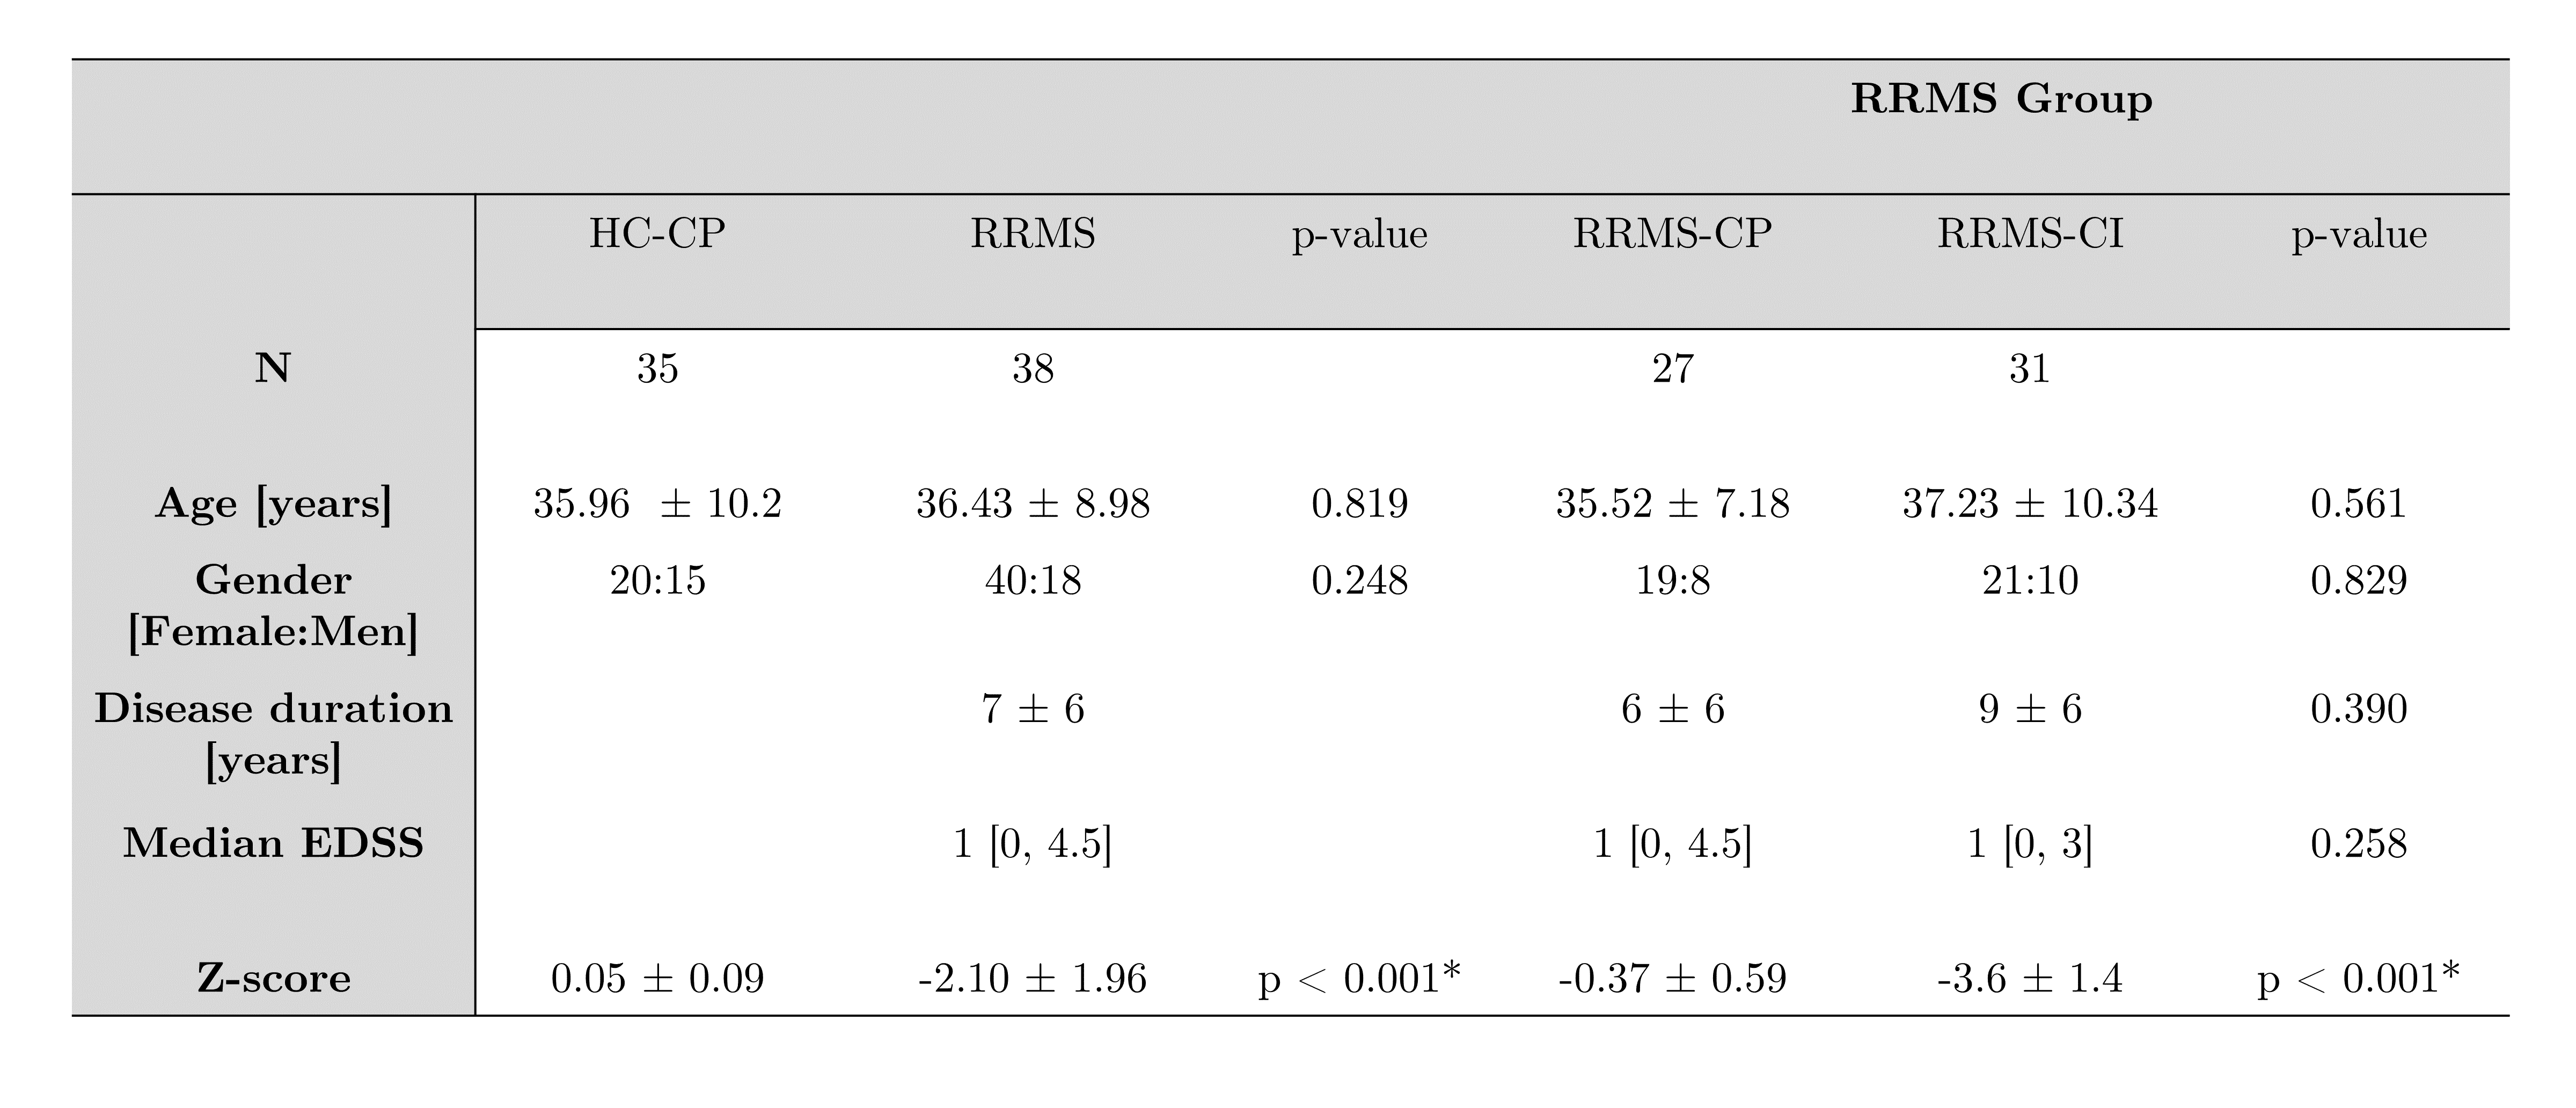
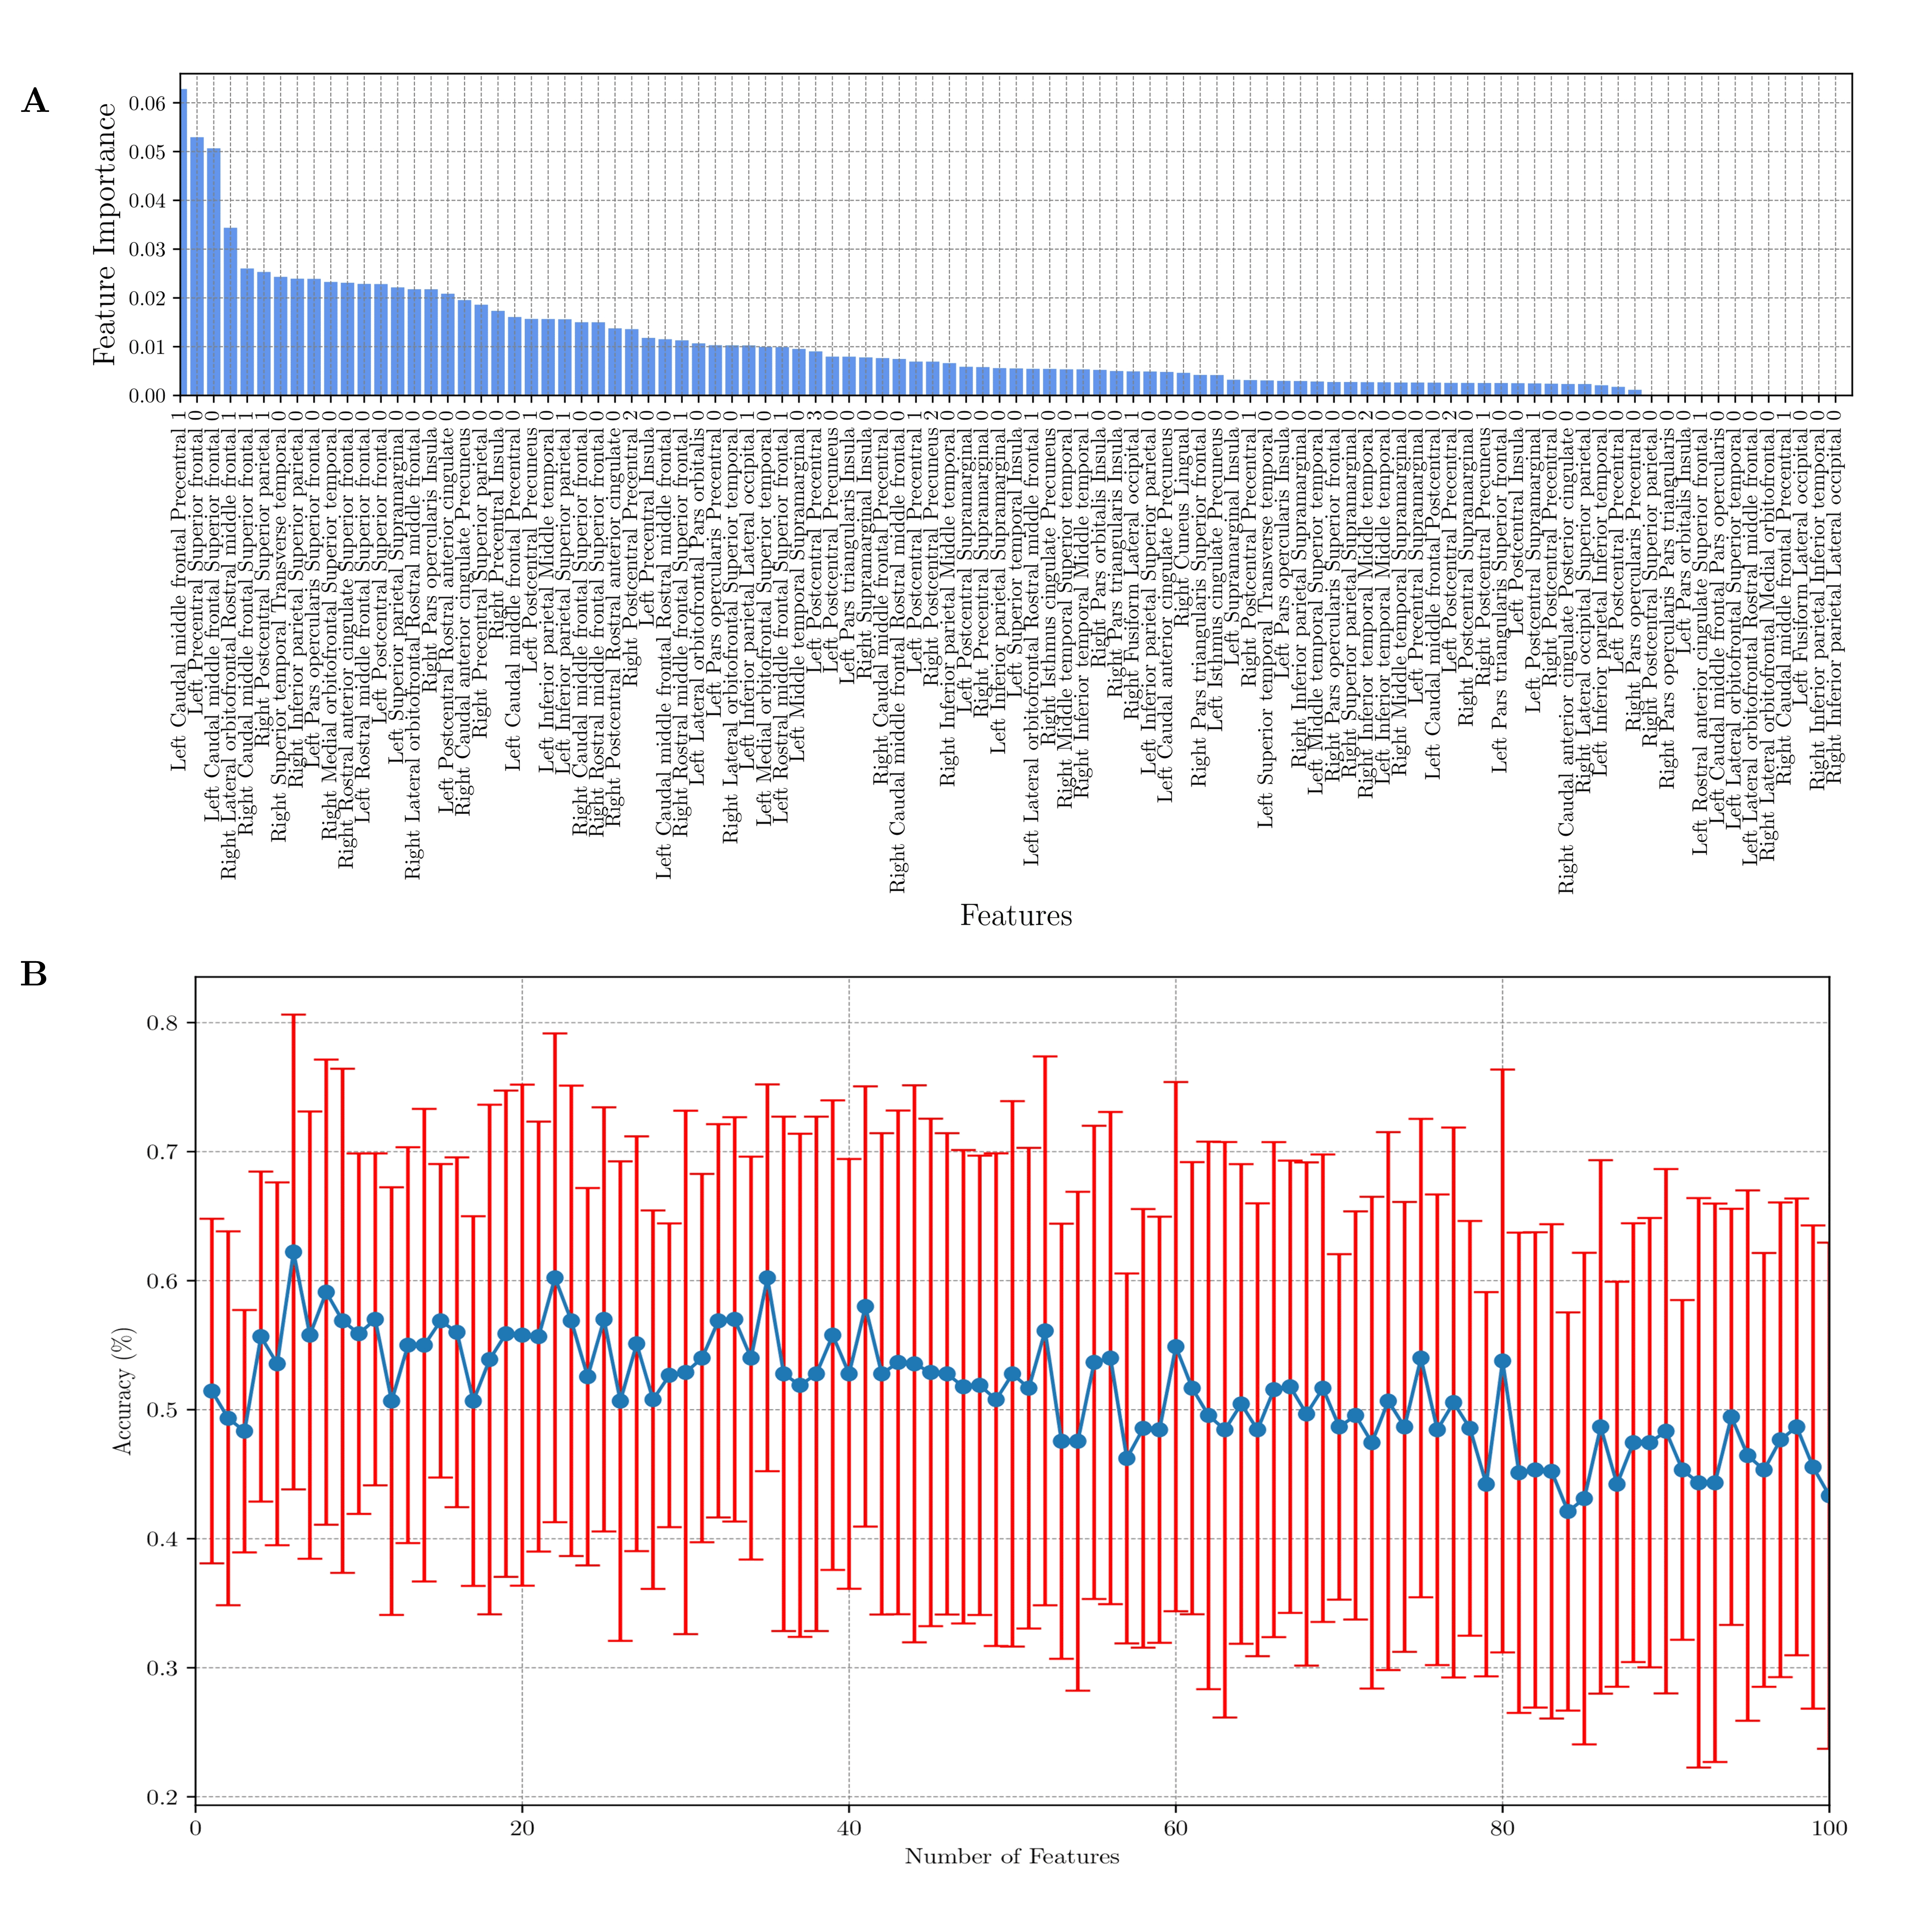
Diffusion-weighted and T1-weighted images were acquired in a 3T MRI scanner (Philips Ingenia, Best, Netherlands) in 35 HC (57% female) and 58 RRMS patients (69% female). The local ethics committee approved the study, and the 2017 McDonald's criteria were used for diagnosis. Table 1 summarizes the demographic data. All preprocessing steps were performed in SPM12. We used the LNAO-SWM79 U-fiber atlas as a mask to obtain the mean FA map to each subject's U-fiber. The preprocessing step was done through an in-house MATLAB toolbox.For the ML model, we used RF as a feature selection and classifier. The RF’s hyperparameters and evaluation of the performance of the classification model were using stratified cross-validation, dividing the data into ten-fold. The RF fine-tuned parameters that minimized the mean absolute error were: max_depth = 6, max_leaf_nodes = 3, min_samples_split = 27, and n_estimatiors = 191. We evaluated feature selection and the RF performance according to the higher score of the model, indicating the number of optimal features.
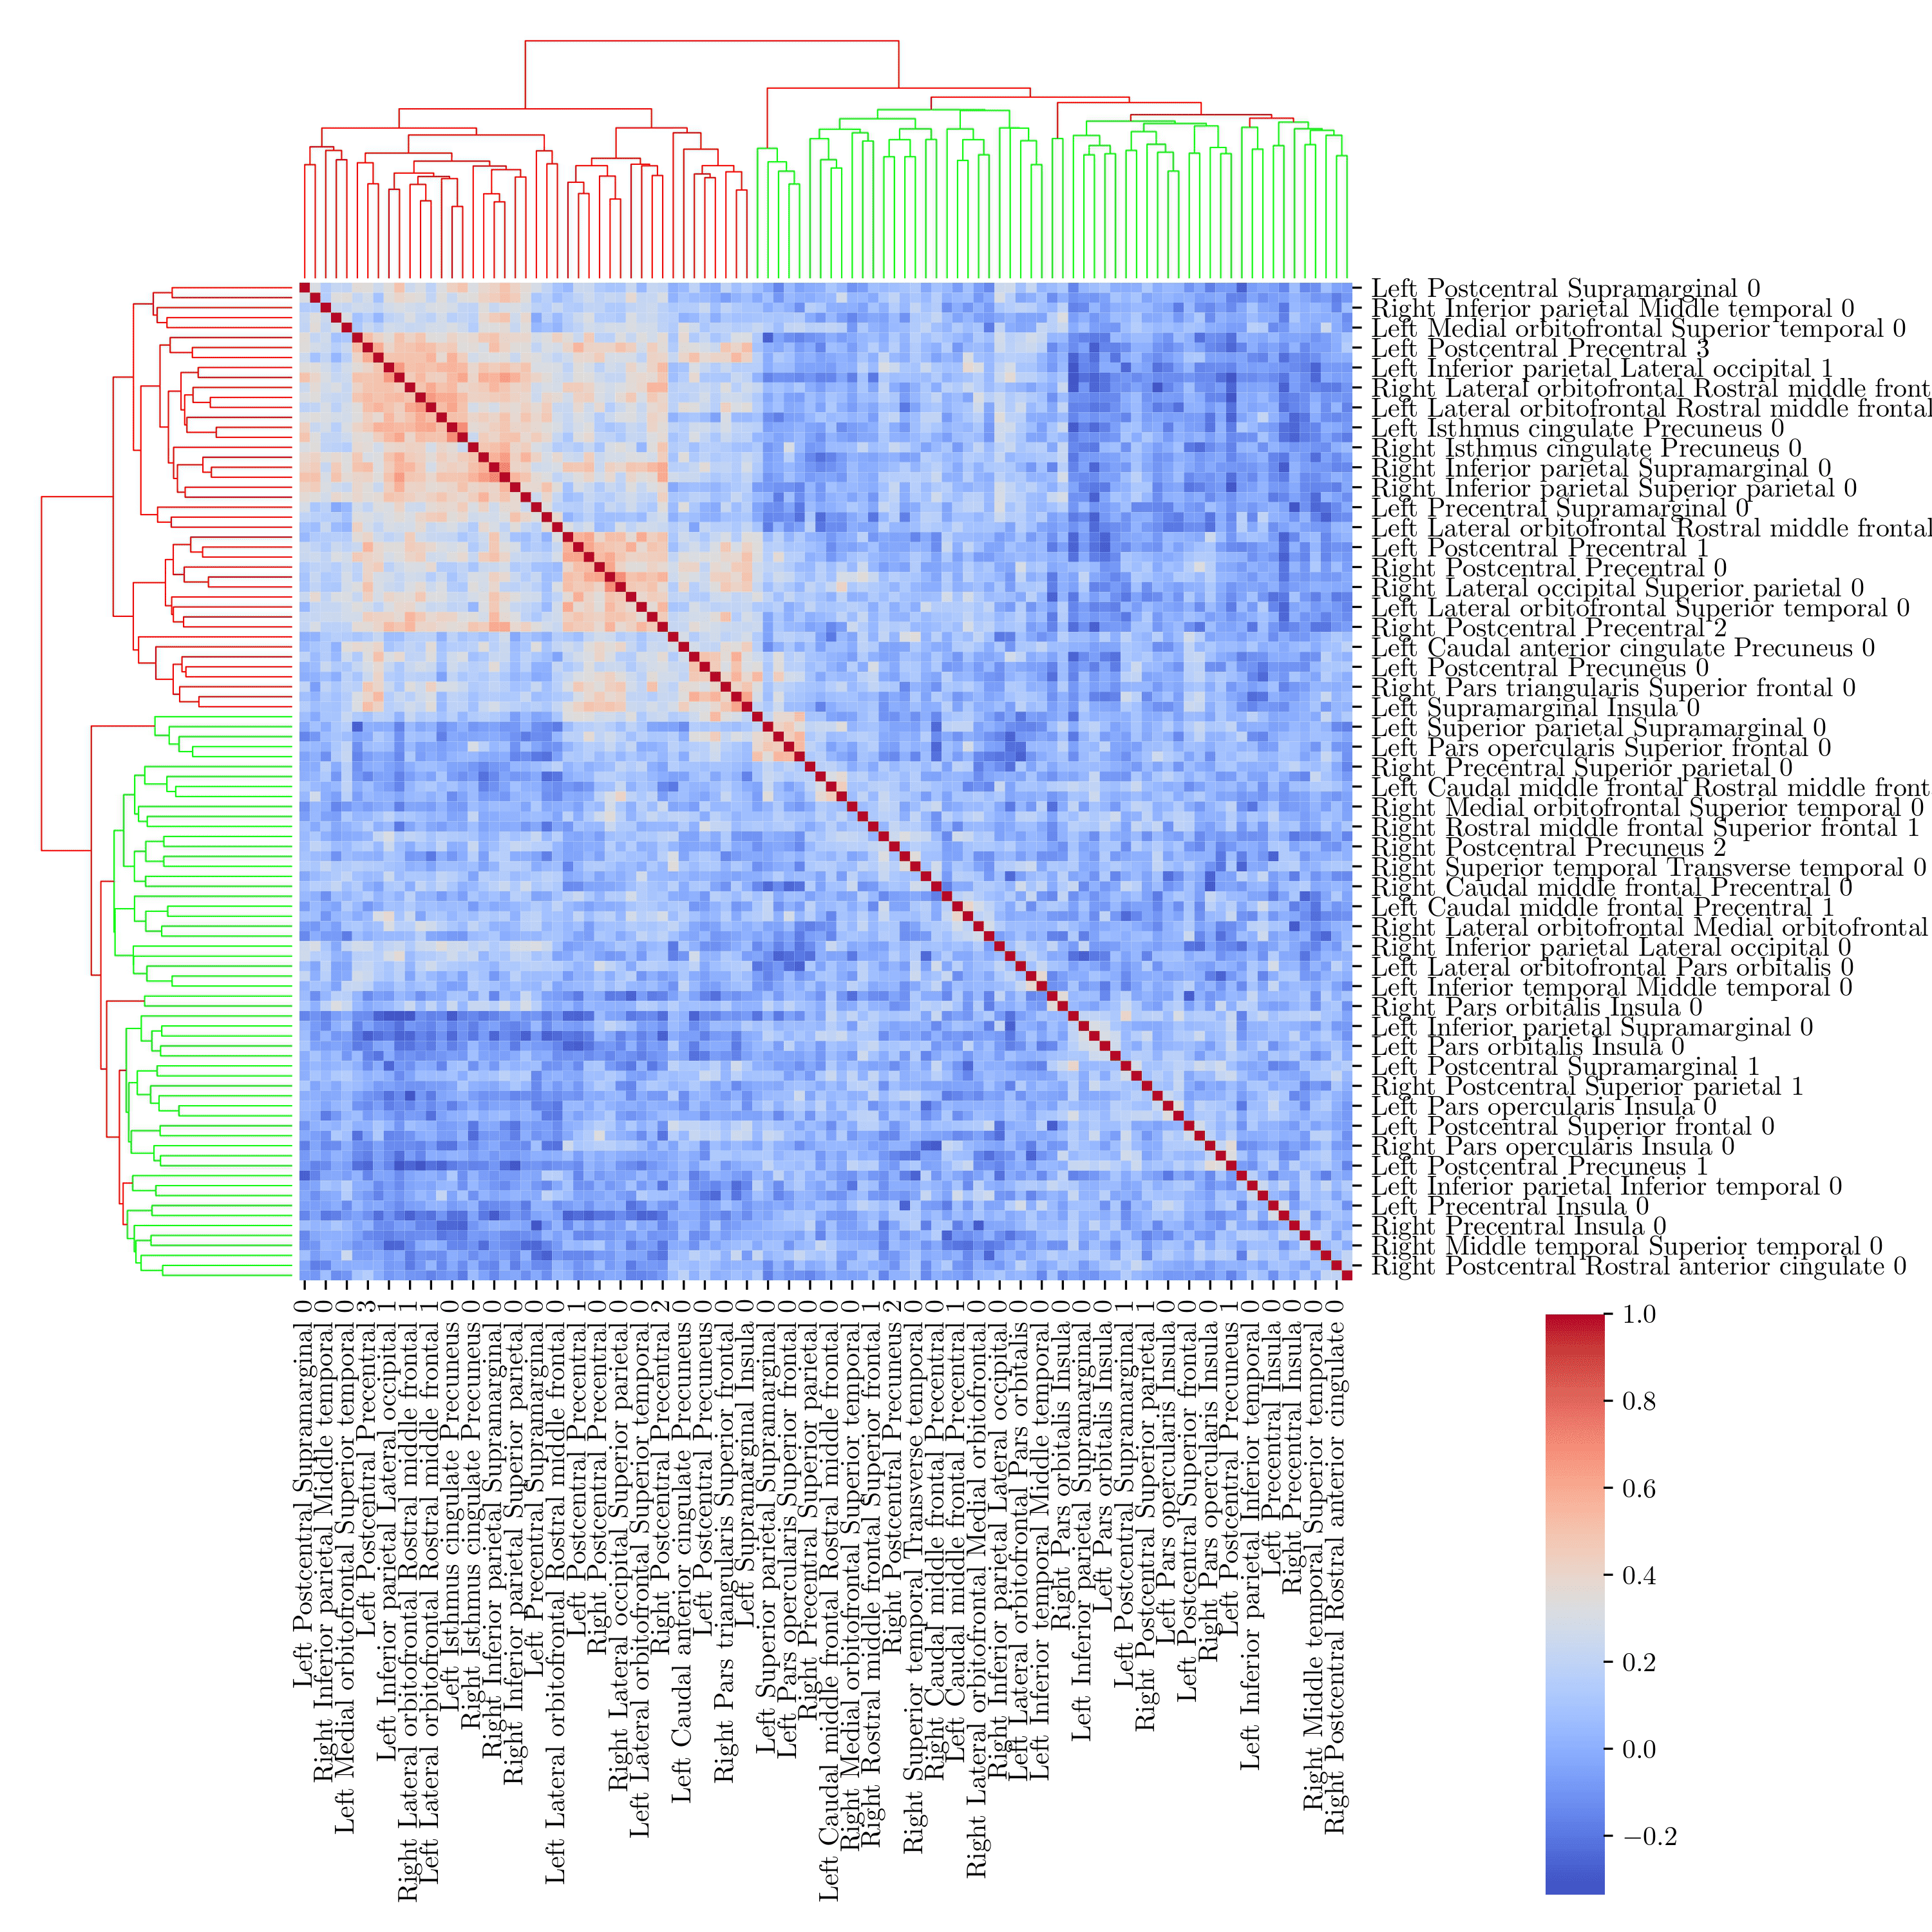
Also, we used TreeSHAP to estimate SHAP-values for our tree-based model. Additionally, the Pearson correlation method was used to calculate the correlation matrix between all the FA parameters. Hierarchical clustering was applied to classify its rows/columns into clusters of similar data families.
The ML model was implemented in Python 3.11.5, using Scikit-learn, Nilearn, and Shap packages.
Results
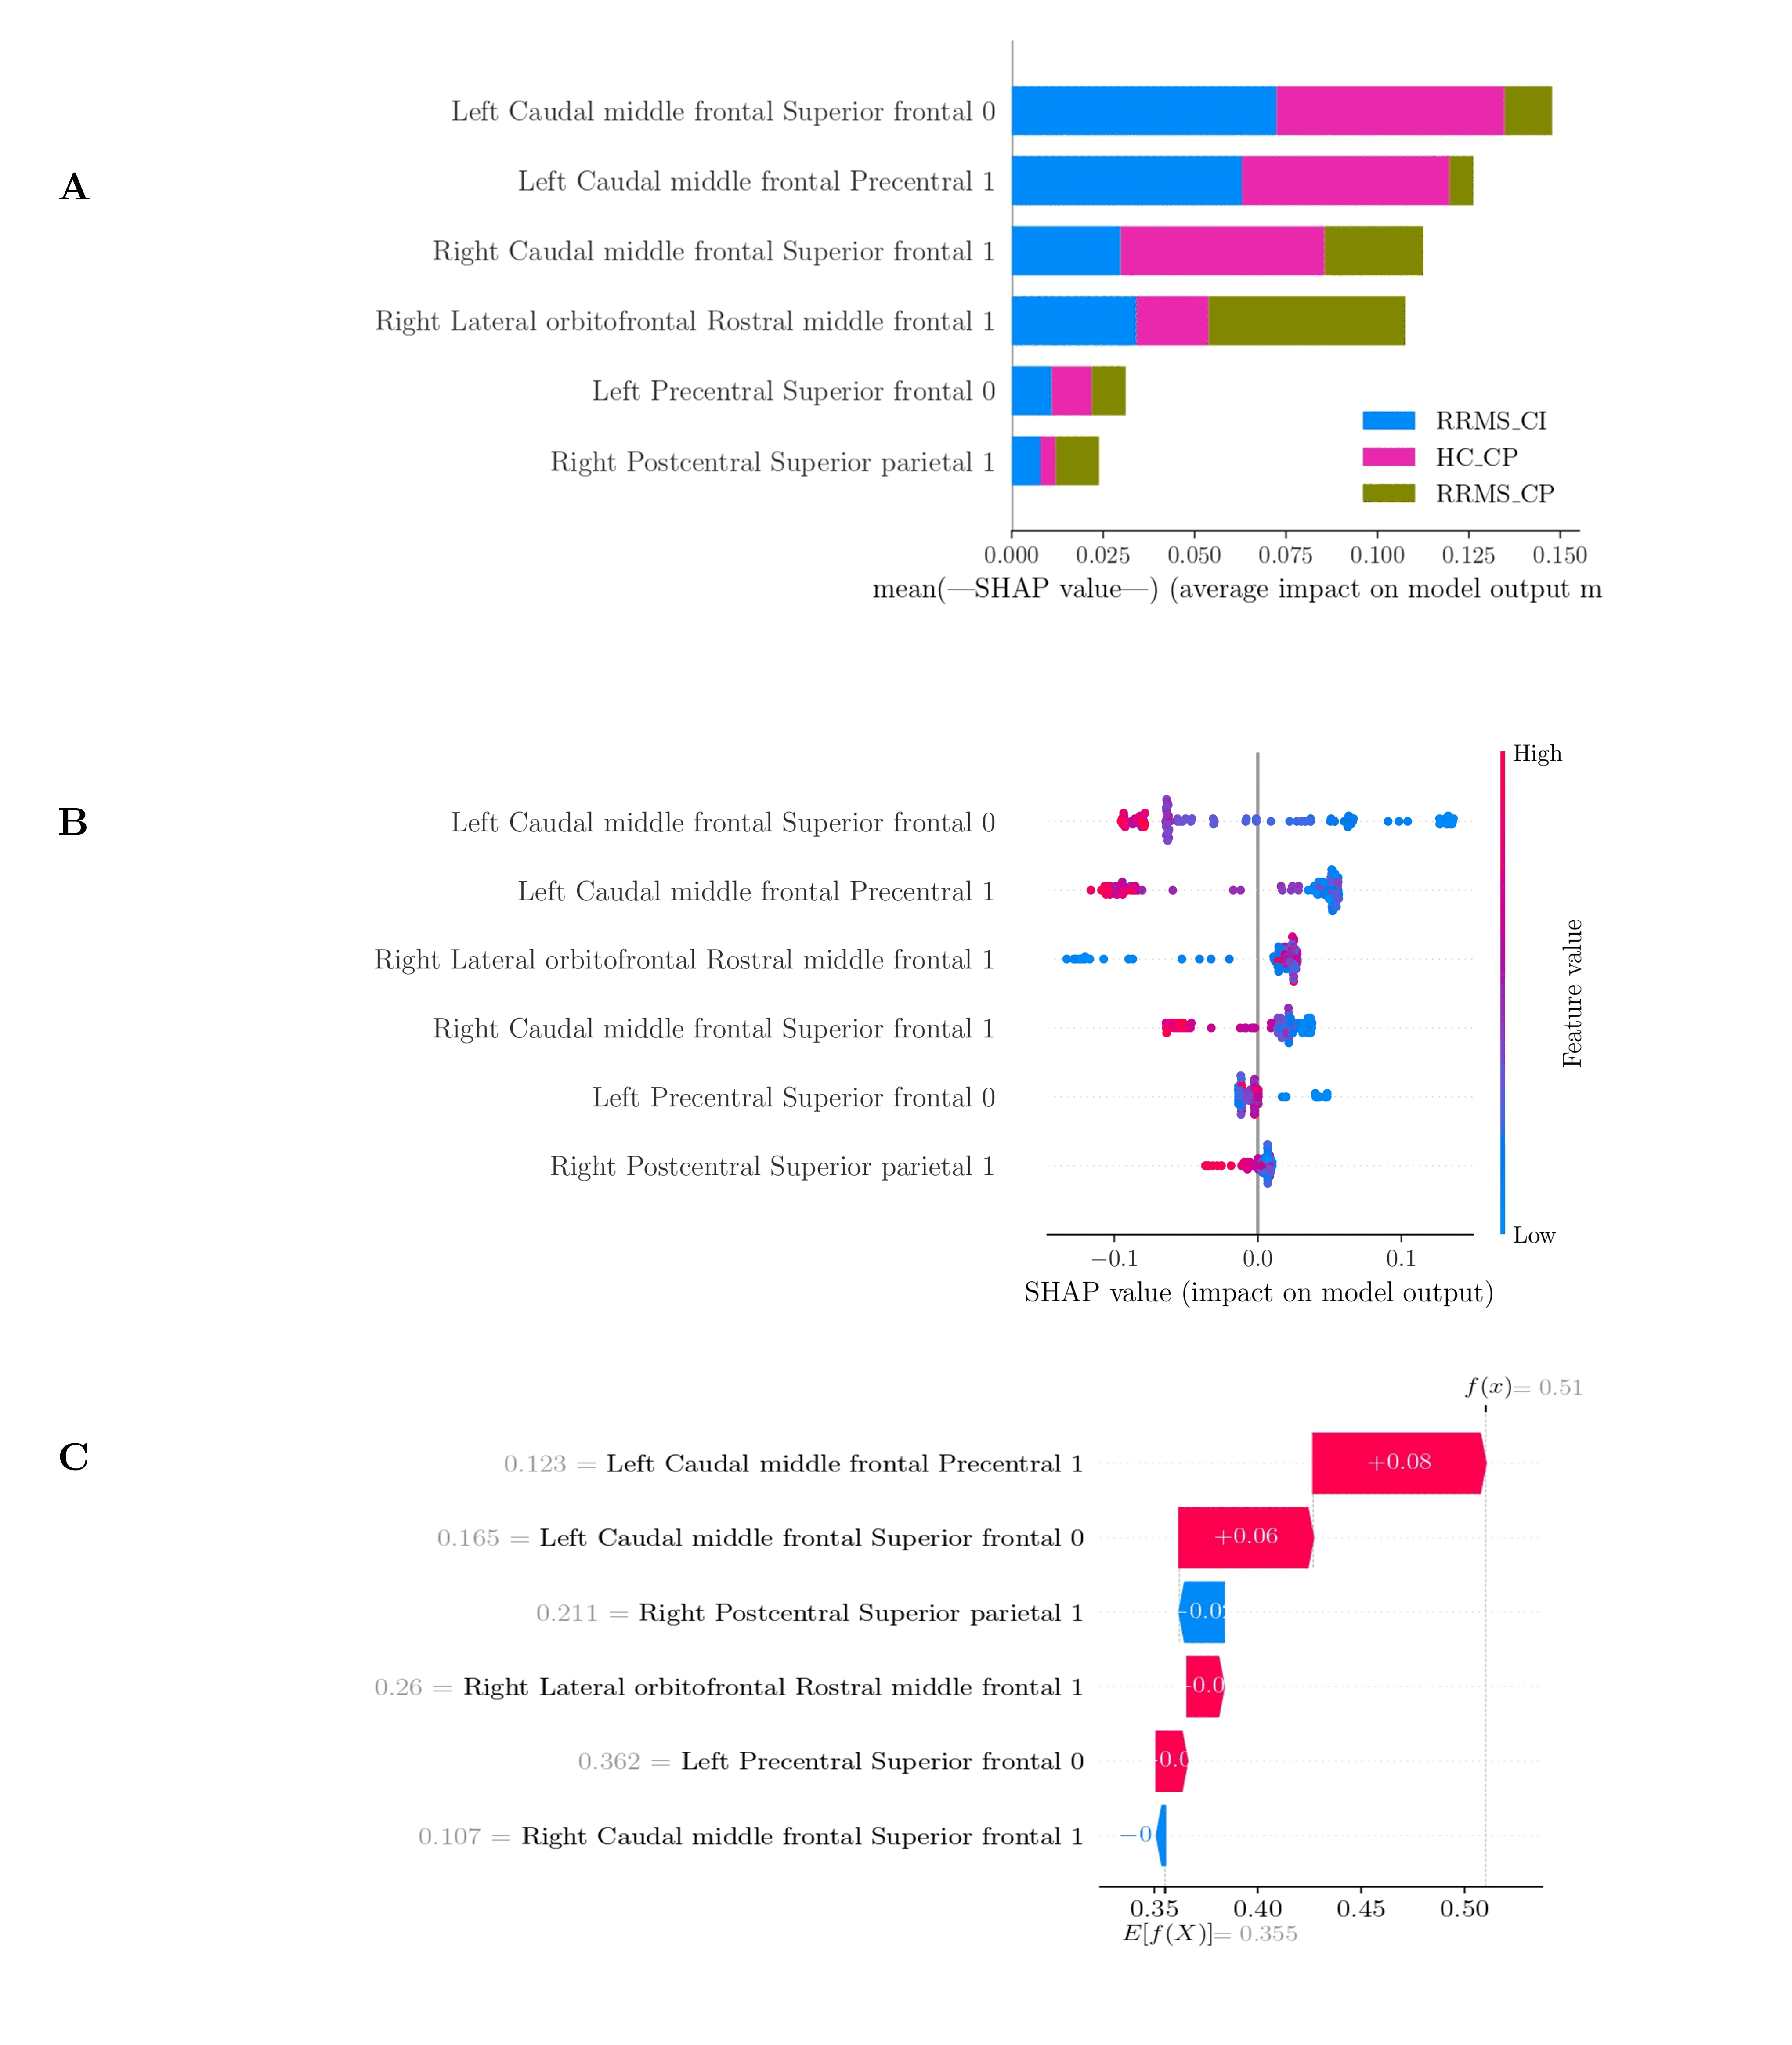
The analysis of the hierarchical clustering (Figure 2) shows that the parameters selected by RF corresponded to two different clusters (right lateral orbitofrontal rostral middle frontal 1 in the red cluster and the other five features selected in the green cluster). We found six FA biomarkers for our classification problem: left caudal middle frontal precental 1, left precental superior frontal 0, left caudal middle frontal superior frontal 0, right lateral orbitofrontal rostral middle frontal 1, right caudal middle frontal superior frontal 1, and right postcentral superior parietal 1. These features maximized the accuracy, obtained: 62.22 ± 17.33 % (precision: 66.89 ± 15.55%, recall: 58.33 ± 18.78%, f1-score: 58.36 ± 20.50%), Figure 3.Figure 4. a, shows the summary plot for multiclass classification. We can see that the RRMS-CI classes hardly used the left caudal middle from superior frontal 0 and precental 1 features. Figure 4.b. shows the summary plot of RRMS-CI class. Figure 4.c shows the waterfall plot that represents the cumulative sum and how the Shapley values are added together to give the model output from the base value. The left caudal middle frontal precentral 1, left caudal middle frontal superior frontal 0, right lateral orbitofrontal rostral middle frontal 1, and left precentral superior frontal 0 contributed to the RRMS-CI. In contrast, the rest of the features contributed to the other classes.
Discussion and Conclusion
Our model classifies with an accuracy of 62.22 ± 17.33 % and finds six FA maps that characterize MS disease, which achieved a similar percentage (12,13). SHAP interpretation analysis found that the caudal middle frontal gyrus significantly contributes to HC-CP and RRMS-CI related to working memory, memory encoding, and retrieval (14). Moreover, the superior frontal gyrus contributes to verbal working memory, episodic memory, and attention (15).SHAP values with major contribution were: Right Lateral orbitofrontal - Rostral middle frontal gyrus, areas which are related to sensorimotor processing, motivation, and fatigue (16). These approaches can provide insights into relevant biomarkers with MRI, with the potential to be incorporated into routine clinical practice.
Acknowledgements
This work has been funded by projects PIA-ACT192064 and ICN2021_004 of the Millennium Science Initiative Program of the National Agency for Research and Development, ANID. The authors also thank the Fondecyt projects 1181057, 1191710 and 1231535 by ANID and PUENTE grant 2022-14 VRI, PUC. RC-C was funded by ANID Fondecyt Postdoctorado 2021 (Nº 3210305).References
1.- Filippi M, Bar-Or A, Piehl F, et al. Multiple sclerosis. Nat Rev Dis Primers. 2018 Nov 8;4(1):43. doi: 10.1038/s41572-018-0041-4. Erratum in: Nat Rev Dis Primers. 2018 Nov 22;4(1):49. PMID: 30410033.
2.- Benedict RHB, Amato MP, DeLuca J, et al. Cognitive impairment in multiple sclerosis: clinical management, MRI, and therapeutic avenues. Lancet Neurol. 2020 Oct;19(10):860-871. doi: 10.1016/S1474-4422(20)30277-5. Epub 2020 Sep 16. PMID: 32949546; PMCID: PMC10011205.
3. Brownell B, Hughes JT. The distribution of plaques in the cerebrum in multiple sclerosis. J Neurol Neurosurg Psychiatry. 1962;25:315–20.
4. Miki Y, Grossman RI, Udupa JK, et al. Isolated U-fiber involvement in MS: preliminary observations. Neurology. 1998;50(5): 1301–6.
5. Lazeron RH, Langdon DW, Filippi M, et al. Neuropsychological impairment in multiple sclerosis patients: the role of (juxta) cortical lesion on FLAIR. Mult Scler. 2000;6(4): 280–5.
6. Bender HA, Cole JR, Aponte-Samalot M, et al. Construct validity of the Neuropsychological Screening Battery for Hispanics (NeSBHIS) in a neurological sample. J Int Neuropsychol Soc. 2009 Mar;15(2):217-24. doi: 10.1017/S1355617709090250. Epub 2009 Feb 12. PMID: 19215638.
7.- Filippi M, Inglese M. Overview of diffusion-weighted magnetic resonance studies in multiple sclerosis. J Neurol Sci 2001;186(suppl 1):S37–43.
8.- Amato MP, Zipoli V, Portaccio E. Cognitive changes in multiple sclerosis. Expert Rev Neurother. 2008 Oct;8(10):1585-96. doi: 10.1586/14737175.8.10.1585. PMID: 18928350.
9.- Klöppel S, Stonnington CM, Chu C, et al. Automatic classification of MR scans in Alzheimer’s disease. Brain 2008;131:681–689.
10.- Wottschel V, Alexander DC, Kwok PP, et al. Predicting outcome in clinically isolated syndrome using machine learning. NeuroImage Clin 2015;7:281–287.
11.- Verikas A, Gelzinis A, Bacauskiene M: Mining data with random forests: a survey and results of new tests. Pattern Recognition 2011, 44(2):330–349.
12.- Delgado-Álvarez A, Matias-Guiu JA, Delgado-Alonso C, et al. Cognitive Processes Underlying Verbal Fluency in Multiple Sclerosis. Front Neurol. 2021 Jan 21;11:629183. doi: 10.3389/fneur.2020.629183. PMID: 33551984; PMCID: PMC7859643.
13.- Buyukturkoglu K, Zeng D, Bharadwaj S, et al. Classifying multiple sclerosis patients on the basis of SDMT performance using machine learning. Mult Scler. 2021 Jan;27(1):107-116. doi: 10.1177/1352458520958362. Epub 2020 Nov 4. PMID: 33146069.
14.- Vitorino R, Hojjat SP, Cantrell CG, et al. Regional Frontal Perfusion Deficits in Relapsing-Remitting Multiple Sclerosis with Cognitive Decline. AJNR Am J Neuroradiol. 2016 Oct;37(10):1800-1807. doi: 10.3174/ajnr.A4824. Epub 2016 May 19. PMID: 27197989; PMCID: PMC5116278.
15.- Li W, Qin W, Liu H, et al. Subregions of the human superior frontal gyrus and their connections. Neuroimage. 2013 Sep;78:46-58. doi: 10.1016/j.neuroimage.2013.04.011. Epub 2013 Apr 13. PMID: 23587692.
16.- Du XF, Liu J, Hua QF, et al. Relapsing-Remitting Multiple Sclerosis Is Associated With Regional Brain Activity Deficits in Motor- and Cognitive-Related Brain Areas. Front Neurol. 2019 Nov 26;10:1136. doi: 10.3389/fneur.2019.01136. PMID: 31849801; PMCID: PMC6901942.
Figures