2956
Identification of 9.4T MRI sequences for enhanced cellular visualisation of Multiple Sclerosis lesions1Translational Imaging in Neurology (ThINk) Basel, Department of Biomedical Engineering, Faculty of Medicine, University Hospital Basel and University of Basel, Basel, Switzerland, 2Department of Neurology, University Hospital Basel, Basel, Switzerland, 3Research Center for Clinical Neuroimmunology and Neuroscience Basel (RC2NB), University Hospital Basel and University of Basel, Basel, Switzerland, 4Institute of Neuropathology, University Medical Center, Göttingen, Germany, 5Department of Health Sciences, University of Genova, Genova, Italy, 6Division of Medical Physics, Department of Diagnostic and Interventional Radiology, University Medical Center Freiburg, Faculty of Medicine, University of Freiburg, Freiburg, Germany, 7Division of Radiological Physics, Department of Radiology, University Hospital Basel, Basel, Switzerland
Synopsis
Keywords: Multiple Sclerosis, High-Field MRI, 9.4T MRI, Multi-Gradient-Echo, Multi-Spin-Echo, FLASH, RARE, Post-mortem, Histopathological images, Histochemical staining, Lesion features, Microglia
Motivation: Accurately analyzing cell presence in multiple sclerosis (MS) lesions via magnetic resonance imaging (MRI) cannot be achieved without histopathological validation.
Goal(s): Identification of biomarkers in MRI responsible for capturing microstructural alterations in brain tissues.
Approach: Investigation of relations in the ratio between lesion and normal-appearing white matter (NAWM) in voxel values of postmortem 9.4 T MRI scans and in cell density values of histochemical images of three MS lesions.
Results: We identified effective MRI sequences enhancing the contrast between the different features of the lesions and the NAWM and linked them to different cell type presence, as detected via quantitative histochemical analysis.
Impact: The establishment of a robust connection between MRI data and histochemical features will improve our understanding of the MS lesions development and its impact on the brain microstructure.
Introduction
An accurate analysis of cell presence in multiple sclerosis (MS) lesions via magnetic resonance imaging (MRI) cannot yet be achieved.The aim of this study was to investigate possible relations between the voxel values in postmortem 9.4 T MRI scans and the cell density in histochemical images of diseased human brain blocks. We analyzed the sensitivity of different MRI sequences to specific features of MS lesions to identify the sequences that enhanced the contrast between MS lesions and normal brain tissue.
Methods
Potential region of interest (ROIs) containing focal abnormalities in the white matter were first identified based on 3T MRI of the whole post-mortem brain, as described by Galbusera et al [1] and then dissected.Images of each tissue block were acquired with a Bruker Avance Neo 400 spectrometer (9.4 Tesla) with gradient insert (max. amplitude 1.5 T/m) and a 25mm quadrature birdcage coil using the following sequences: T2*-weighted inversion recovery Multi-Gradient-Echo (MGE), voxel-size = [0.13x0.13x0.4]mm3, TR = 1500ms, TE = [1.7,3.6,5.5,7.4,9.3,11.2,13.1,15.0169,18.8,20.7,22.6,24.5,26.4]ms, TI = [50,150,300,500,750,1050,1400]ms; T2-weighted inversion recovery Multi-Spin-Echo (MSME), voxel-size = [0.13x0.13x0.4]mm3, TR = 1500ms, TE = [5.3,10.6,15.9,21.2,26.5,31.8,37.1,42.4,47.7,53.0,58.3]ms, TI = [0,50,150, 300,500,750,1050,1400]ms; inversion recovery FLASH, voxel-size = [0.07x0.07x0.13]mm3, TR = 1500ms, TE = 3.8ms, TI = 270ms; RARE, voxel-size = [0.13x0.13x0.4]mm3, TR = 200ms, TE = 12ms, echo spacing 6ms, RARE factor 5.
After the acquisition, blocks were embedded in paraffin and slices of 4μm thickness were stained for myelin (anti-MBP), macrophage/microglia (anti-CR3/43) and nuclei by standard immunohistochemical DAB/Fast Blue staining. The sections were then scanned by a microscope with a 20-objective magnification [1].
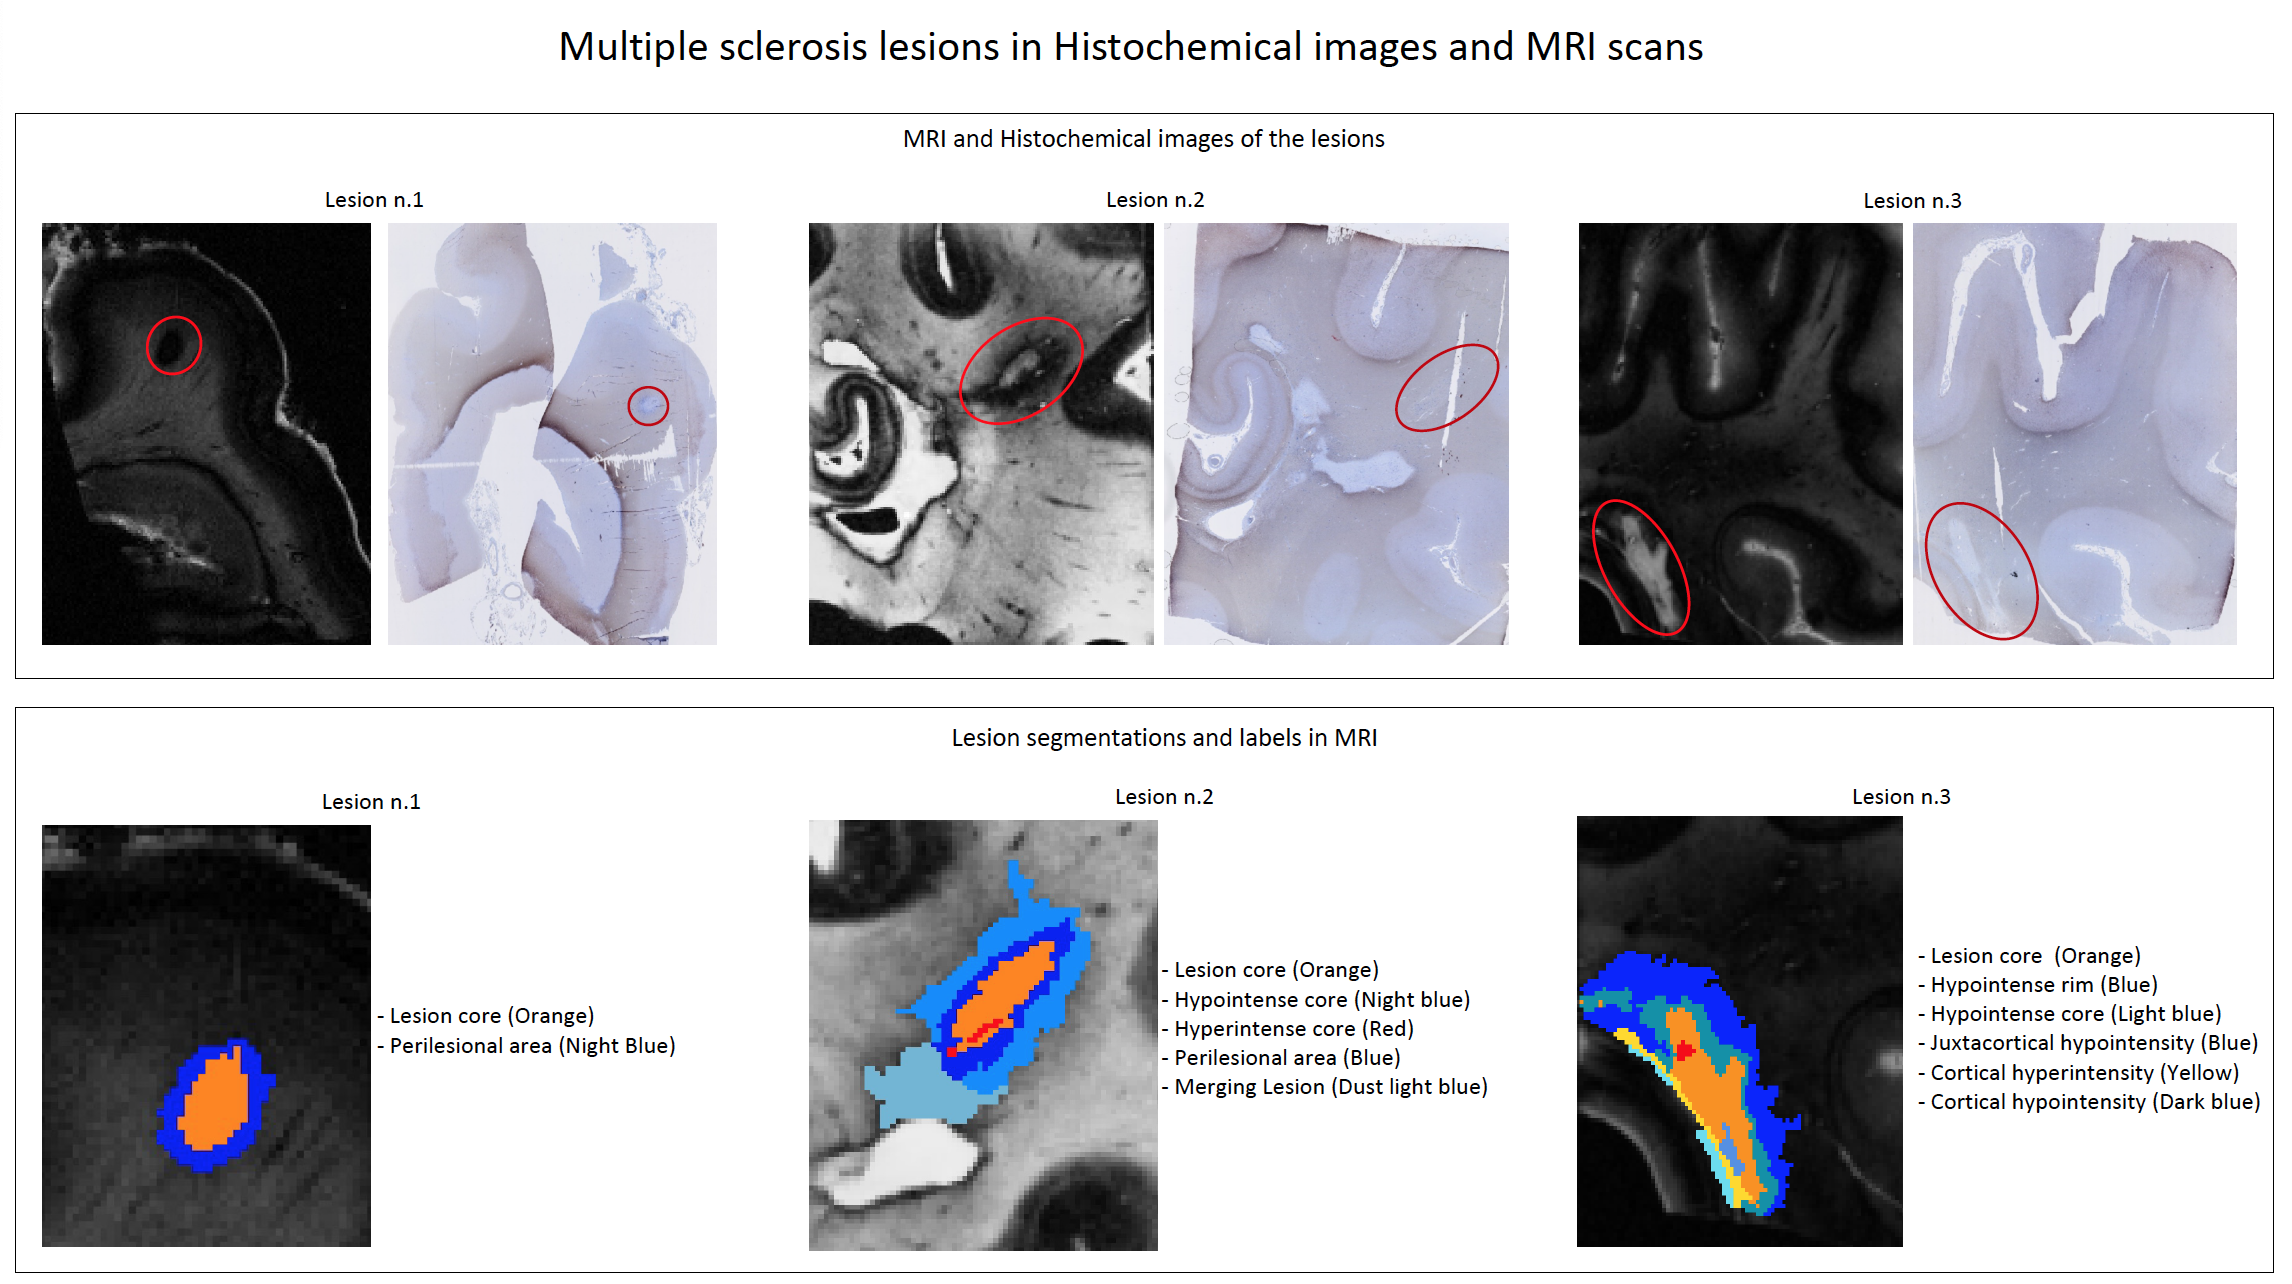
Lesion classification was performed according to the recently revised classification system [2]. Included blocks contained the following lesion types: (1) chronic active white matter lesion; (2) remyelinated white matter lesion with active microglia; (3) subcortical inactive lesion (Figure 1).
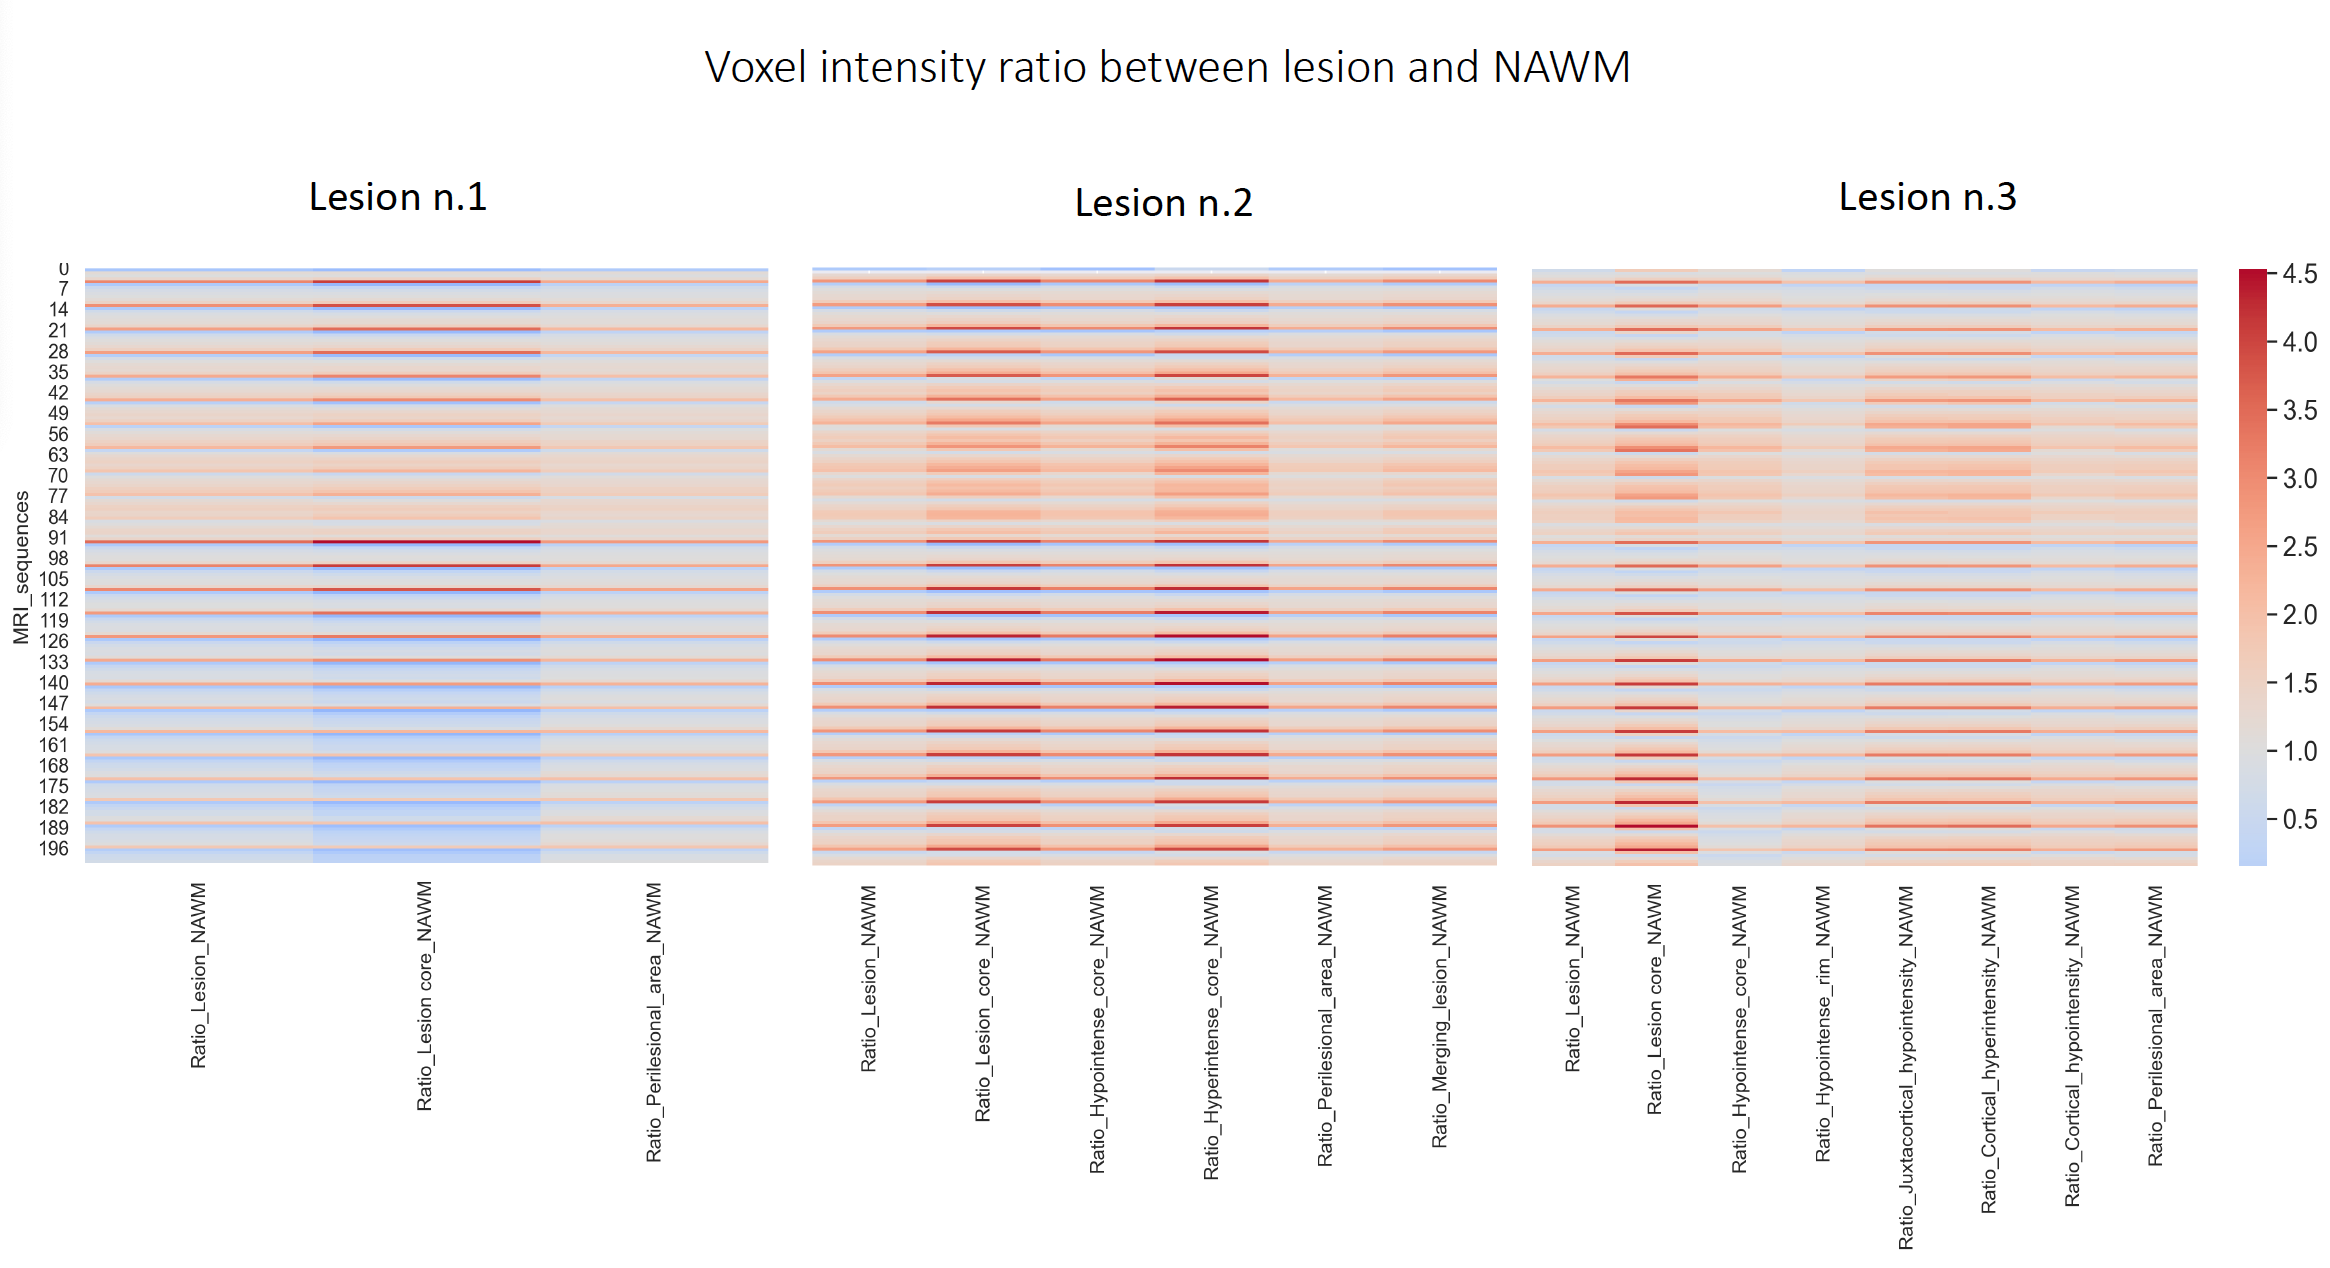
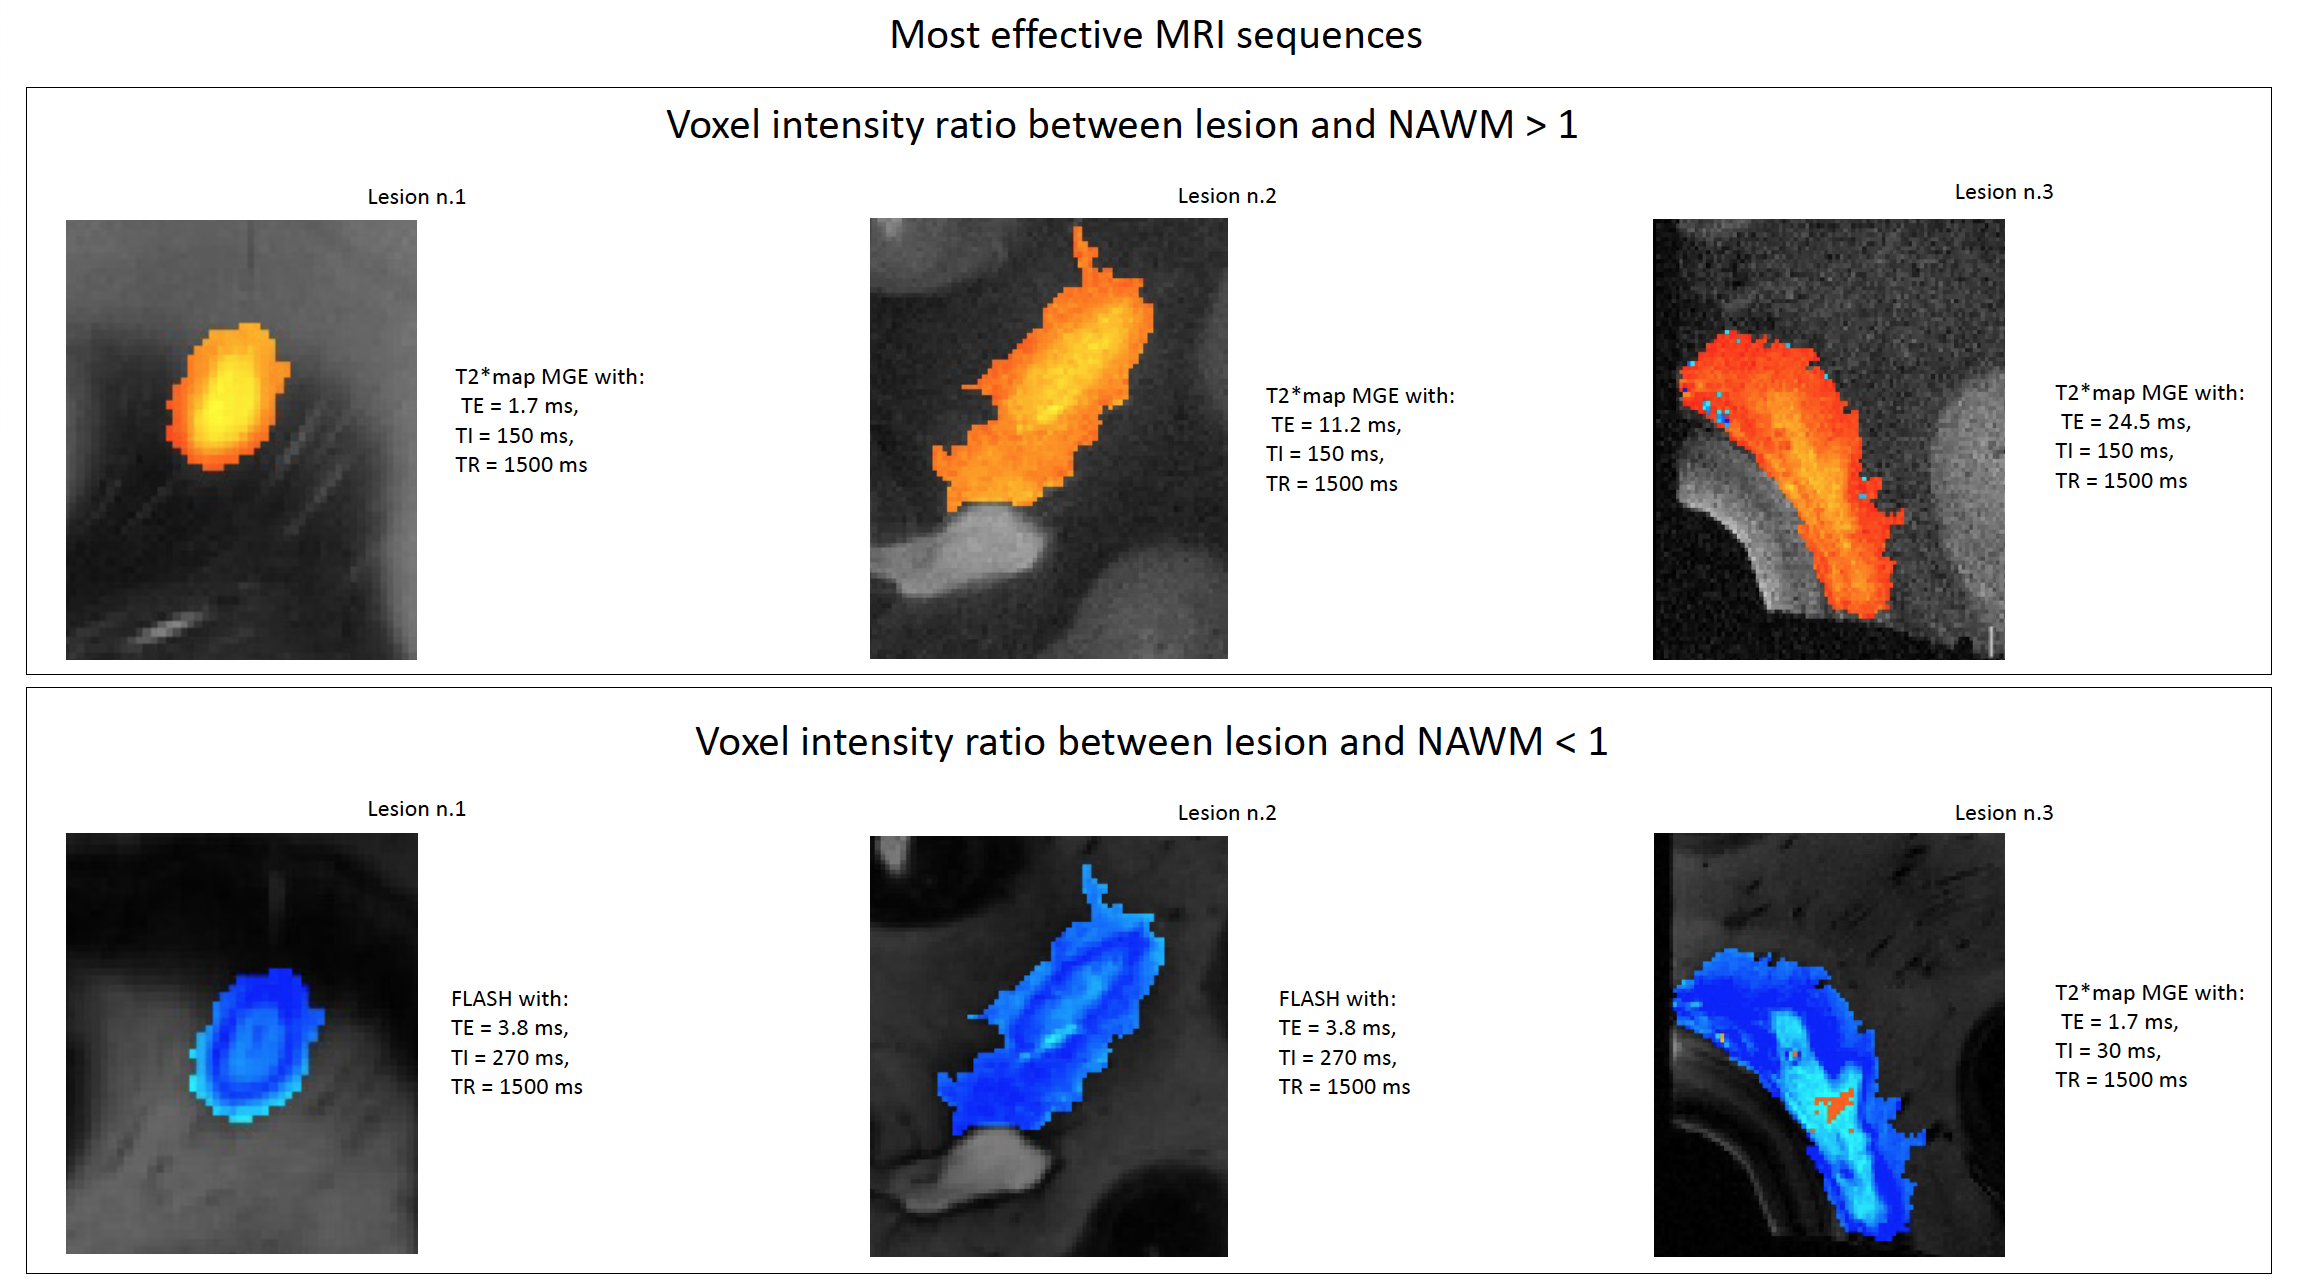
We analyzed the MRI scans by firstly segmenting different features of the MS lesions and the normal-appearing white matter (NAWM) on ITKsnap 4.0.2 [3] using the histochemical image as reference and a threshold based on the image grayscale histogram to define the different ROIs (Figure 1). We proceeded to compute the average intensity value for each ROI of the lesion and for the NAWM in every MRI scan; we then evaluated the ratio between them (lesion/NAWM) to find where it was >1 or <1 (Figure 2) and we selected the MRI scans with the most contrast between the lesion and the NAWM (Figure 3).
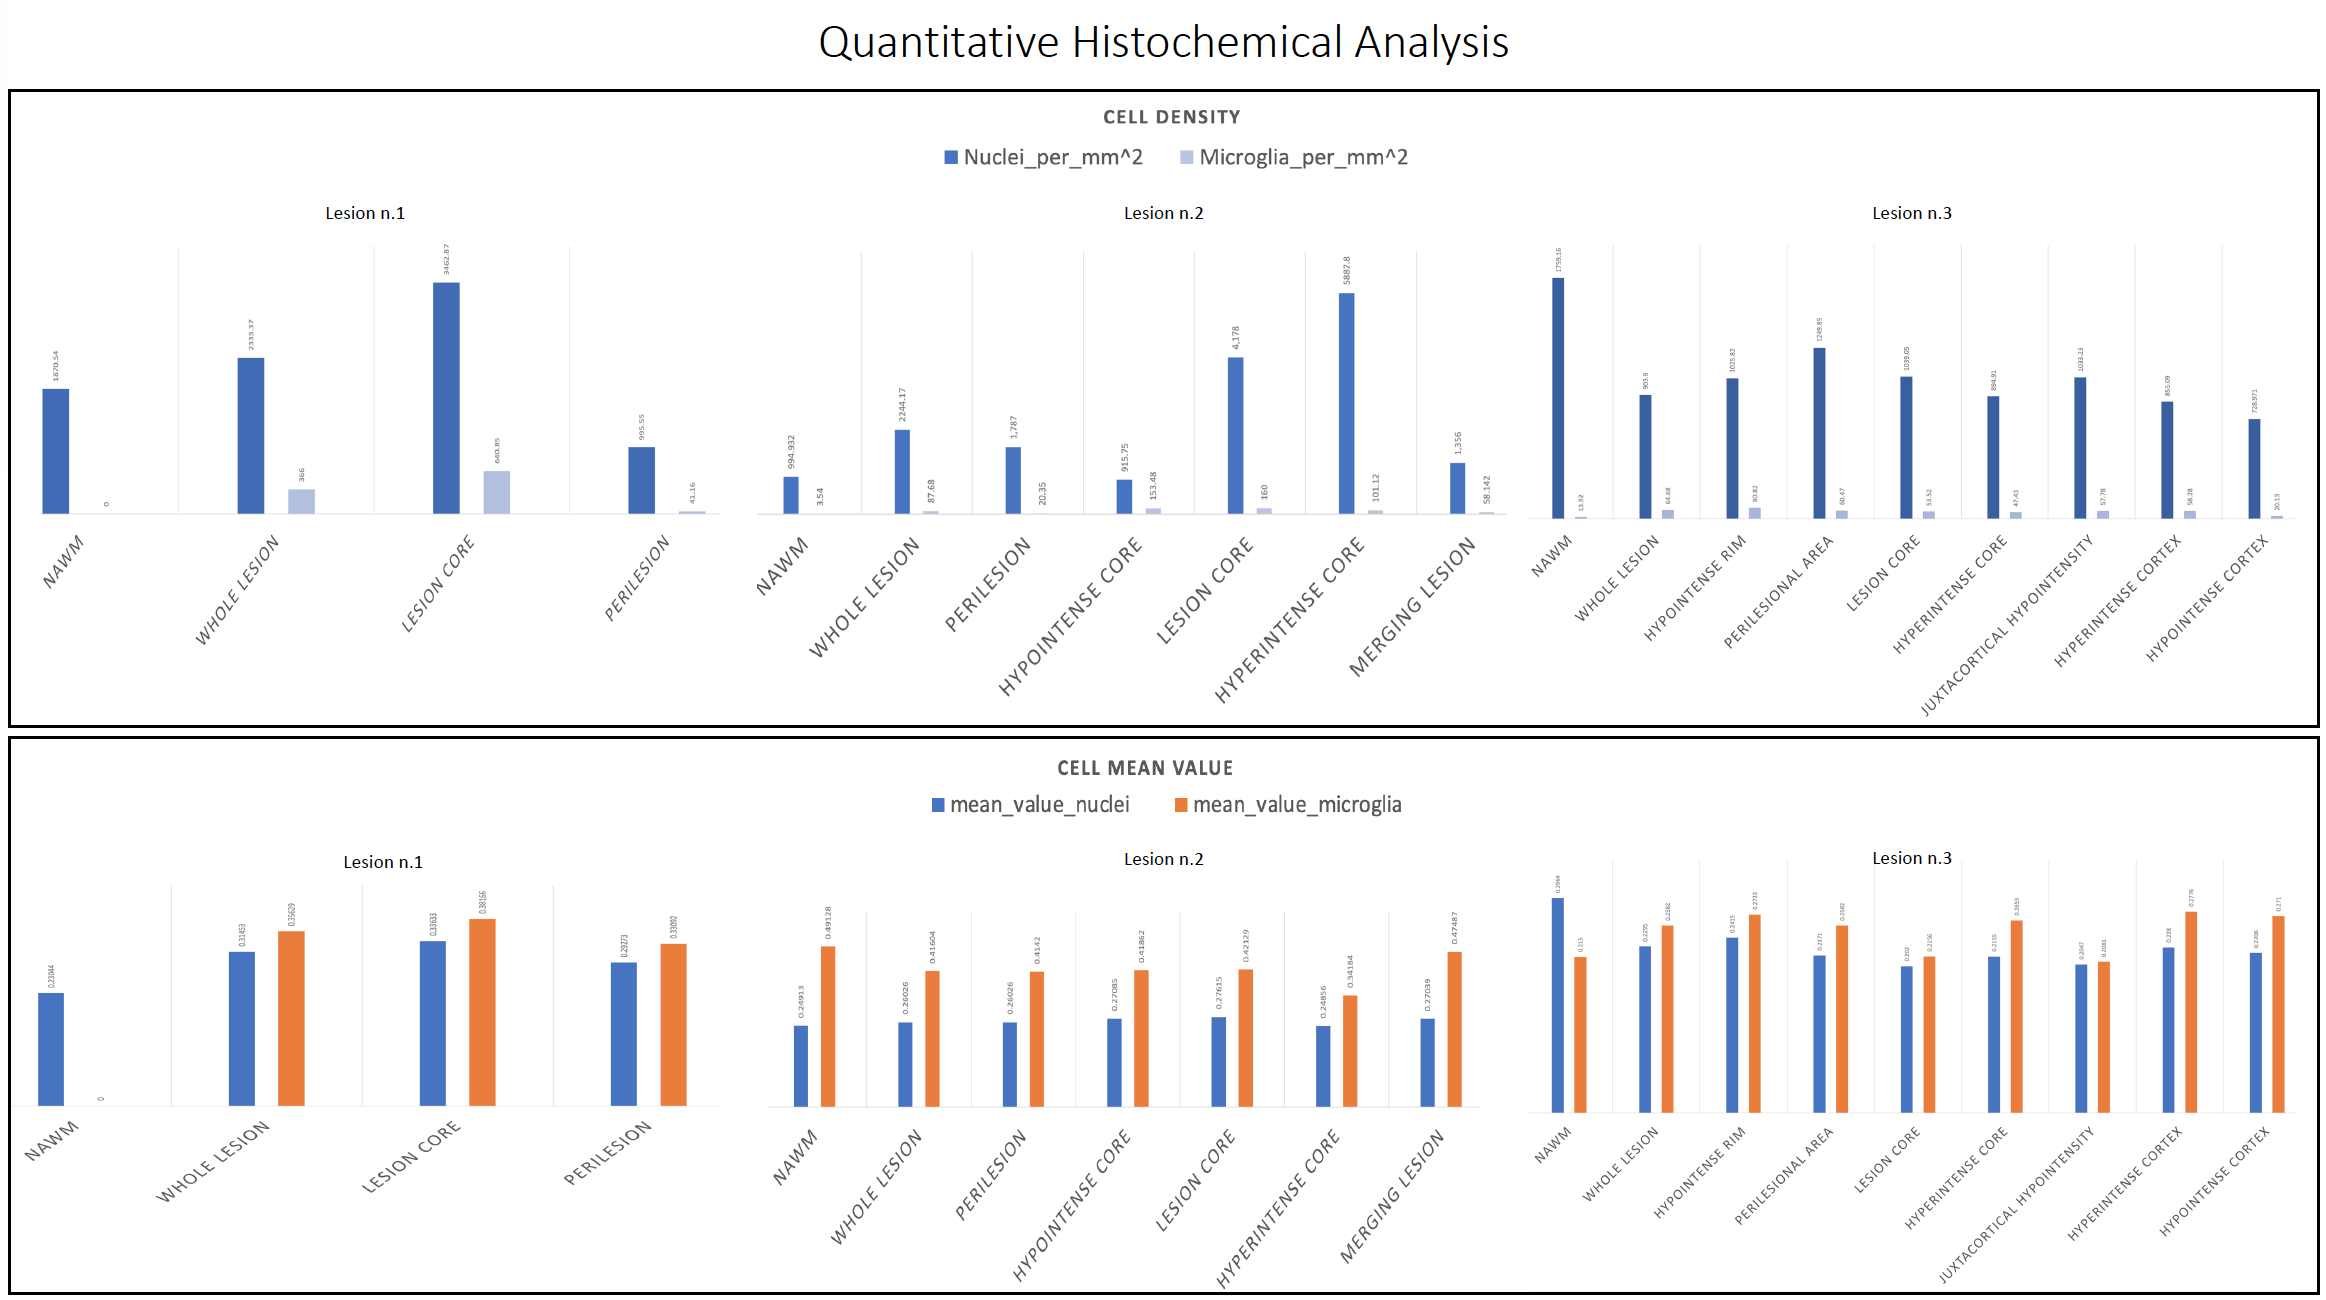
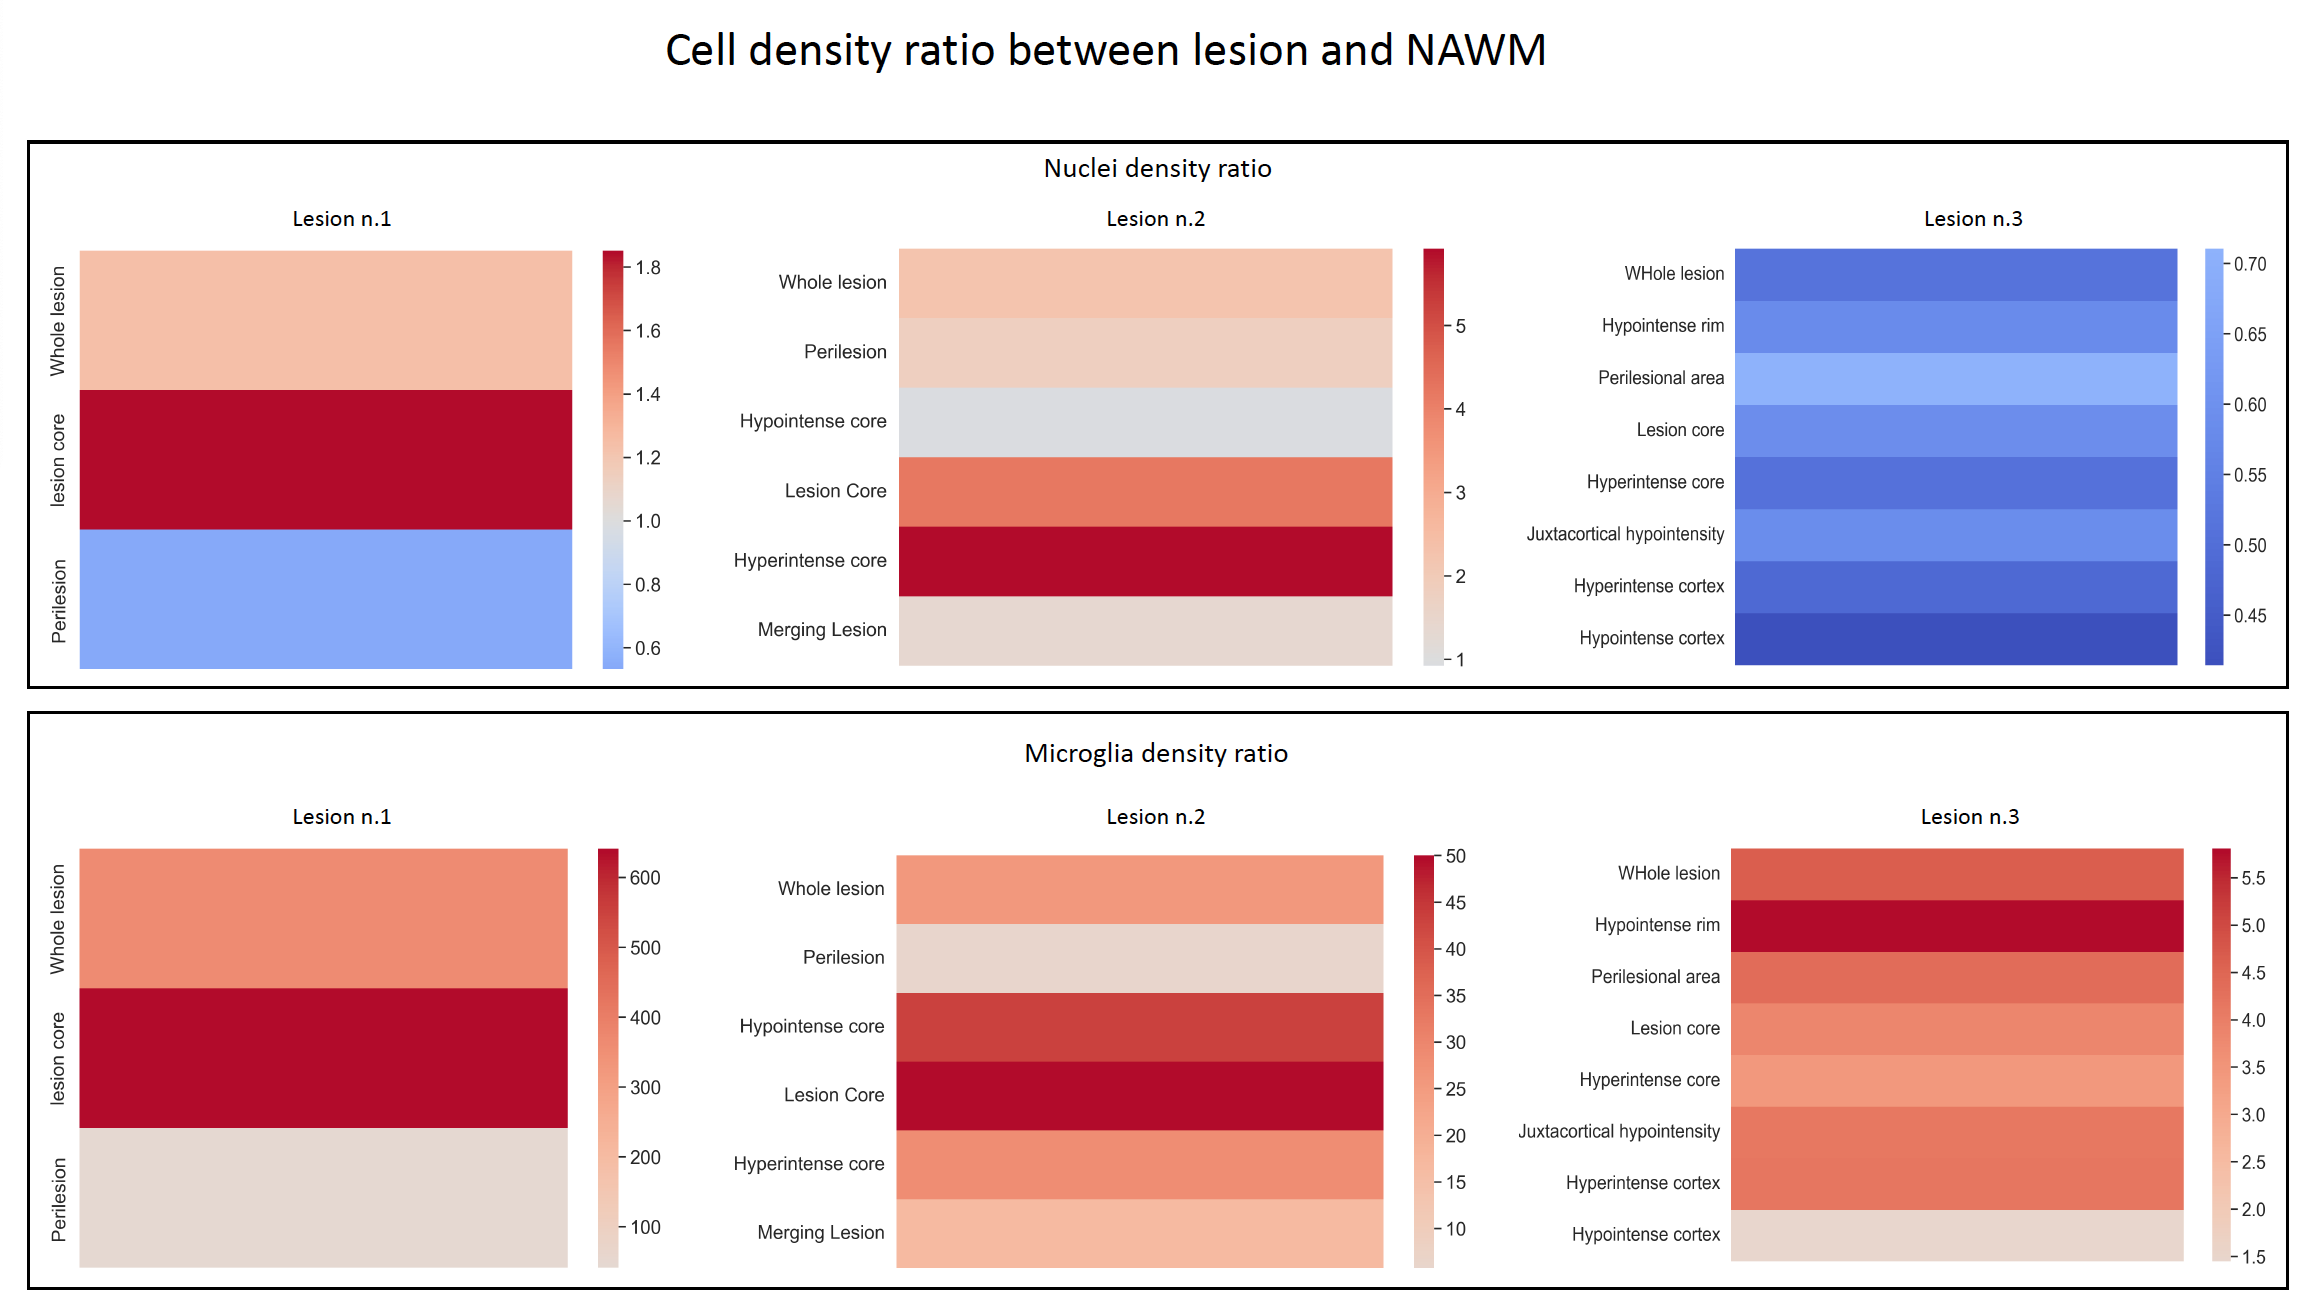
The quantification of the histochemical and immunohistochemical staining was performed on QuPath 0.4.4 [4]. We segmented ROIs similar to those in the MRI (Figure1) and used the cell detection feature with Hematoxylin threshold equal to 0.1, for the nuclei, and to 0.4, for the microglia. For each ROI, we extracted the cell density and the mean cell value and we computed the ratio between lesion and NAWM density values (Figure 4,5).
Results
The sequence parameters and the respective images of the most effective MRI sequences, identified as the ones with the highest or lowest ratio between lesion and NAWM mean values, are shown in Figure 2 and 3.The results of quantitative analysis of the histochemical images are shown in Figure 4 and 5. It needs to be noted that the NAWM segmented in the image of the third block was remarkably darker compared to the one for the other two.
Discussion
Although different best MRI parameters were derived for each lesions, we can state some similarities between them: the best scans for the ratio>1 were all T2*map inversion recovery MGE sequences with TI=150ms; whereas, for the ratio<1, the best scan for lesion 1 and 2 was the sequence FLASH with TE=3.8ms, TI=270ms, TR=1500ms.Considering the images of the ratio between the mean values of lesion and NAWM shown in Figure 3, we observed that the ones with ratio<1 display the lesion rim better and, interestingly, this section in the MRI scans relates to the ROIs with the lower density of cells nuclei but higher density of microglia compared to the NAWM and the rest of the lesion; the images where the ratio>1, instead, display the lesion core better and, in this case, this section in the MRI scans relates to the ROIs with the highest density of cells nuclei compared to the NAWM.
Conclusion
Our analysis lead to the selection of MRI sequences able to discern features in MS lesions and to the detection of a relationship with the cell density ratio derived from histochemical images. Future research will include segmenting other lesions and performing a more detailed examination of the cell type presence.Acknowledgements
No acknowledgement found.References
[1] Galbusera, R, Bahn, E, Weigel, M, Schaedelin, S, Franz, J, Lu, P-J, et al. Postmortem quantitative MRI disentangles histological lesion types in multiple sclerosis. Brain Pathology. 2023; 33(6):e13136. https://doi.org/10.1111/bpa.13136
[2] Kuhlmann T, Ludwin S, Prat A, Antel J, Brück W, Lassmann H. An updated histological classification system for multiple sclerosis lesions. Acta Neuropathol. 2017 Jan;133(1):13-24. doi: 10.1007/s00401-016-1653-y. Epub 2016 Dec 17. PMID: 27988845.
[3] Paul A. Yushkevich, Joseph Piven, Heather Cody Hazlett, Rachel Gimpel Smith, Sean Ho, James C. Gee, and Guido Gerig. User-guided 3D active contour segmentation of anatomical structures: Significantly improved efficiency and reliability. Neuroimage 2006 Jul 1;31(3):1116-28.
[4] Bankhead, P., Loughrey, M.B., Fernández, J.A. et al. QuPath: Open source software for digital pathology image analysis. Sci Rep 7, 16878 (2017). https://doi.org/10.1038/s41598-017-17204-5
Figures