2953
Disease-modifying therapies and the longitudinal improvement of the thalamocortical white matter network in people with multiple sclerosis1School of Biomedical Sciences and Pharmacy, College of Health, Medicine and Wellbeing, University of Newcastle, Callaghan, Australia, 2Hunter Medical Research Institute, New Lambton Heights, Australia, 3King Fahd University Hospital, Imam Abdulrahman Bin Faisal University, Dammam, Saudi Arabia, 4School of Health Sciences, College of Health, Medicine and Wellbeing, University of Newcastle, Callaghan, Australia, 5College of Applied Medical Sciences, University of Jeddah, Jeddah, Saudi Arabia, 6Department of Neurology, John Hunter Hospital, New Lambton Heights, Australia, 7School of Medicine and Public Health, College of Health, Medicine and Wellbeing, University of Newcastle, Callaghan, Australia
Synopsis
Keywords: Multiple Sclerosis, Multiple Sclerosis
Motivation: Relapse-remitting multiple sclerosis (RRMS) induces widespread changes in white matter (WM), affecting crucial functions. This novel longitudinal study investigates these alterations using advanced MRI, potentiating improved diagnosis and treatment.
Goal(s): To investigate differences in WM microstructure on a network level between RRMS and healthy controls (HCs) over two years.
Approach: Advanced MRI (diffusion-weighted imaging and tractography) was used in a network-based analysis of WM tracts, comparing RRMS to HCs.
Results: Our findings reveal widespread WM disparities in RRMS. We identified network differences between RRMS and HCs, offering valuable insights into RRMS pathophysiology and potential remyelination during disease-modifying treatments.
Impact: This novel study reveals widespread white matter differences in relapse-remitting multiple sclerosis (RRMS) patients, providing crucial insights into RRMS pathophysiology. It highlights potential remyelination during treatment, offering promise for improved diagnosis and therapy.
Introduction
People with relapse-remitting MS (pw-RRMS) experience significant and widespread changes in the density and organization of axons and myelin 1,2. Tractography is an advanced imaging technique that can detect alterations in the organisation and density of white matter (WM) 3,4 pathways and improve our understanding of brain connectivity patterns. To overcome deconvolution method (Orientation Distribution Functions) issues such as a high rate of false positives 5, network-based statistics (NBS) identify connected components of a graph (e.g., a connectome) above a predefined threshold6,7 to reflect the heterogeneous nature of MS pathophysiology. NBS offers greater statistical power through cluster enhancement, a method of clustering p-values in a certain neighbourhood 8. We hypothesised that pw-RRMS have an altered network that can be determined using NBS, a consequence of lower fibre densities in these connections compared to healthy controls (HCs). In this study, we combined diffusion-weighted imaging and tractography with a network-based approach to investigate the difference in the WM microstructure on a network level between a cohort of clinically stable treated pw-RRMS and matched HCs over two years. This is the first longitudinal study to analyse network tractography in pw-RRMS, potentially providing lesion-agnostic and region-specific biomarkers for prognosis and understanding of MS pathophysiology.
Methods and Materials
Structural and diffusion-weighted magnetic resonance imaging (dMRI) scans were acquired from a cohort of 76 clinically stable treated pw-RRMS and 43 age- and sex-matched healthy controls (HCs) at baseline (BL) and two-year follow-up (2-YFU). The pw-RRMS group had a mean age of 43.4±11.1 years and included 29 on beta-interferon/glatiramer acetate (b-INF/GA), 35 on fingolimod, and 12 on dimethyl-fumarate (DMF). The HCs had a mean age of 40.8±11.5 years. All MRI/dMRI scans were undertaken on a 3T (Prisma, Siemens) MRI scanner equipped with a 64-channel coil.Structural imaging using 3D T1-MPRAGE, for anatomical reference, with the following parameters: TR/TE/TI=2000/3.5/1100 ms, FOV=256x256mm2. 3D T2-FLAIR with the following parameters: TR/TE/TI=5000/386/1800ms, FOV=256x256 mm2; was also acquired for assessment of lesions.
Axial diffusion-weighted imaging (DWI) was obtained using a fat-suppressed single-shot echo-planar imaging (EPI) sequence. TR/TE: 9400/69ms; in 70 slices; slice thickness: 2mm; FOV: 240mm2, with a voxel size of 2mm3; and b-value=3000s/mm2. An in-house DWI pre-processing pipeline briefly described in Figure 1.To account for the effects of lesions on fibre orientation distributions (FODs), we estimated fibre density using a single-shell three-tissue technique as implemented in MRtrix3Tissue v3.0.19. We used a well-known standard atlas, the Automated Anatomical Labelling (AAL) v3 with 166 parcels 10. Network-based statistics 7 in MATLAB was used to determine a network of connections that distinguishes the groups (all pw-RRMS against HCs).
Results
Pw-RRMS showed higher mean fatigue scores (p≤0.01) compared to HCs; no statistical difference was found between treatment groups. The gap between HCs and pw-RRMS widened at the follow-up, showing more statistically significant differences in most scores. Detailed demographic characteristics and clinical details of both groups and pw-RRMS subgroups at two time points are shown in Table 1.Baseline analysis showed a widespread network in the frontal, parietal, and temporal regions, as well as subcortical regions. This network was significantly weaker in pw-RRMS than HCs (p=0.03±0.01, Figure 2). 2-YFU analysis showed a widespread network in the frontal, parietal, and temporal regions, as well as subcortical regions and parts of the cerebellum. This network appears to have more connections around the midbrain when compared to the BL network but showed a similar network significance (p=0.03±0.01, Figure 3). Longitudinal analysis of network fibre density in pw-RRMS revealed significantly higher fibre densities at 2-YFU (p=0.04±0.01, Figure 4).
Discussion
By combining DWI and tractography with a network-based approach in a longitudinal study, we identified a network that differentiated pw-RRMS from HCs. This network showed widespread white matter differences even after accounting for the effect of lesions. Intuitively, these differences appear in networks responsible for cognition 11, motor function , somatosensory function, balance 12, emotion processing and regulation 13, and memory 14, which is consistent with the symptom profile of MS. This supports previous cross-sectional studies showing extensive differences in fibre density between HCs and pw-RRMS15,16.Conclusion
The combination of advanced imaging methods (tractography) and novel statistical approaches are capable of exposing widespread differences resultant from MS pathology. This longitudinal study has shown evidence for a thalamocortical network that is potentially remyelinated during DMTs in pw-RRMS over time. This rigorous approach could be useful in clinical MS spaces, acting as an additional tool for the identification of repair-enhancing factors.Acknowledgements
The authors acknowledge the facilities and scientific and technical assistance of the National Imaging Facility, a National Collaborative Research Infrastructure Strategy (NCRIS) capability, at the Hunter Medical Research Institute Imaging Centre, University of Newcastle.
References
1. Strik M, Cofré Lizama LE, Shanahan CJ, et al. Axonal loss in major sensorimotor tracts is associated with impaired motor performance in minimally disabled multiple sclerosis patients. Brain Commun 2021;3(2):fcab032.
2. Aung WY, Mar S, Benzinger TL. Diffusion tensor MRI as a biomarker in axonal and myelin damage. Imaging in medicine 2013;5(5):427.
3. Lipp I, Parker GD, Tallantyre EC, et al. Tractography in the presence of multiple sclerosis lesions. Neuroimage 2020;209:116471.
4. Kern KC, Sarcona J, Montag M, Giesser BS, Sicotte NL. Corpus callosal diffusivity predicts motor impairment in relapsing–remitting multiple sclerosis: a TBSS and tractography study. Neuroimage 2011;55(3):1169-1177.
5. Tournier JD, Calamante F, Connelly A. Improved probabilistic streamlines tractography by 2nd order integration over fibre orientation distributions. Proceedings of the international society for magnetic resonance in medicine. Volume 1670: Ismrm; 2010.
6. Serin E, Zalesky A, Matory A, Walter H, Kruschwitz JD. NBS-Predict: A prediction-based extension of the network-based statistic. NeuroImage 2021;244:118625.
7. Zalesky A, Fornito A, Bullmore ET. Network-based statistic: identifying differences in brain networks. Neuroimage 2010;53(4):1197-1207.
8. Smith SM, Nichols TE. Threshold-free cluster enhancement: addressing problems of smoothing, threshold dependence and localisation in cluster inference. Neuroimage 2009;44(1):83-98.
9. Tournier J-D, Smith R, Raffelt D, et al. MRtrix3: A fast, flexible and open software framework for medical image processing and visualisation. Neuroimage 2019;202:116137.
10. Rolls ET, Huang C-C, Lin C-P, Feng J, Joliot M. Automated anatomical labelling atlas 3. Neuroimage 2020;206:116189.
11. Fuster JM. Frontal lobe and cognitive development. Journal of neurocytology 2002;31(3-5):373-385.
12. Morton SM, Bastian AJ. Cerebellar control of balance and locomotion. The neuroscientist 2004;10(3):247-259.
13. Gogolla N. The insular cortex. Current Biology 2017;27(12):R580-R586.
14. Cavanna AE, Trimble MR. The precuneus: a review of its functional anatomy and behavioural correlates. Brain 2006;129(3):564-583.
15. Shu N, Liu Y, Li K, et al. Diffusion tensor tractography reveals disrupted topological efficiency in white matter structural networks in multiple sclerosis. Cerebral cortex 2011;21(11):2565-2577.
16. Charalambous T, Tur C, Prados F, et al. Structural network disruption markers explain disability in multiple sclerosis. Journal of Neurology, Neurosurgery & Psychiatry 2019;90(2):219-226.
Figures
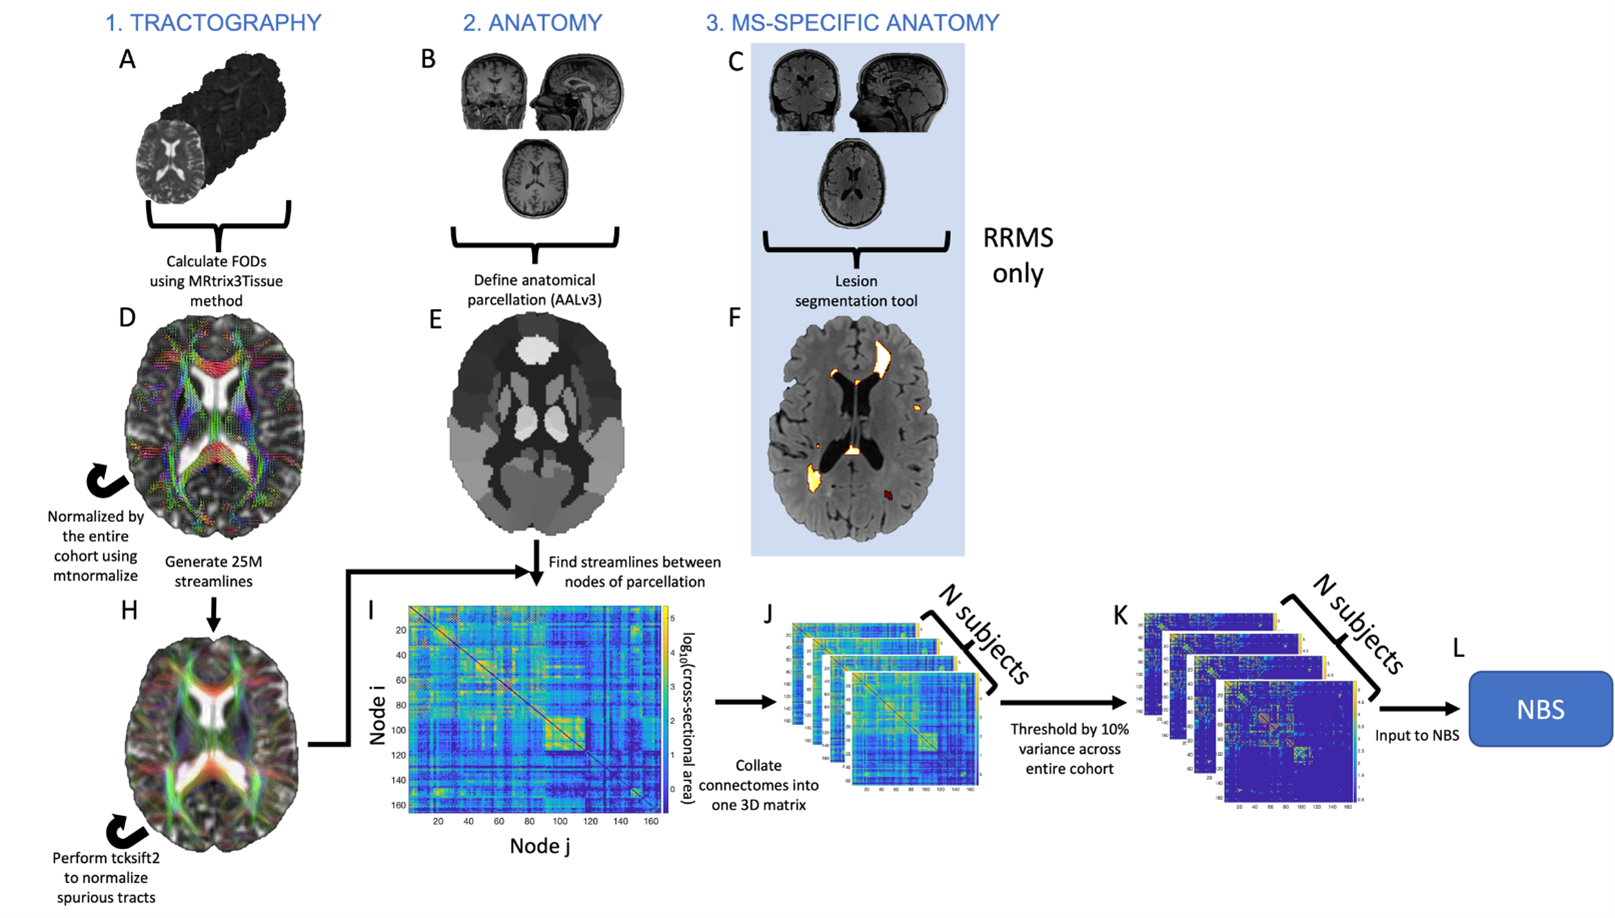
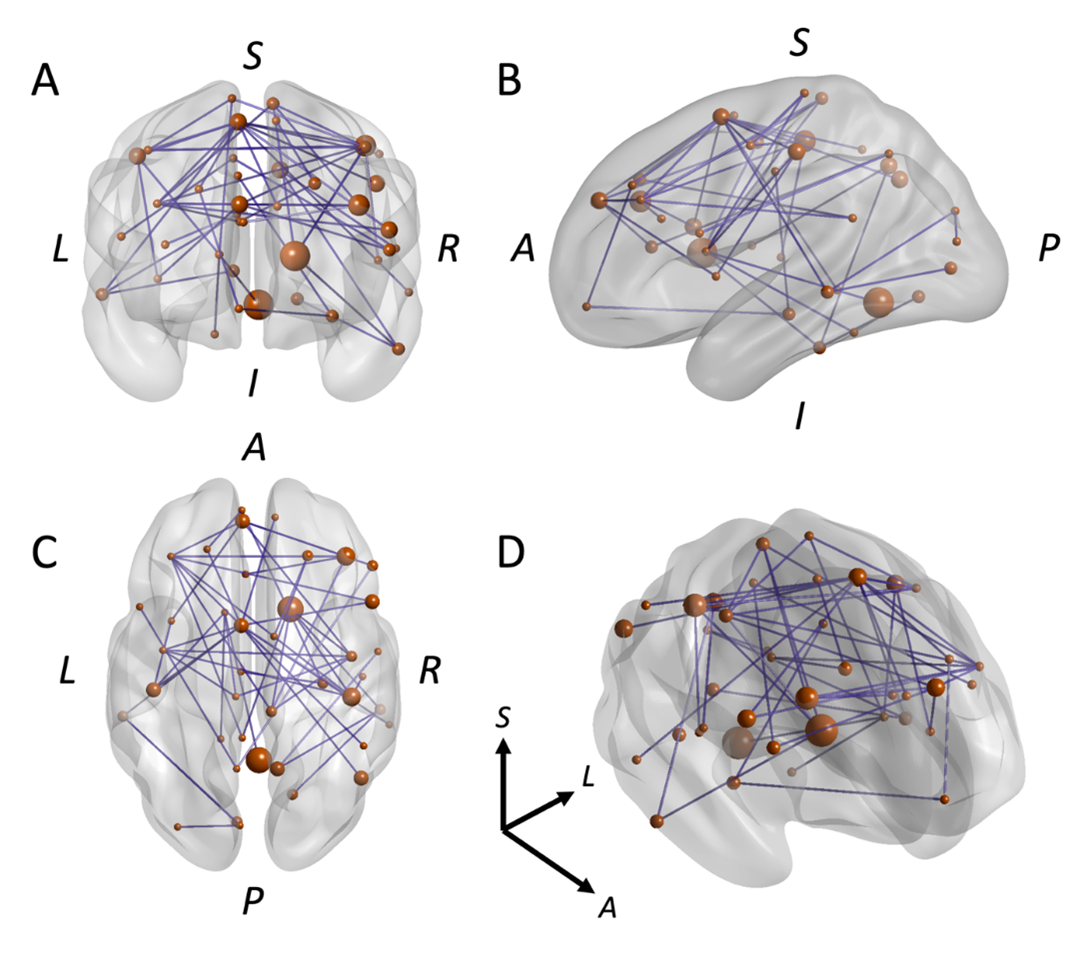
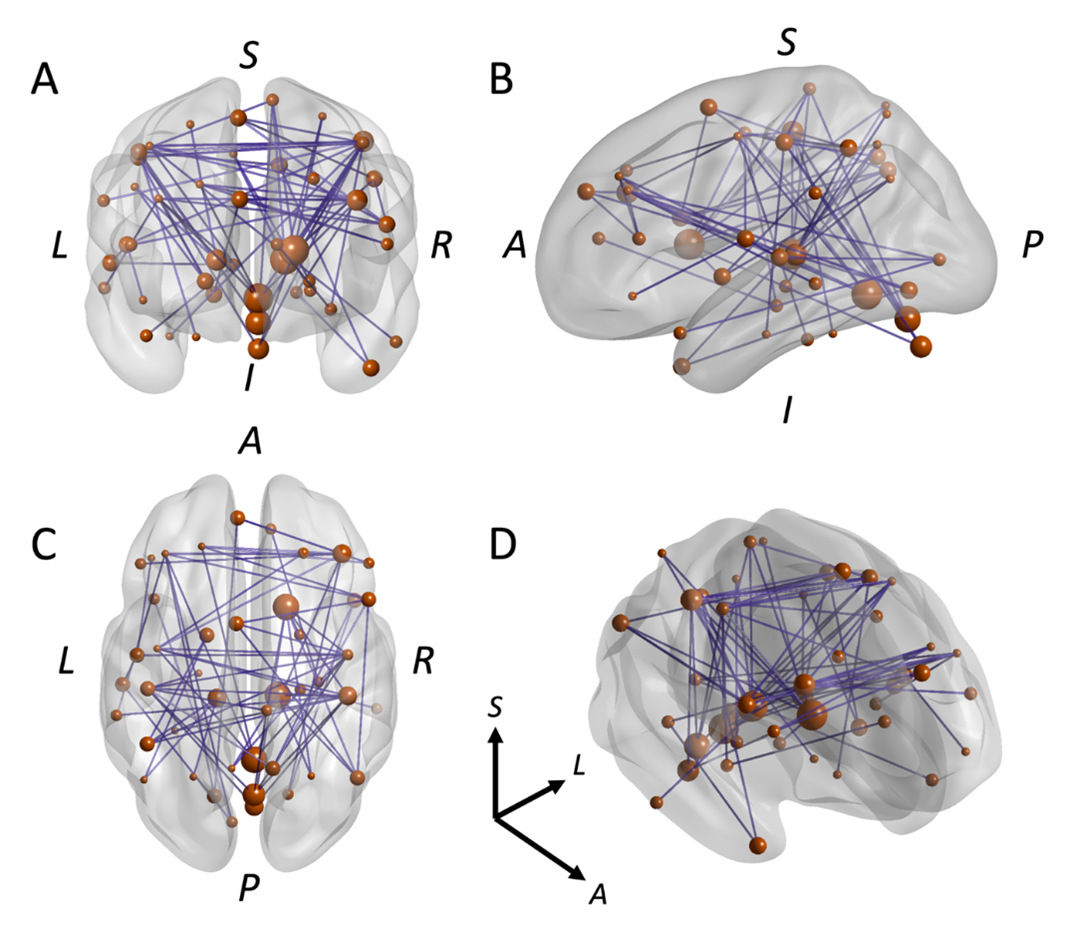
Figure 3. NBS results of HCs vs. pw-RRMS at 2-year follow-up. (A) Coronal view of significant network. (B) Sagittal view of significant network. (C) Axial view of significant network. (D) 3D rotated view of significant network. Nodes in orange are located according to their centroid stereotaxic MNI coordinates, scaled in size by the number of connections (nodal degree); binary (unweighted) connections are shown in blue.
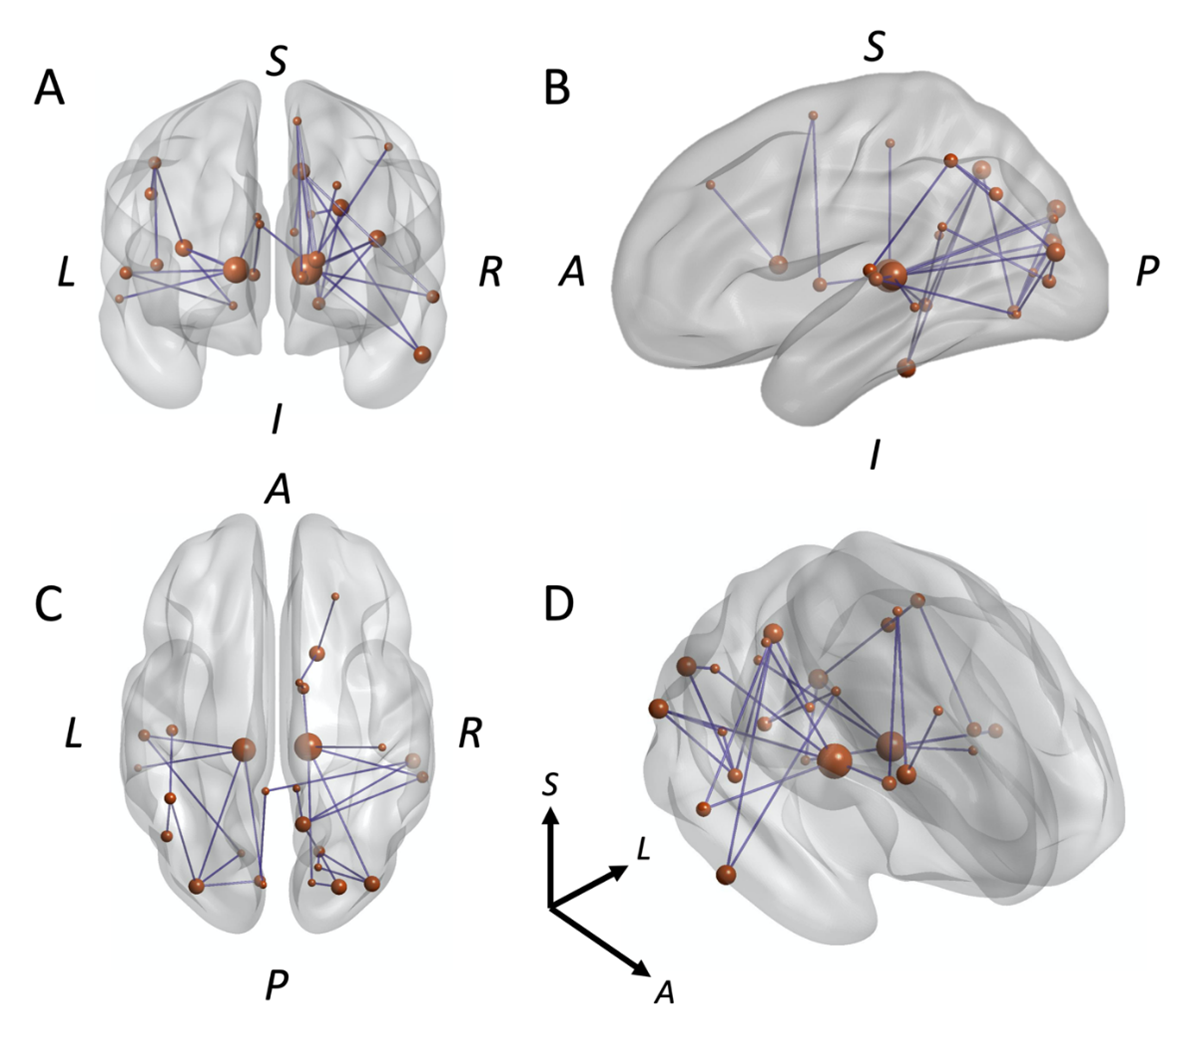
Figure 4. NBS results of longitudinal contrast within pw-RRMS (fibre density network RRMS2-YFU vs. RRMSBL). (A) Coronal view of significant network. (B) Sagittal view of significant network. (C) Axial view of significant network. (D) 3D rotated view of significant network. Nodes in orange are located according to their centroid stereotaxic MNI coordinates, scaled in size by the number of connections (nodal degree); binary (unweighted) connections are shown in blue.
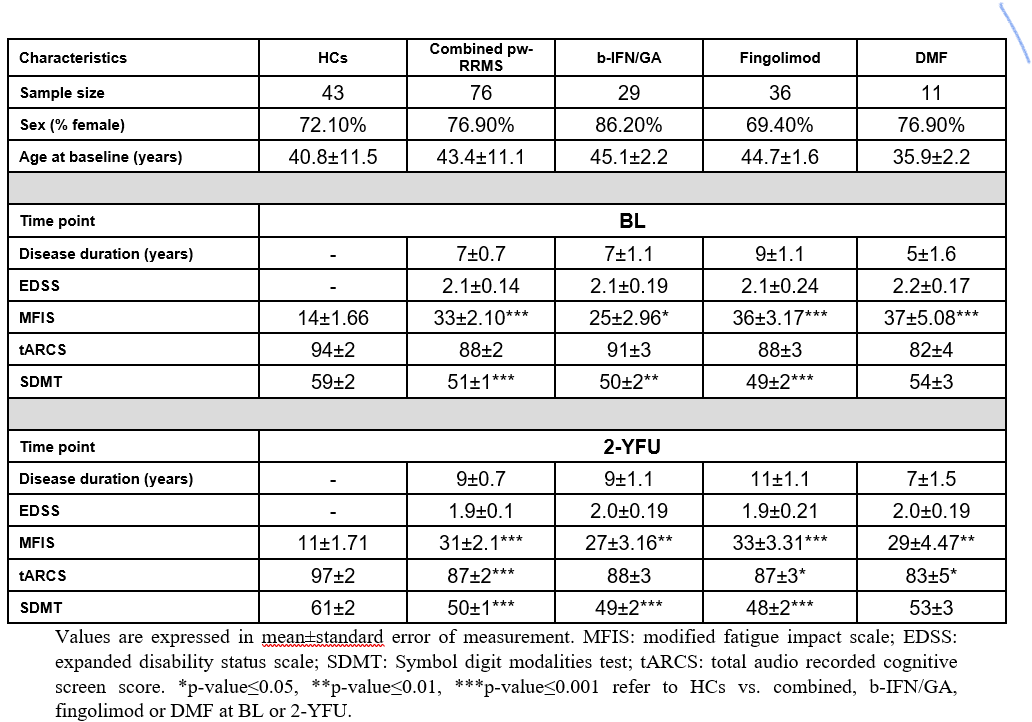
Table 1. Mean demographic scores and disease-related variables for pw-RRMS as combined and separated disease-modifying therapies (DMTs) subgroups (b-IFN/GA, fingolimod and DMF) and HCs at BL and 2-YFU.