2949
Study of Neurometabolic Alterations in Multiple Sclerosis Using Fast High-Resolution 3D 1H-MRSI1School of Biomedical Engineering, Shanghai Jiao Tong University, Shanghai, China, 2Department of Neurology, Huashan Hospital, Fudan University, Shanghai, China, 3Department of Radiology, Huashan Hospital, Fudan University, Shanghai, China, 4Beckman Institute for Advanced Science and Technology, University of Illinois at Urbana-Champaign, Urbana, IL, United States, 5Department of Electrical and Computer Engineering, University of Illinois at Urbana-Champaign, Urbana, IL, United States, 6National Center for Supercomputing Applications, University of Illinois at Urbana-Champaign, Urbana, IL, United States, 7Siemens Medical Solutions USA, Inc., Urbana, IL, United States
Synopsis
Keywords: Multiple Sclerosis, Multiple Sclerosis
Motivation: Multiple sclerosis (MS) is characterized by diverse metabolic alterations. 1H-MRSI provides a unique capability for non-invasive mapping of neurometabolites but is often limited in resolution, scanning time, and brain coverage.
Goal(s): Our goal was to demonstrate the feasibility of high-resolution whole-brain 1H-MRSI for characterizing metabolic alterations in MS.
Approach: 3D 1H-MRSI scanning using SPICE technology (scan time: 10 minutes, resolution: 2×3×3 mm3, FOV: 240×240×120 mm3) was performed on 44 MS patients.
Results: N-acetylaspartate (NAA), myo-inositol (mI), creatine, and choline levels altered among different lesion types and peri-plaque regions. NAA and mI/NAA differentiated RRMS and PMS patients in association with clinical scores.
Impact: High-resolution whole-brain 1H-MRSI provides a promising tool for non-invasive metabolic imaging to characterize MS pathophysiology.
Introduction
Multiple sclerosis (MS) is a chronic inflammatory disease characterized by inflammation, gliosis, demyelination, remyelination, and axonal loss, all contributing to clinical disability and disease progression 1,2. Lesion appearance on T1- and T2-weighted MRI has limited capabilities in characterizing MS lesions and identifying diffuse damage in areas of normal-appearing white matter (NAWM) due to their low sensitivity and specificity 3. Proton MR spectroscopic imaging (1H-MRSI) provides a unique capability for non-invasive mapping of neurometabolites associated with MS pathology, including N-acetylaspartate (NAA) as a marker for neuronal/axonal integrity, myo-inositol (mI) as a marker for astroglial activation and gliosis, creatine (Cr) as a marker for glial cell density, and choline (Cho) as a marker for cell membrane turnover 4–6. However, the low spatial resolution, long data acquisition time, and limited brain coverage have significantly hindered the clinical translation of MRSI. In this study, we demonstrated the feasibility and potential of fast, high-resolution (2×3×3 mm3), whole-brain metabolic imaging of MS using a 1H-MRSI technology known as SPICE (SPectroscopic Imaging by exploiting spatiospectral CorrElation) at 3T 7–11. We evaluated the metabolic alterations and investigated the underlying pathological substrates associated with various lesion types and diffuse damage in NAWM. Furthermore, we determined if the detected metabolic alterations were associated with clinical outcomes.Methods
Forty-four MS patients (34 females; mean age, 34.3±8.1 years), including 32 relapsing-remitting MS (RRMS) and 12 progressive MS (PMS) patients, and 13 healthy controls (HCs, 8 females; mean age, 26.1±6.1 years) were enrolled in our study. Patients underwent neurological examination with expanded disability status scale (EDSS, range: 0-6.5) and symbol digit modalities test (SDMT, range:5-74). The study was approved by the IRB of Huashan Hospital, Shanghai, China. All subjects underwent MRI on a 3T system (MAGNETOM Prisma, Siemens Healthcare, Erlangen, Germany). The imaging protocol included 3D-MRSI using SPICE (2.0×3.0×3.0 mm3; FOV = 240×240×120 mm3; TR/TE = 160/1.6 ms; scan time = 10:03 minutes), T1w-MP2RAGE (1.0×1.0×1.0 mm3, TR/TE/TI = 4000/2.22/1270 ms; FOV = 216×256×192 mm3), and T2w-FLAIR (0.5×0.5×1.0 mm3, TR/TE = 5000/394 ms; FOV = 256×204×160 mm3). The spatiospectral functions of the neurometabolites were reconstructed from the 3D-MRSI data using a union-of-subspaces model, incorporating pre-learned spectral basis functions 7-11. The spectral quantification was performed using an improved LCModel-based algorithm 11.White matter lesions (WML) were segmented on co-registered FLAIR and T1w images following previous literatures 12,13. The lesions were classified into: (1) T1-dark: T1w black holes; (2) T1-hypointense: FLAIR hyperintense and T1w hypointense; (3) T1-isointense: FLAIR hyperintense and T1w isointense 14. The WML mask was dilated isotropically by 4 mm to generate peri-plaque (PP) and NAWM regions 15. Corpus callosum (CC), frequently affected in MS, was segmented based on the JHU-ICBM-labels atlas intersected with the NAWM mask.
Neurometabolic levels were compared among different regions, different lesion types, and different subject groups using paired t-tests, mixed model analysis of covariance (ANCOVA) correcting for lesion volume, and one-way ANCOVA correcting for age/gender, respectively. Associations between neurometabolic levels and clinical scores were evaluated using partial Spearman correlation controlling for age, gender, and disease duration. Bonferroni correction was used for multiple comparisons.
Results
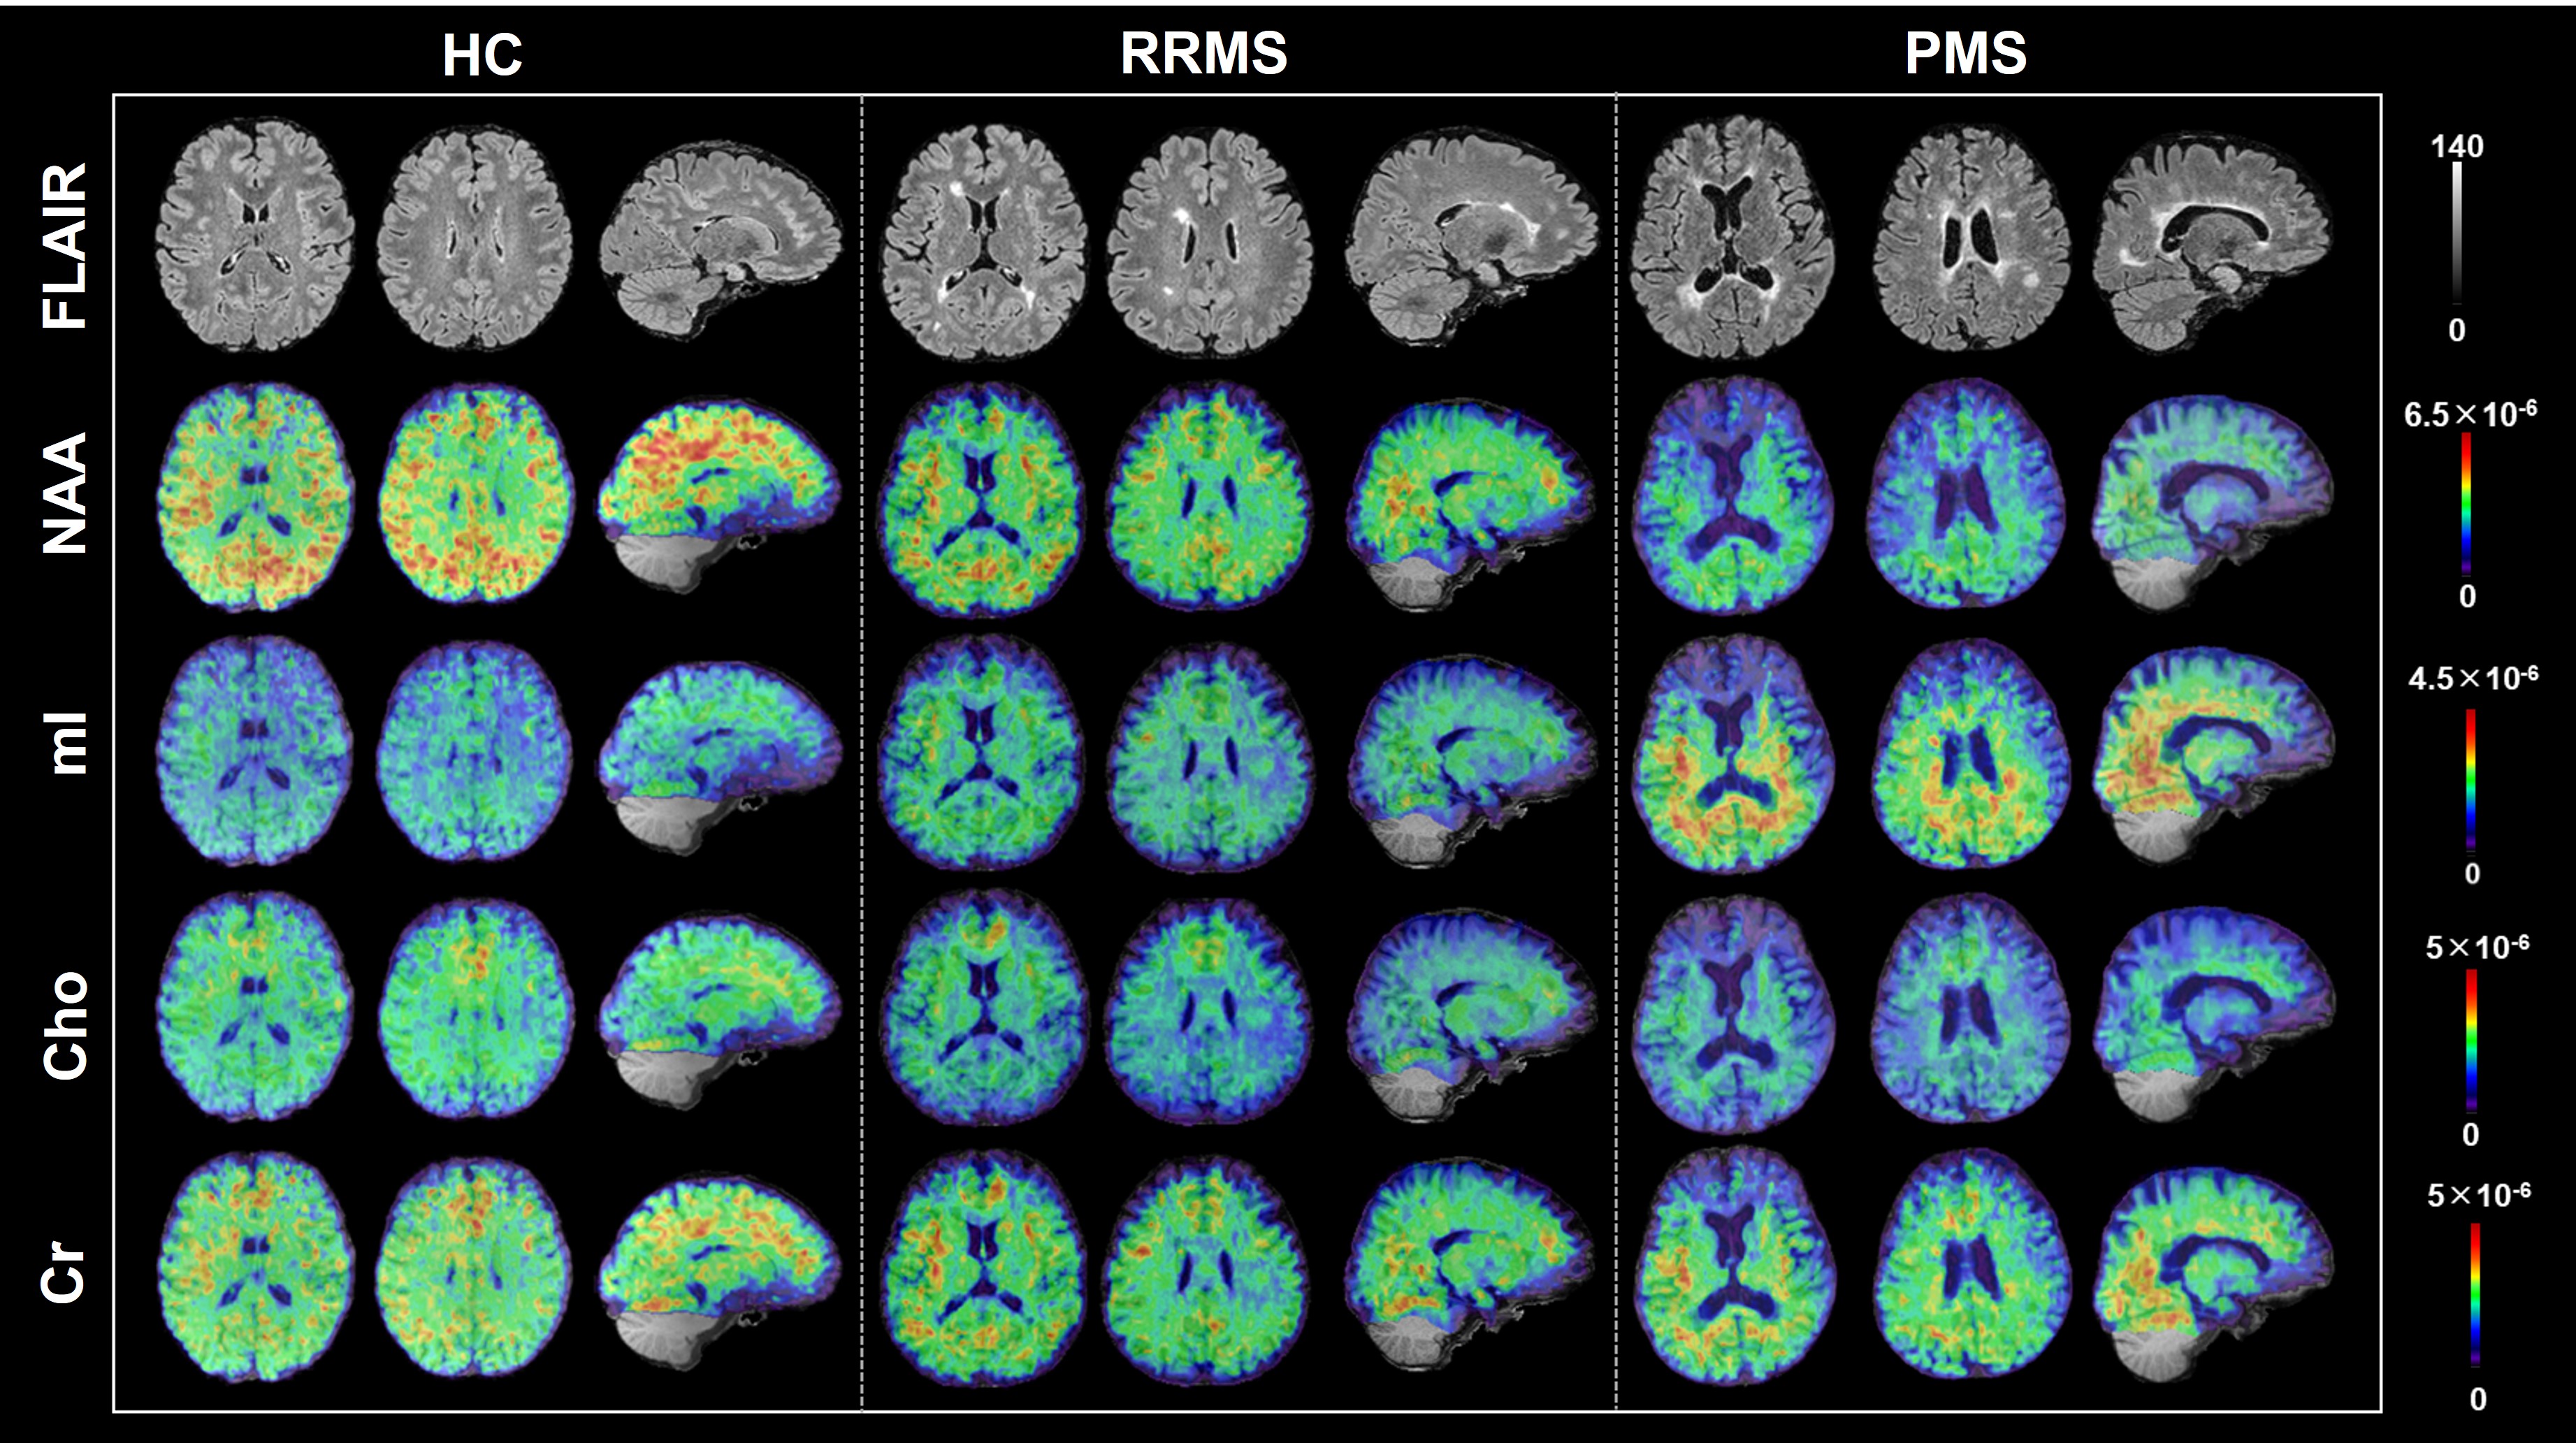
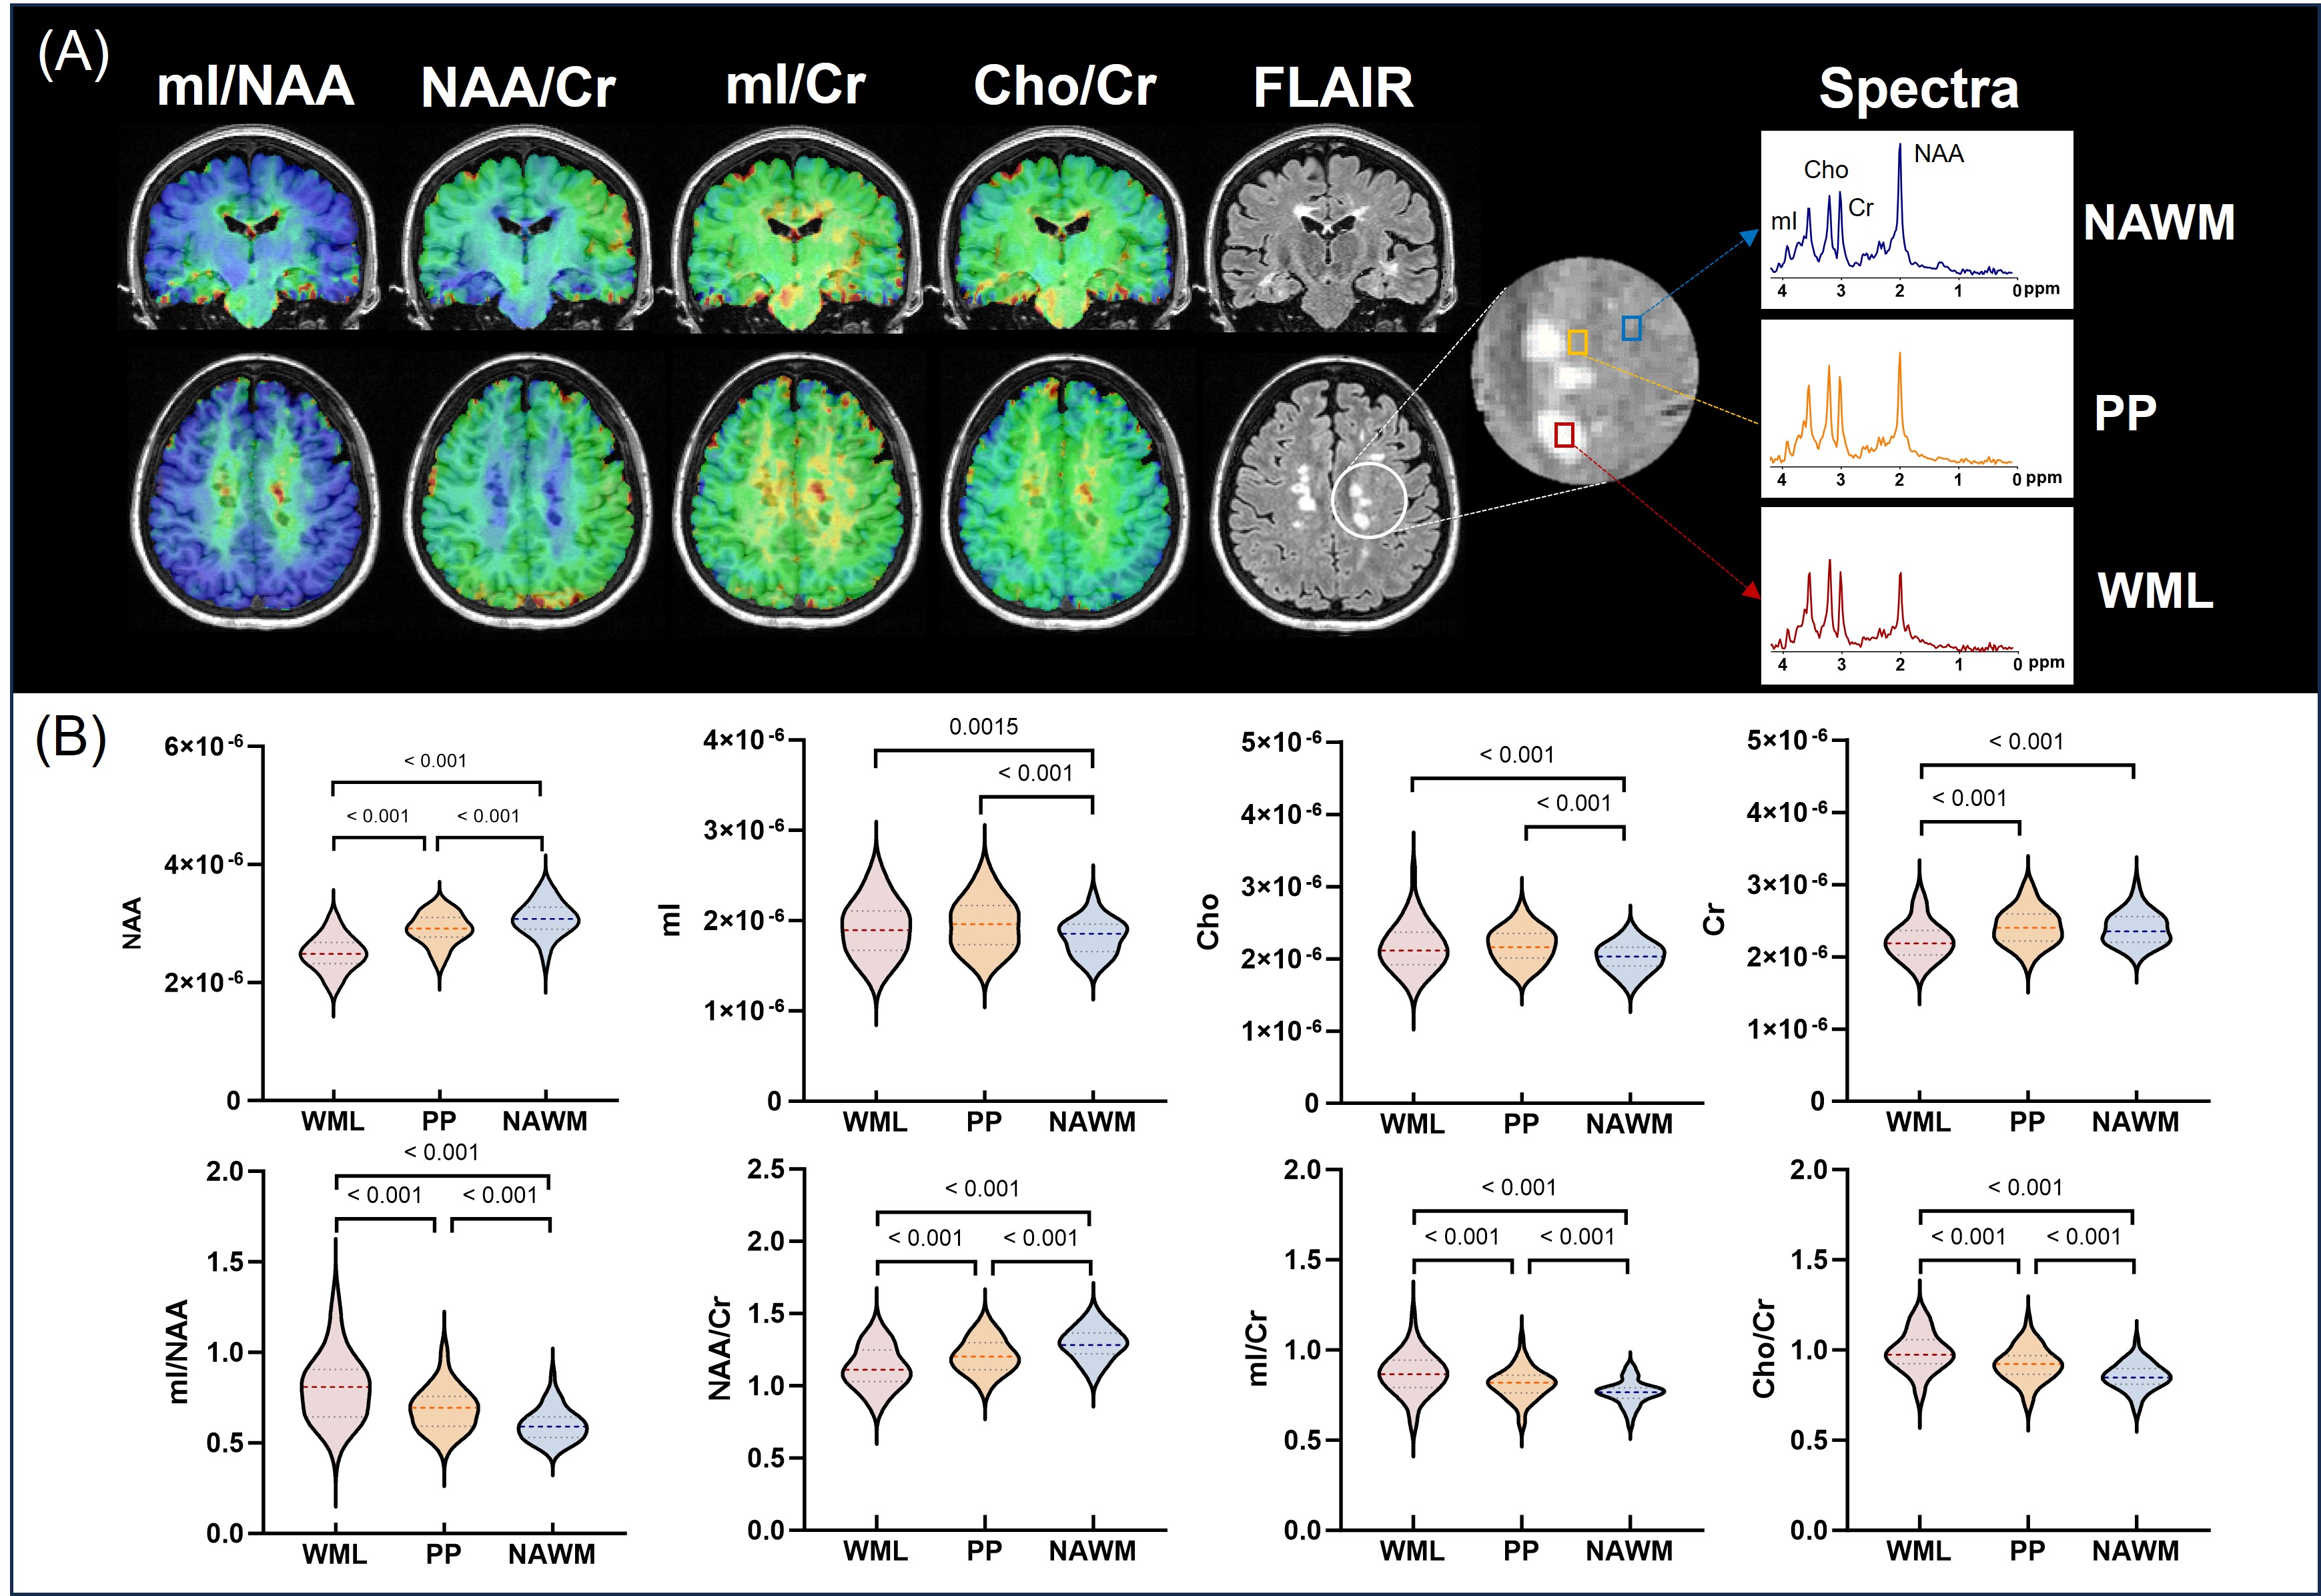
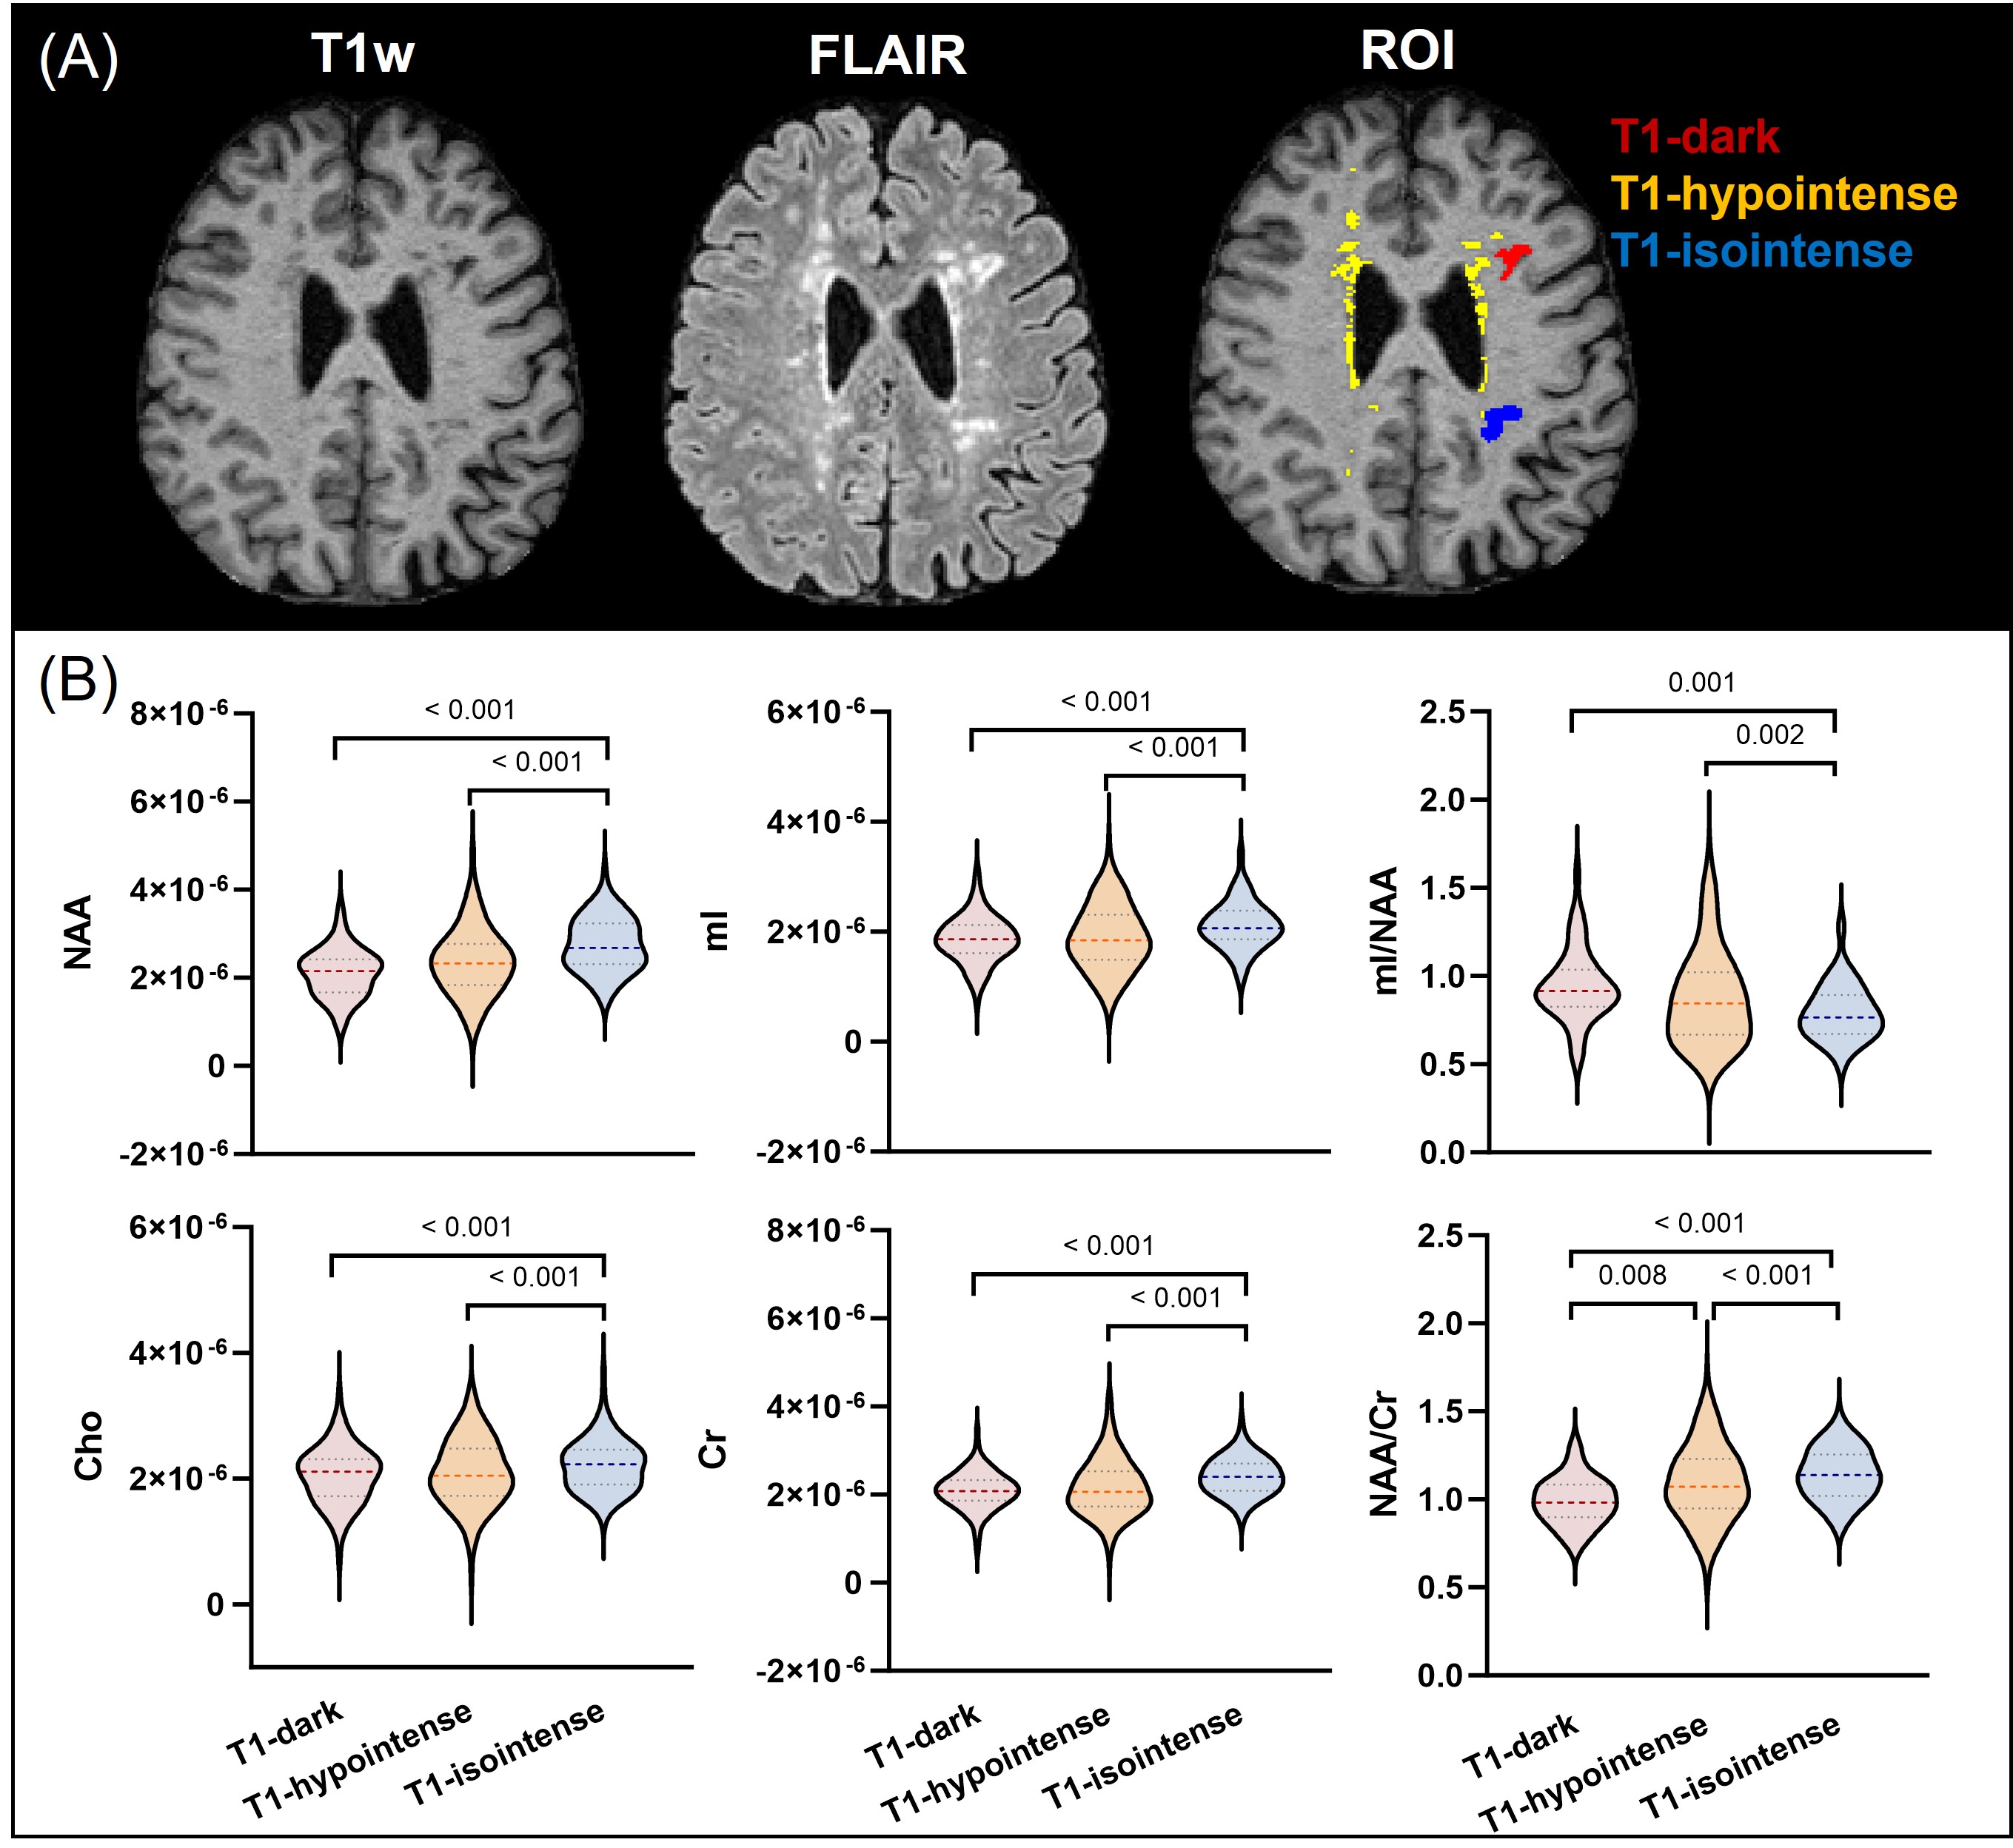
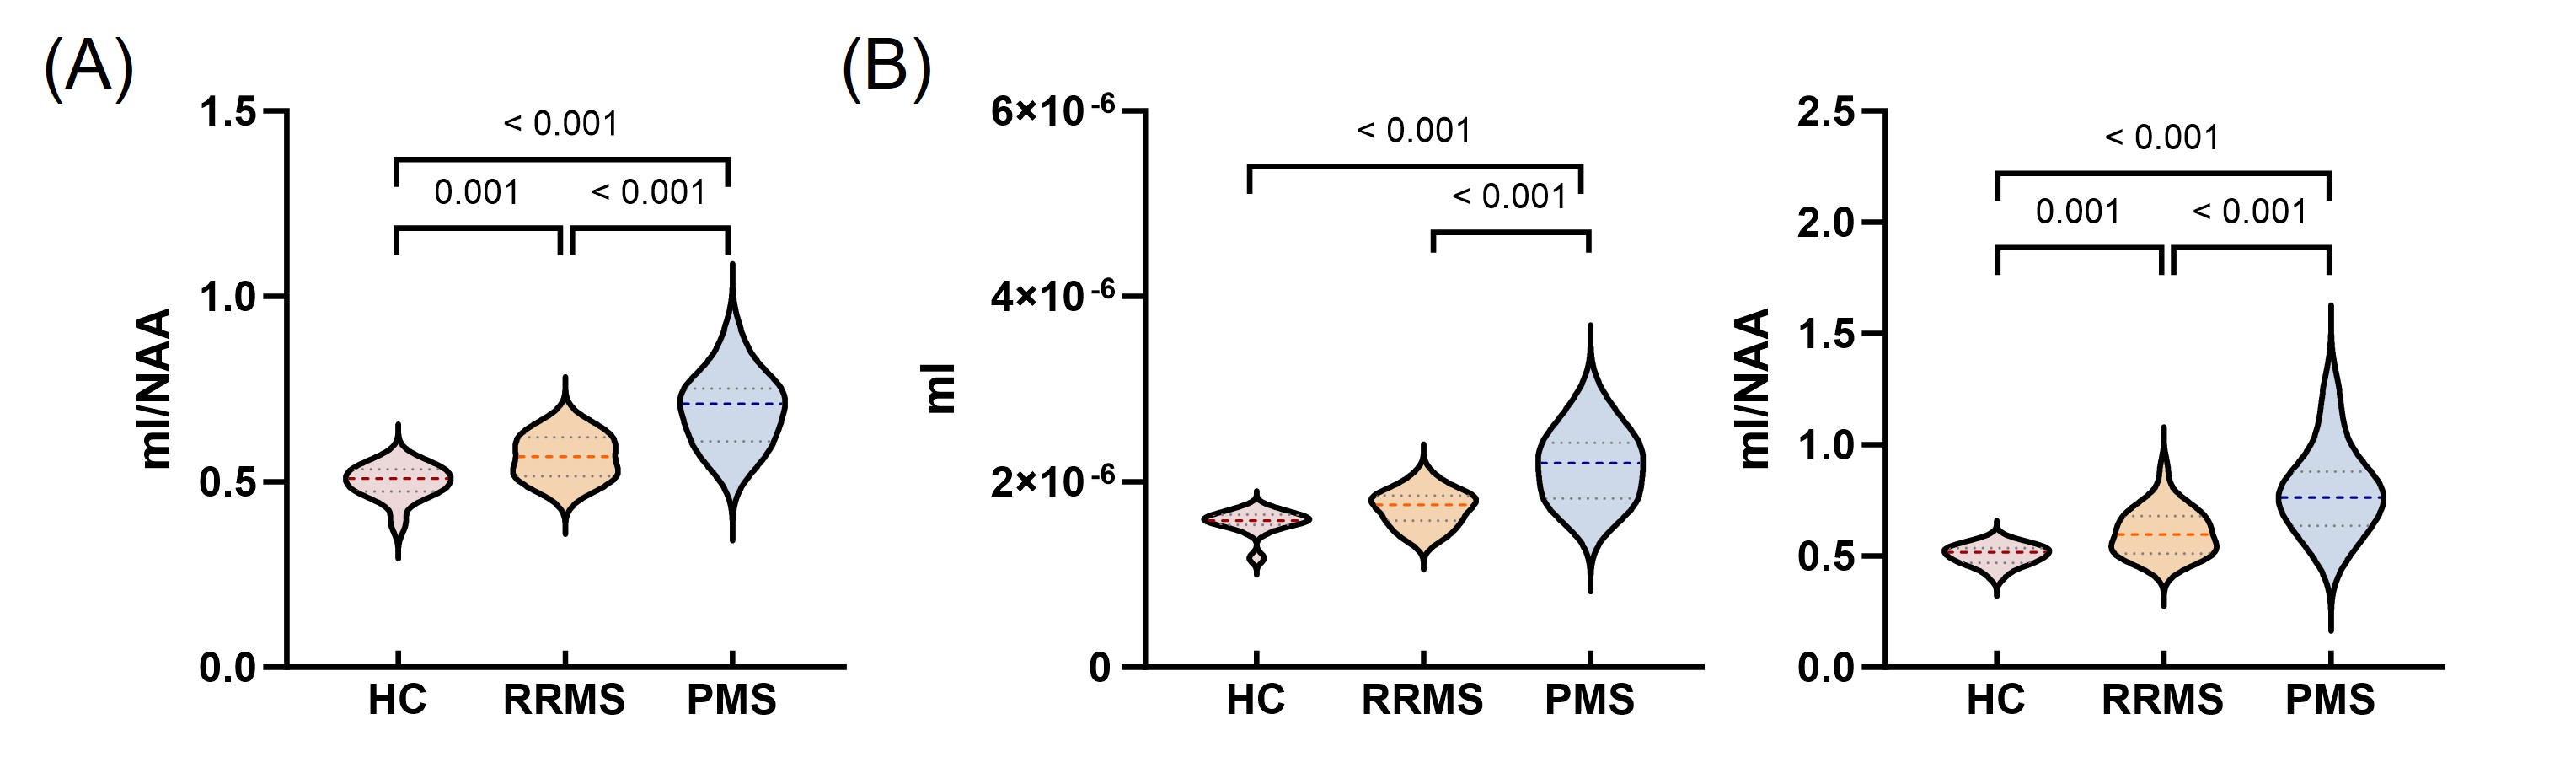
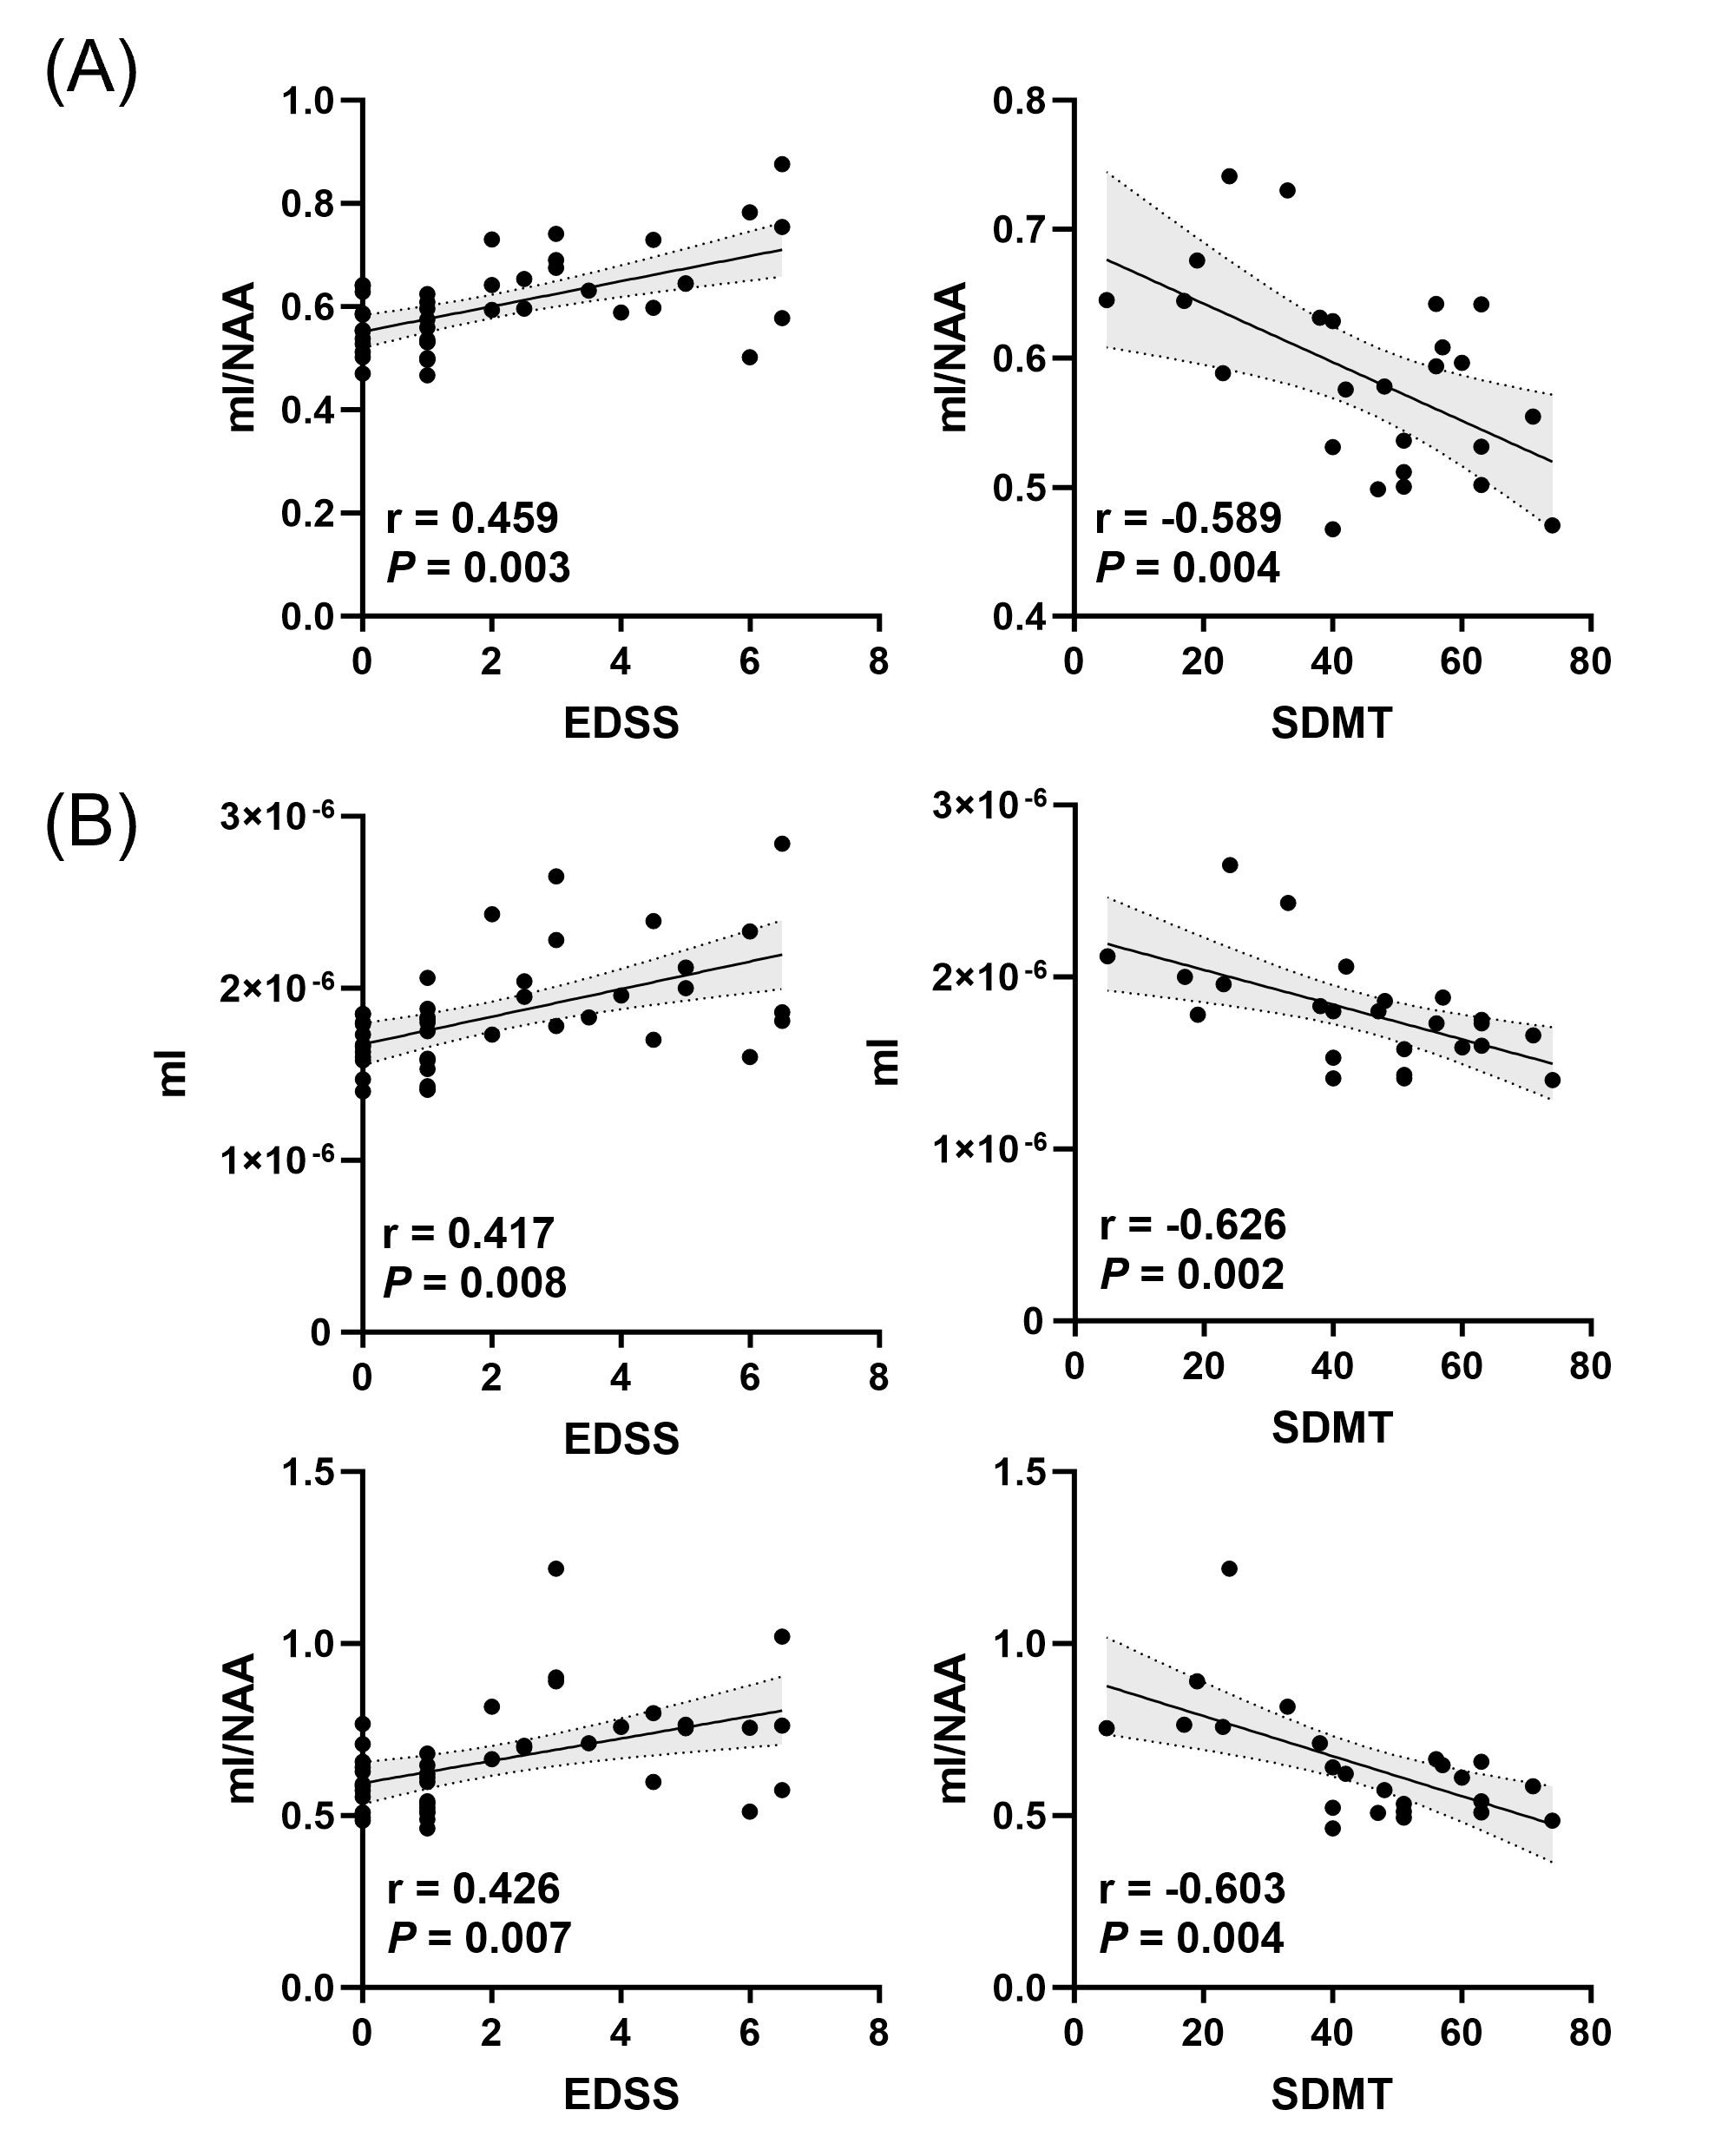
Figure 1 demonstrates representative 3D neurometabolite maps obtained from a healthy subject, an RRMS patient and a PMS patient, respectively. As shown in Figure 2, NAA increased from WML to PP and from PP to NAWM, mI, and Cho decreased from PP to NAWM, and Cr increased from WML to PP (all P < 0.001). Relative metabolic ratios including mI/NAA, mI/Cr, NAA/Cr, and Cho/Cr differed among three regions (P < 0.001). As shown in Figure 3, all neurometabolites in T1-dark and T1-hypointense lesions showed lower levels than T1-isointense lesions (P < 0.001). Lower NAA/Cr level was found in T1-dark lesion than T1-hypointense lesion (P = 0.008). Among the three subject groups, significant differences were found in mI/NAA of NAWM from both whole-brain and CC (P ≤ 0.001) (Fig. 4). PMS patients exhibited higher mI level in CC than RRMS patients (P < 0.001). The patients’ mI/NAA in whole-brain NAWM was associated with EDSS (r = 0.459, P = 0.003) and SDMT scores (r = - 0.589, P = 0.004). Both mI and mI/NAA in CC NAWM were correlated with patient EDSS (r = 0.417, P = 0.008; r = 0.426, P = 0.007) and SDMT scores (r = - 0.626, P = 0.002; r = - 0.603, P = 0.004) (Fig. 5).Conclusion
We demonstrated the feasibility of high-resolution whole-brain 3D 1H-MRSI for characterizing metabolic alterations in MS patients. The work may lay a foundation for a more comprehensive clinical study on using non-invasive metabolic imaging to characterize MS pathophysiology.Acknowledgements
This work was supported by Shanghai Pilot Program for Basic Research—Shanghai Jiao Tong University (21TQ1400203), the Program for Professor of Special Appointment (Eastern Scholar) at Shanghai Institutions of Higher Learning, Key Program of Multidisciplinary Cross Research Foundation of Shanghai Jiao Tong University (YG2021ZD28, YG2023ZD22), and New Faculty Start-up Foundation of Shanghai Jiao Tong University (23X010501992).References
- Trapp BD, Peterson J, Ransohoff RM, et al. Axonal transection in the lesions of multiple sclerosis. New England Journal of Medicine 1998;338(5):278–285.
- Confavreux C, Vukusic S, Adeleine P. Early clinical predictors and progression of irreversible disability in multiple sclerosis: An amnesic process. Brain 2003;126(4).
- Enzinger C, Barkhof F, Ciccarelli O, et al. Nonconventional MRI and microstructural cerebral changes in multiple sclerosis. Nat Rev Neurol 2015;11(12).
- De Stefano N, Filippi M, Miller D, et al. Guidelines for using proton MR spectroscopy in multicenter clinical MS studies. Neurology 2007;69(20).
- Kirov II, Tal A, Babb JS, et al. Serial proton MR spectroscopy of gray and white matter in relapsing-remitting MS. Neurology 2013;80(1).
- Llufriu S, Kornak J, Ratiney H, et al. Magnetic resonance spectroscopy markers of disease progression in multiple sclerosis. JAMA Neurol 2014;71(7).
- Liang Z.-P. Spatiotemporal imaging with partially separable functions. In: Proc. 4th IEEE International Symposium on Biomedical Imaging: From Nano to Macro, Arlington, VA, USA, 2007; pp. 988–91.
- Lam F, Liang Z.-P. A subspace approach to high-resolution spectroscopic imaging. Magn Reson Med 2014;71(4).
- Lam F, Ma C, Clifford B, Johnson CL, Liang Z.-P. High-resolution 1H-MRSI of the brain using SPICE: Data acquisition and image reconstruction. Magn Reson Med. 2016;76(4):1059-1070.
- Ma C, Lam F, Johnson CL, Liang Z.-P. Removal of nuisance signals from limited and sparse 1H MRSI data using a union-of-subspaces model. Magn Reson Med. 2016;75(2):488-497.
- Li Y, Lam F, Clifford B, Liang Z.-P. A subspace approach to spectral quantification for MR spectroscopic imaging. IEEE Trans Biomed Eng. 2017;64(10):2486-2489.
- Valverde S, Oliver A, Roura E, et al. Automated tissue segmentation of MR brain images in the presence of white matter lesions. Med Image Anal 2017;35.
- Meier DS, Guttmann CRG, Tummala S, et al. Dual-sensitivity multiple sclerosis lesion and CSF segmentation for multichannel 3T brain MRI. Journal of Neuroimaging 2018;28(1).
- Schiavi S, Petracca M, Sun P, et al. Non-invasive quantification of inflammation, axonal and myelin injury in multiple sclerosis. Brain 2021;144(1).
- Rahmanzadeh R, Lu PJ, Barakovic M, et al. Myelin and axon pathology in multiple sclerosis assessed by myelin water and multi-shell diffusion imaging. Brain 2021;144(6).
Figures