2948
Imaging the brain with multiple sclerosis using 3D CUBE CEST MRI at clinical 3T1Department of Diagnostic Radiology, The University of Hong Kong, Hong Kong, China, 2Research Group, GE Healthcare, Taipei, Taiwan, 3Department of Medicine, The University of Hong Kong, Hong Kong, China, 4Department of Biomedical Engineering, The University of Hong Kong, Hong Kong, China, 5Russell H. Morgan Department of Radiology and Radiological Science, The Johns Hopkins University School of Medicine, Baltimore, MD, United States, 6Hong Kong Centre for Cerebro-Cardiovascular Health Engineering, Hong Kong, China
Synopsis
Keywords: Multiple Sclerosis, Multiple Sclerosis
Motivation: CEST MRI is a molecular imaging technique that has potential to image the changes of lipids and proteins during demyelination in human brain with multiple sclerosis (MS).
Goal(s): We aimed to explored the sensitivity of different CEST contrasts in differentiating MS brain from healthy control (HC) brain at 3T.
Approach: CEST MRI based on a 3D CUBE acquisition module was applied to image the brain of MS patients and HC subjects at a clinical 3T scanner.
Results: CEST MRI could sensitively identify MS from HC. Amide CEST, rNOE and MT showed significantly lower signals in the MS brain compared to HC brain.
Impact: This study demonstrated the alterations in CEST contrasts in the human brain with multiple sclerosis using a clinical 3T MRI. It provides valuable insights for the clinical application of CEST MRI in diagnosing multiple sclerosis.
Introduction
Multiple sclerosis (MS) is an autoimmune disease affecting the central nervous system. It is characterized by inflammatory demyelination, which leads to axonal loss and permanent disability.1 MRI techniques are widely used to assess structural changes in the MS brain,2-4 providing important diagnostic and prognostic information. Chemical exchange saturation transfer (CEST) MRI is a molecular imaging technique that has the potential to detect proteins, lipids, and metabolites within the body by utilizing exchangeable protons or features.5, 6 It can be applied to image myelin related pathology in MS as myelin is abundant in lipids and proteins. Previous clinical studies have shown that CEST contrasts, including the relayed nuclear Overhauser effect (rNOE) and amide proton transfer (APT), can sensitively identify MS patient from healthy control (HC).7, 8 Preclinical studies have demonstrated that rNOE or APT contrasts could be used for monitoring the demyelination and remyelination processes in cuprizone animal model.9, 10 Despite the feasibility, the current application of CEST MRI in imaging MS is largely confined to small-scale research studies. In this work, we systematically investigated the sensitivity of different CEST contrasts, including amide CEST, rNOE and magnetization transfer (MT), in differentiating MS brain from HC brain at clinical 3T MRI. The performance of different CEST analysis approaches in differentiating MS from HC was compared as well.Methods
The research was approved by the local institutional review board and conducted according to the guidelines. This study involved a total of 12 participants, including five MS patients and seven HC subjects. Informed consent was obtained from each subject. All MRI scans were performed on a GE Signa 3T scanner. CEST sequence was a continuous-wave (CW) saturation module followed by a 3D CUBE readout module. The saturation parameters were set as follows: saturation power (B1)=0.8 μT, saturation length (tsat)=2 s. One M0 images at frequency offset of -300 ppm and 39 CEST images at frequency offsets ranging from -20 to 20 ppm were acquired. The readout parameters were as follows: repetition time (TR)=3.5 s, echo time (TE)=60 ms, field of view (FOV)=220×220×72 mm2, matrix size=256×256×12, slice thickness=6 mm. The scan time for each CEST dataset was about 9 minutes. Data analysis was performed using custom-written code in MATLAB (MathWorks, USA). CEST data were analyzed using multi-pool Lorentzian fitting (MPLF),11, 12 including direct water saturation (DS), amide CEST, rNOE, and MT. MPLF followed by inverse Z-spectrum analysis (MPLF+invZ)13 was also performed for comparison.Results and Discussion
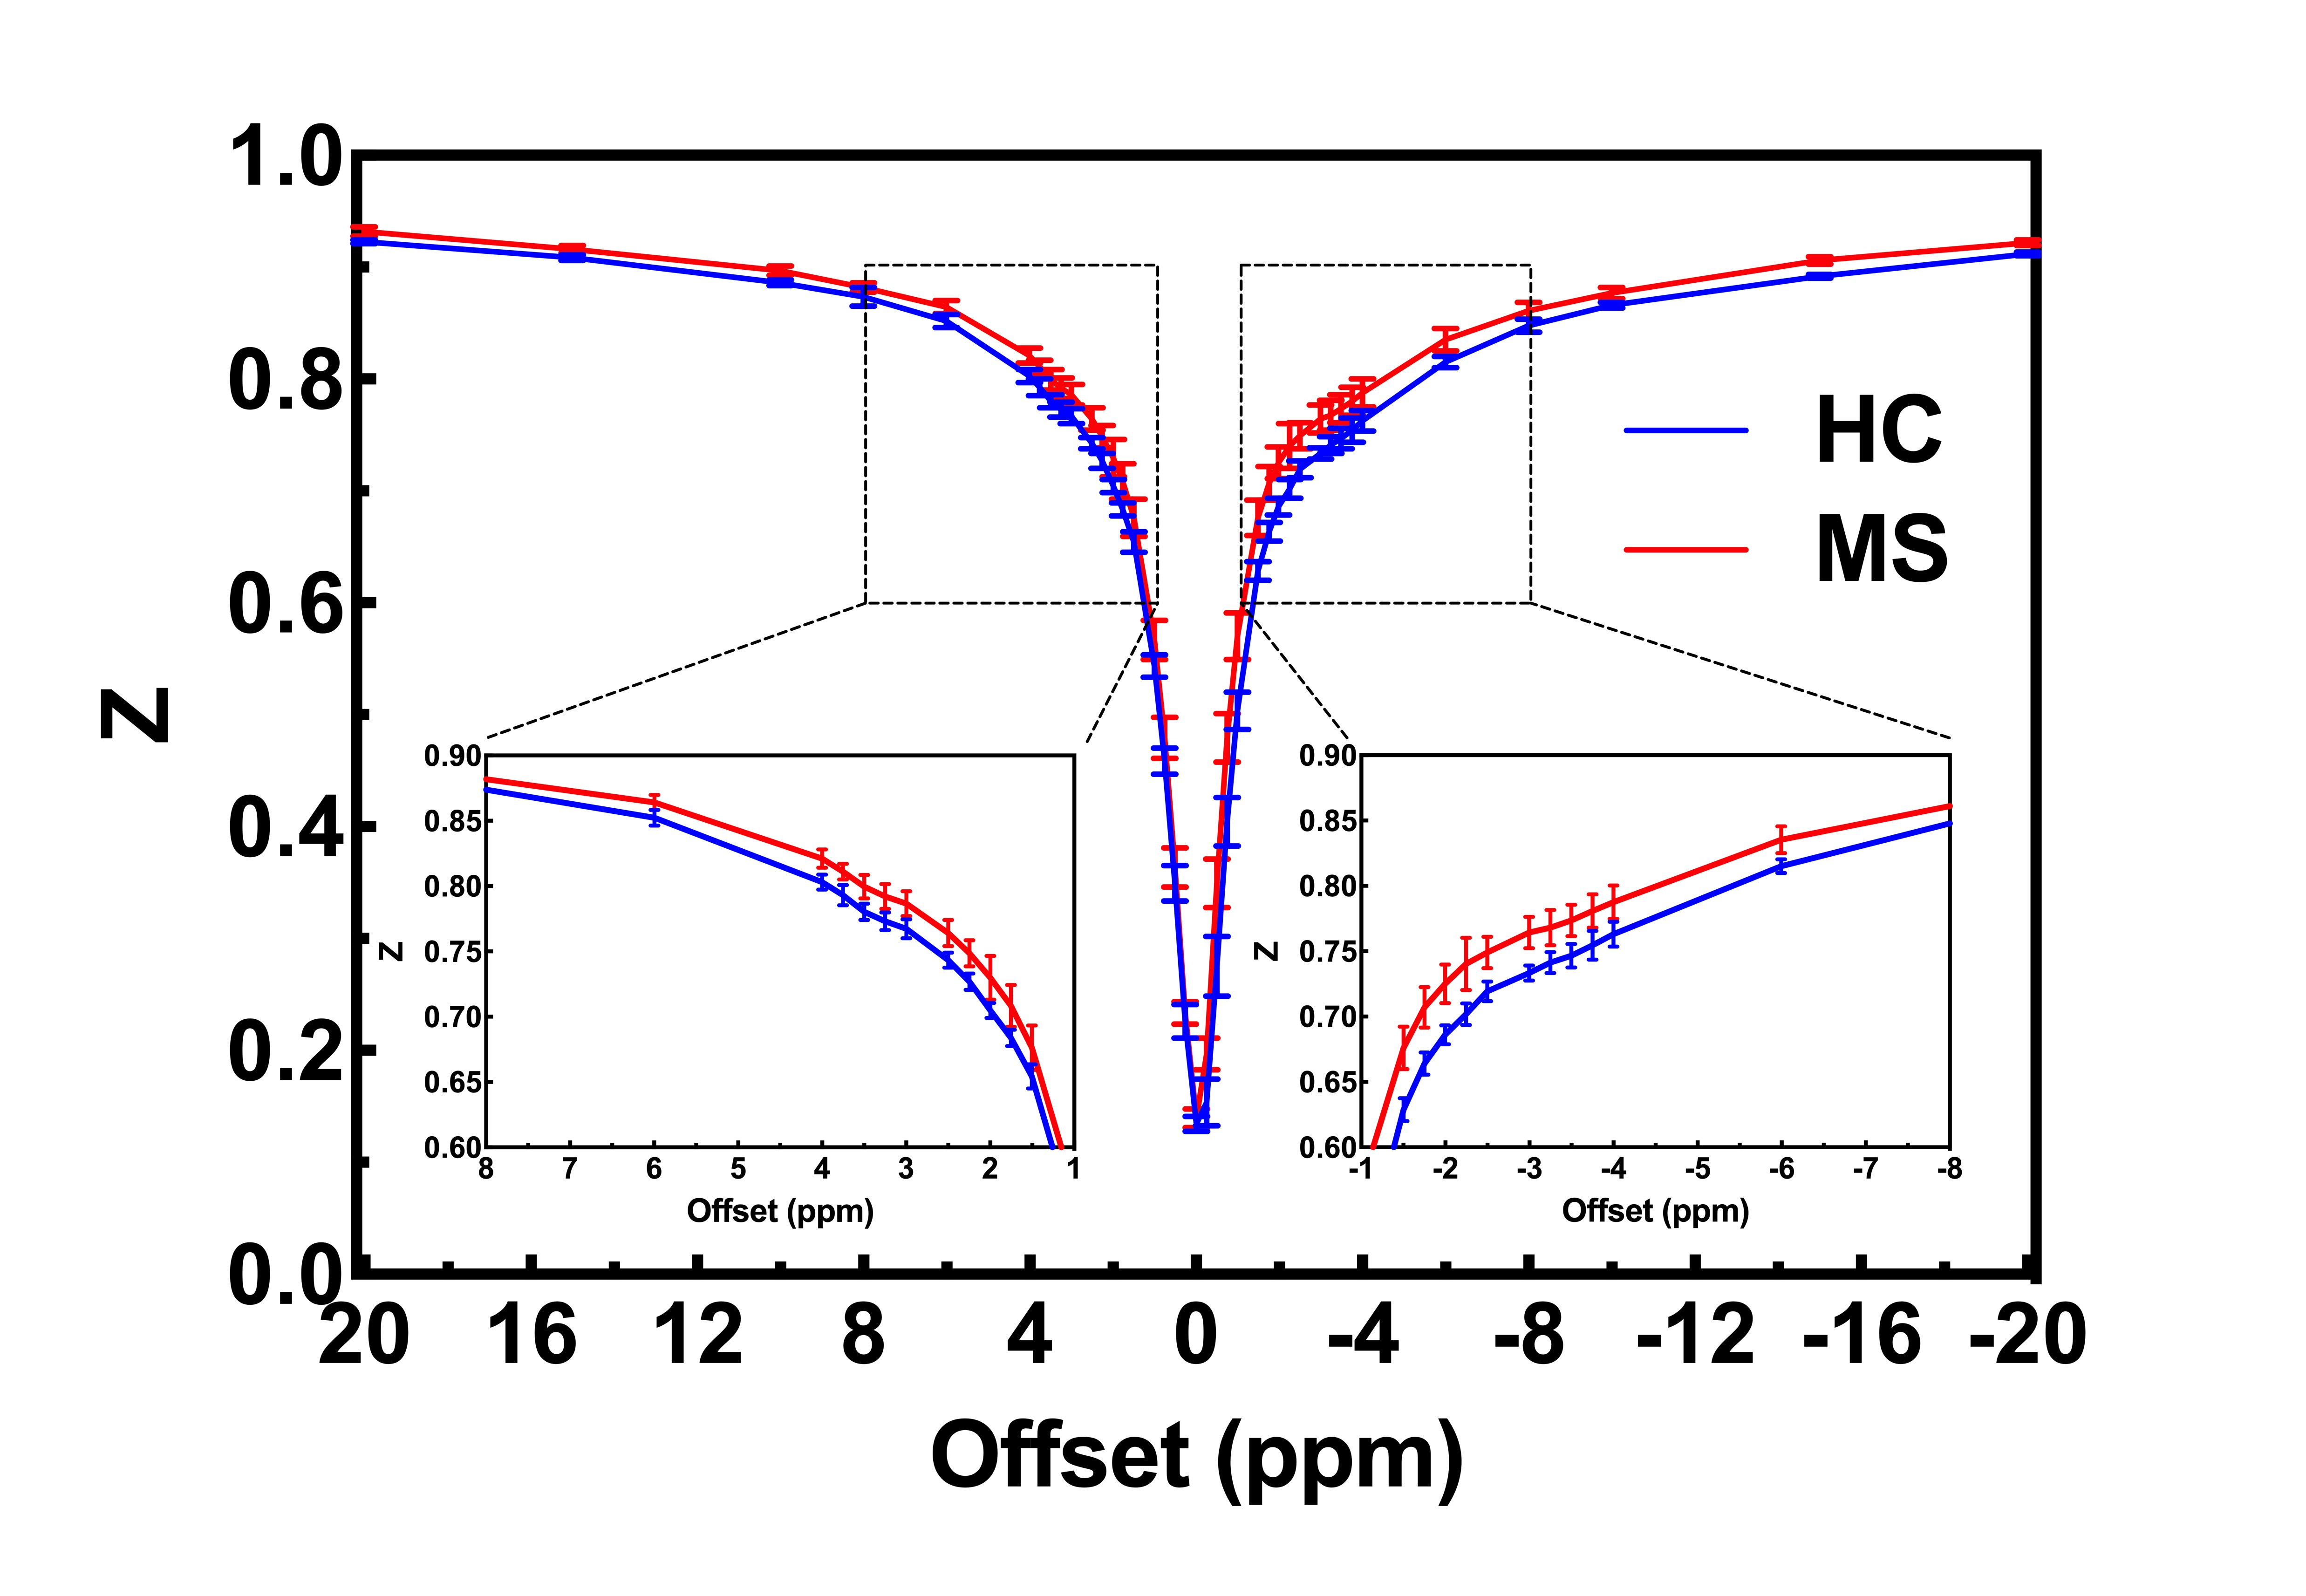
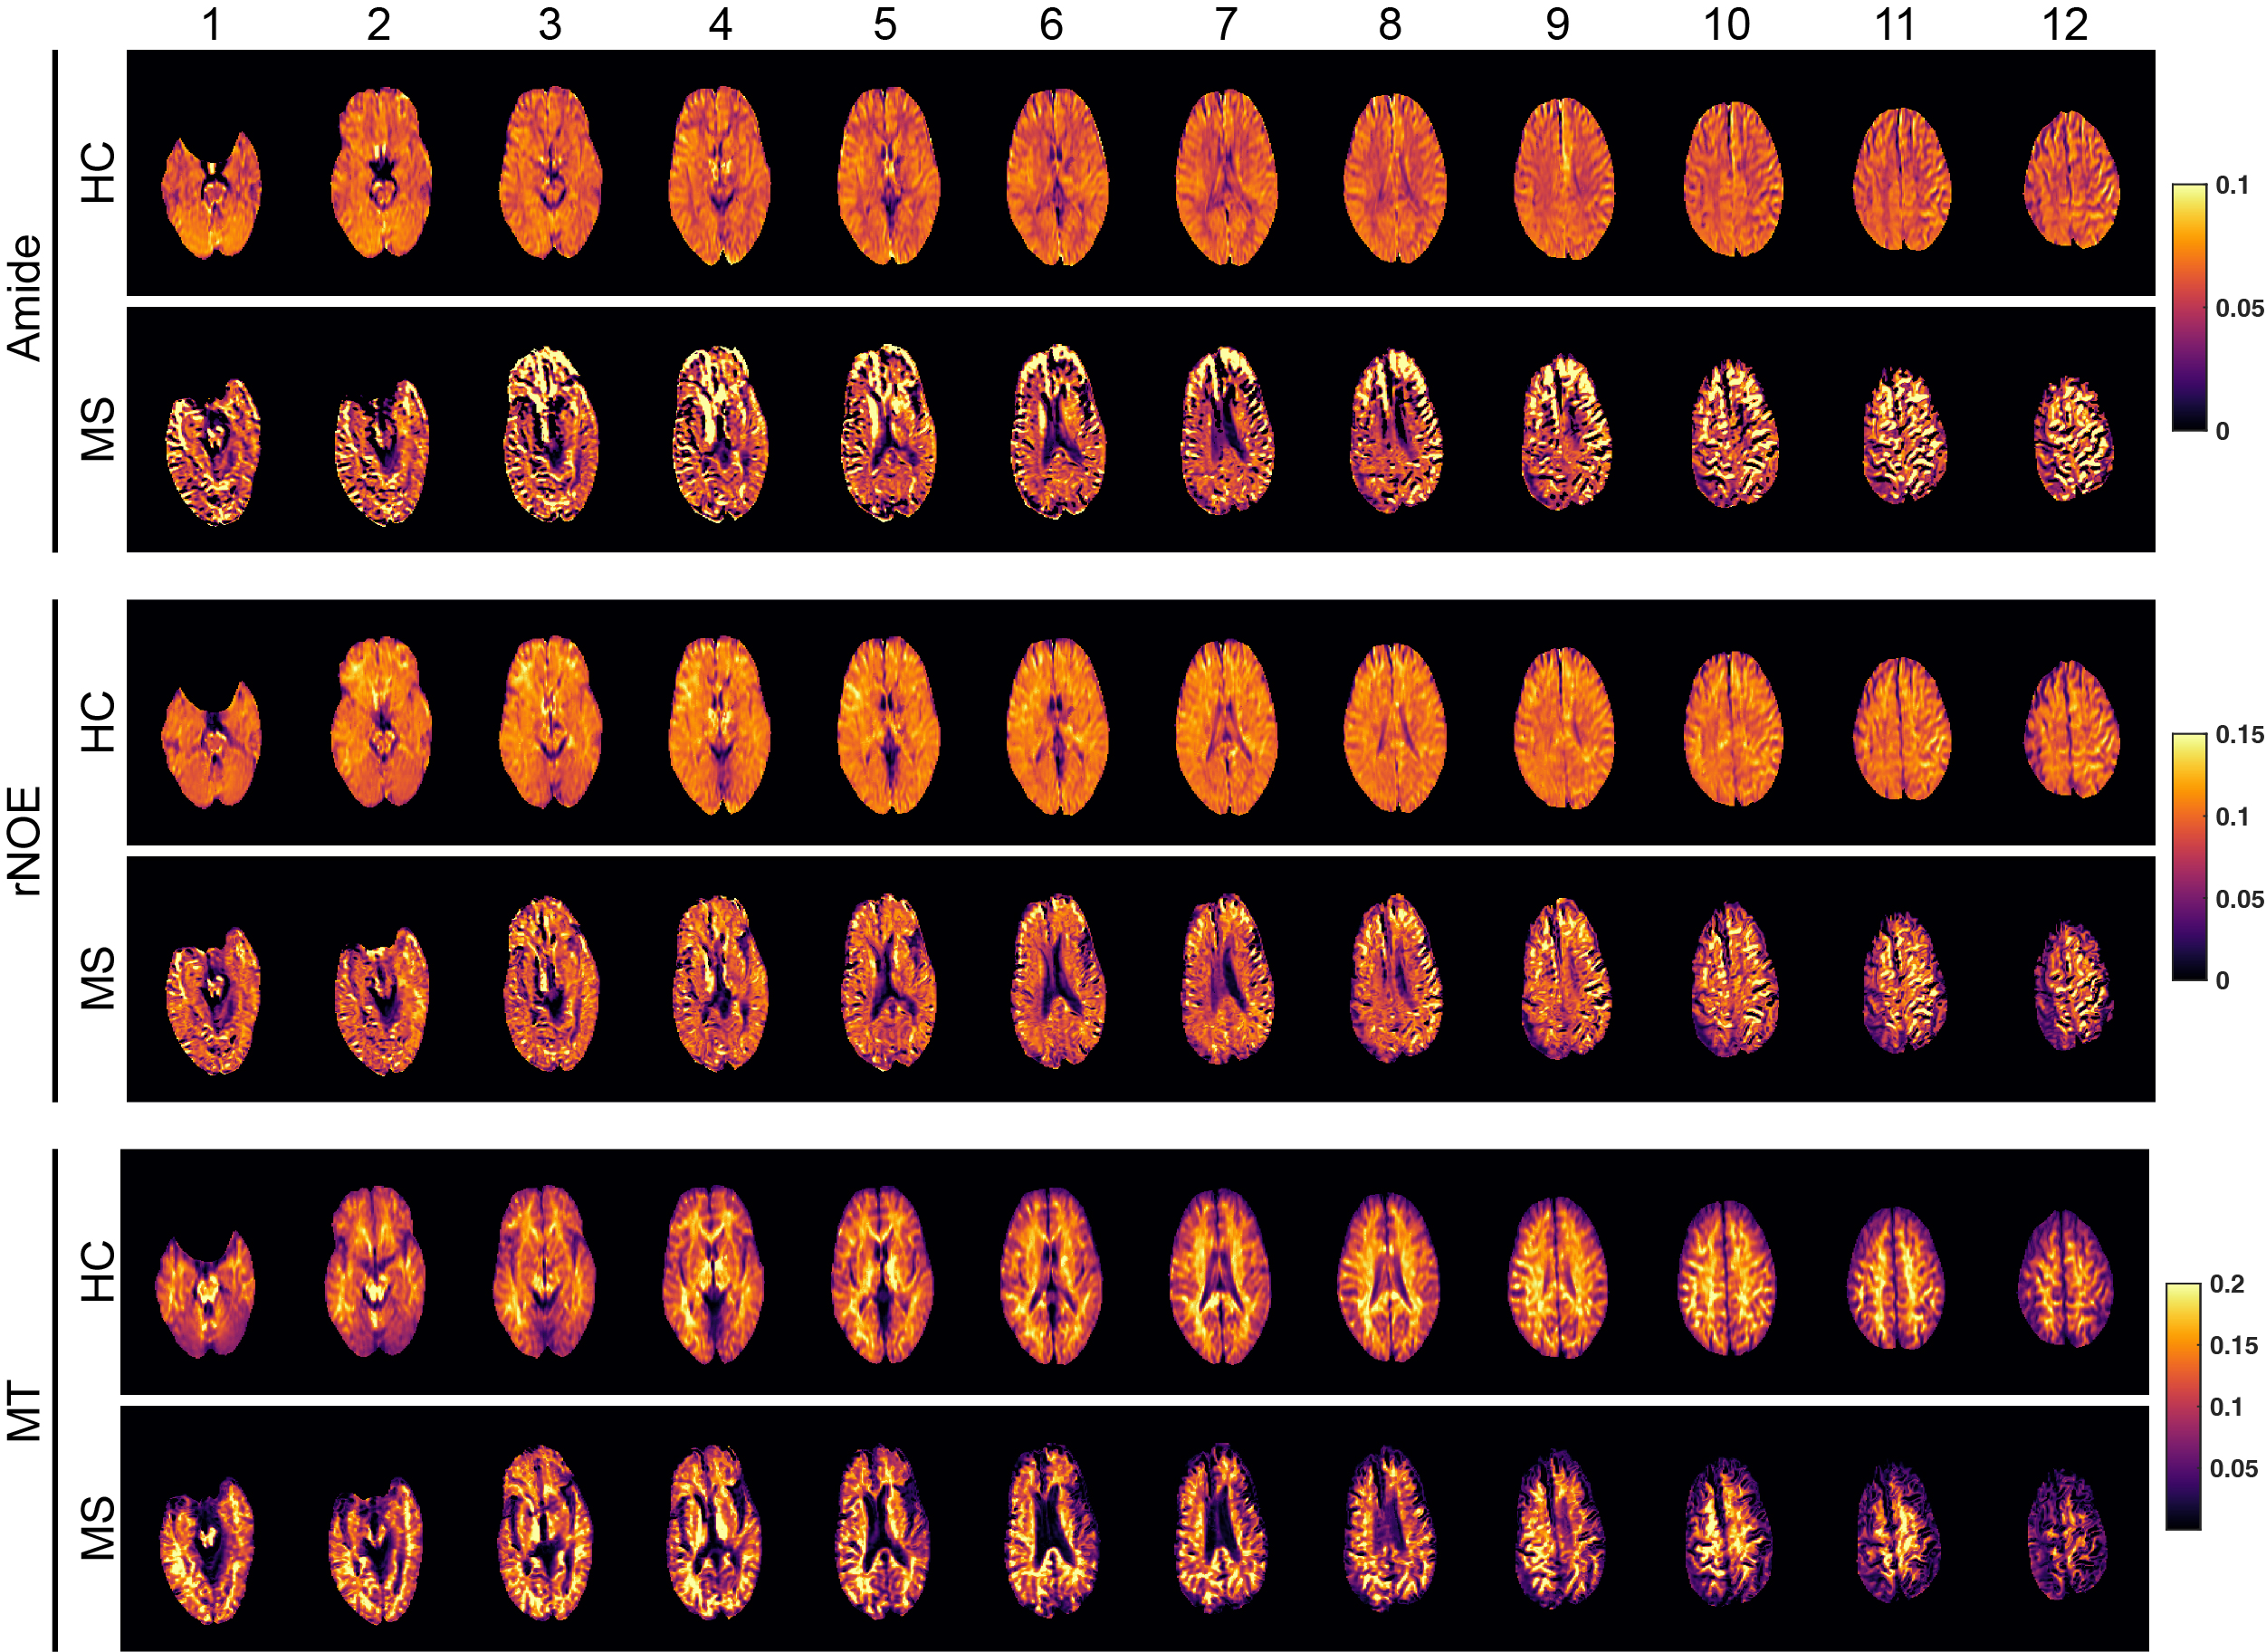
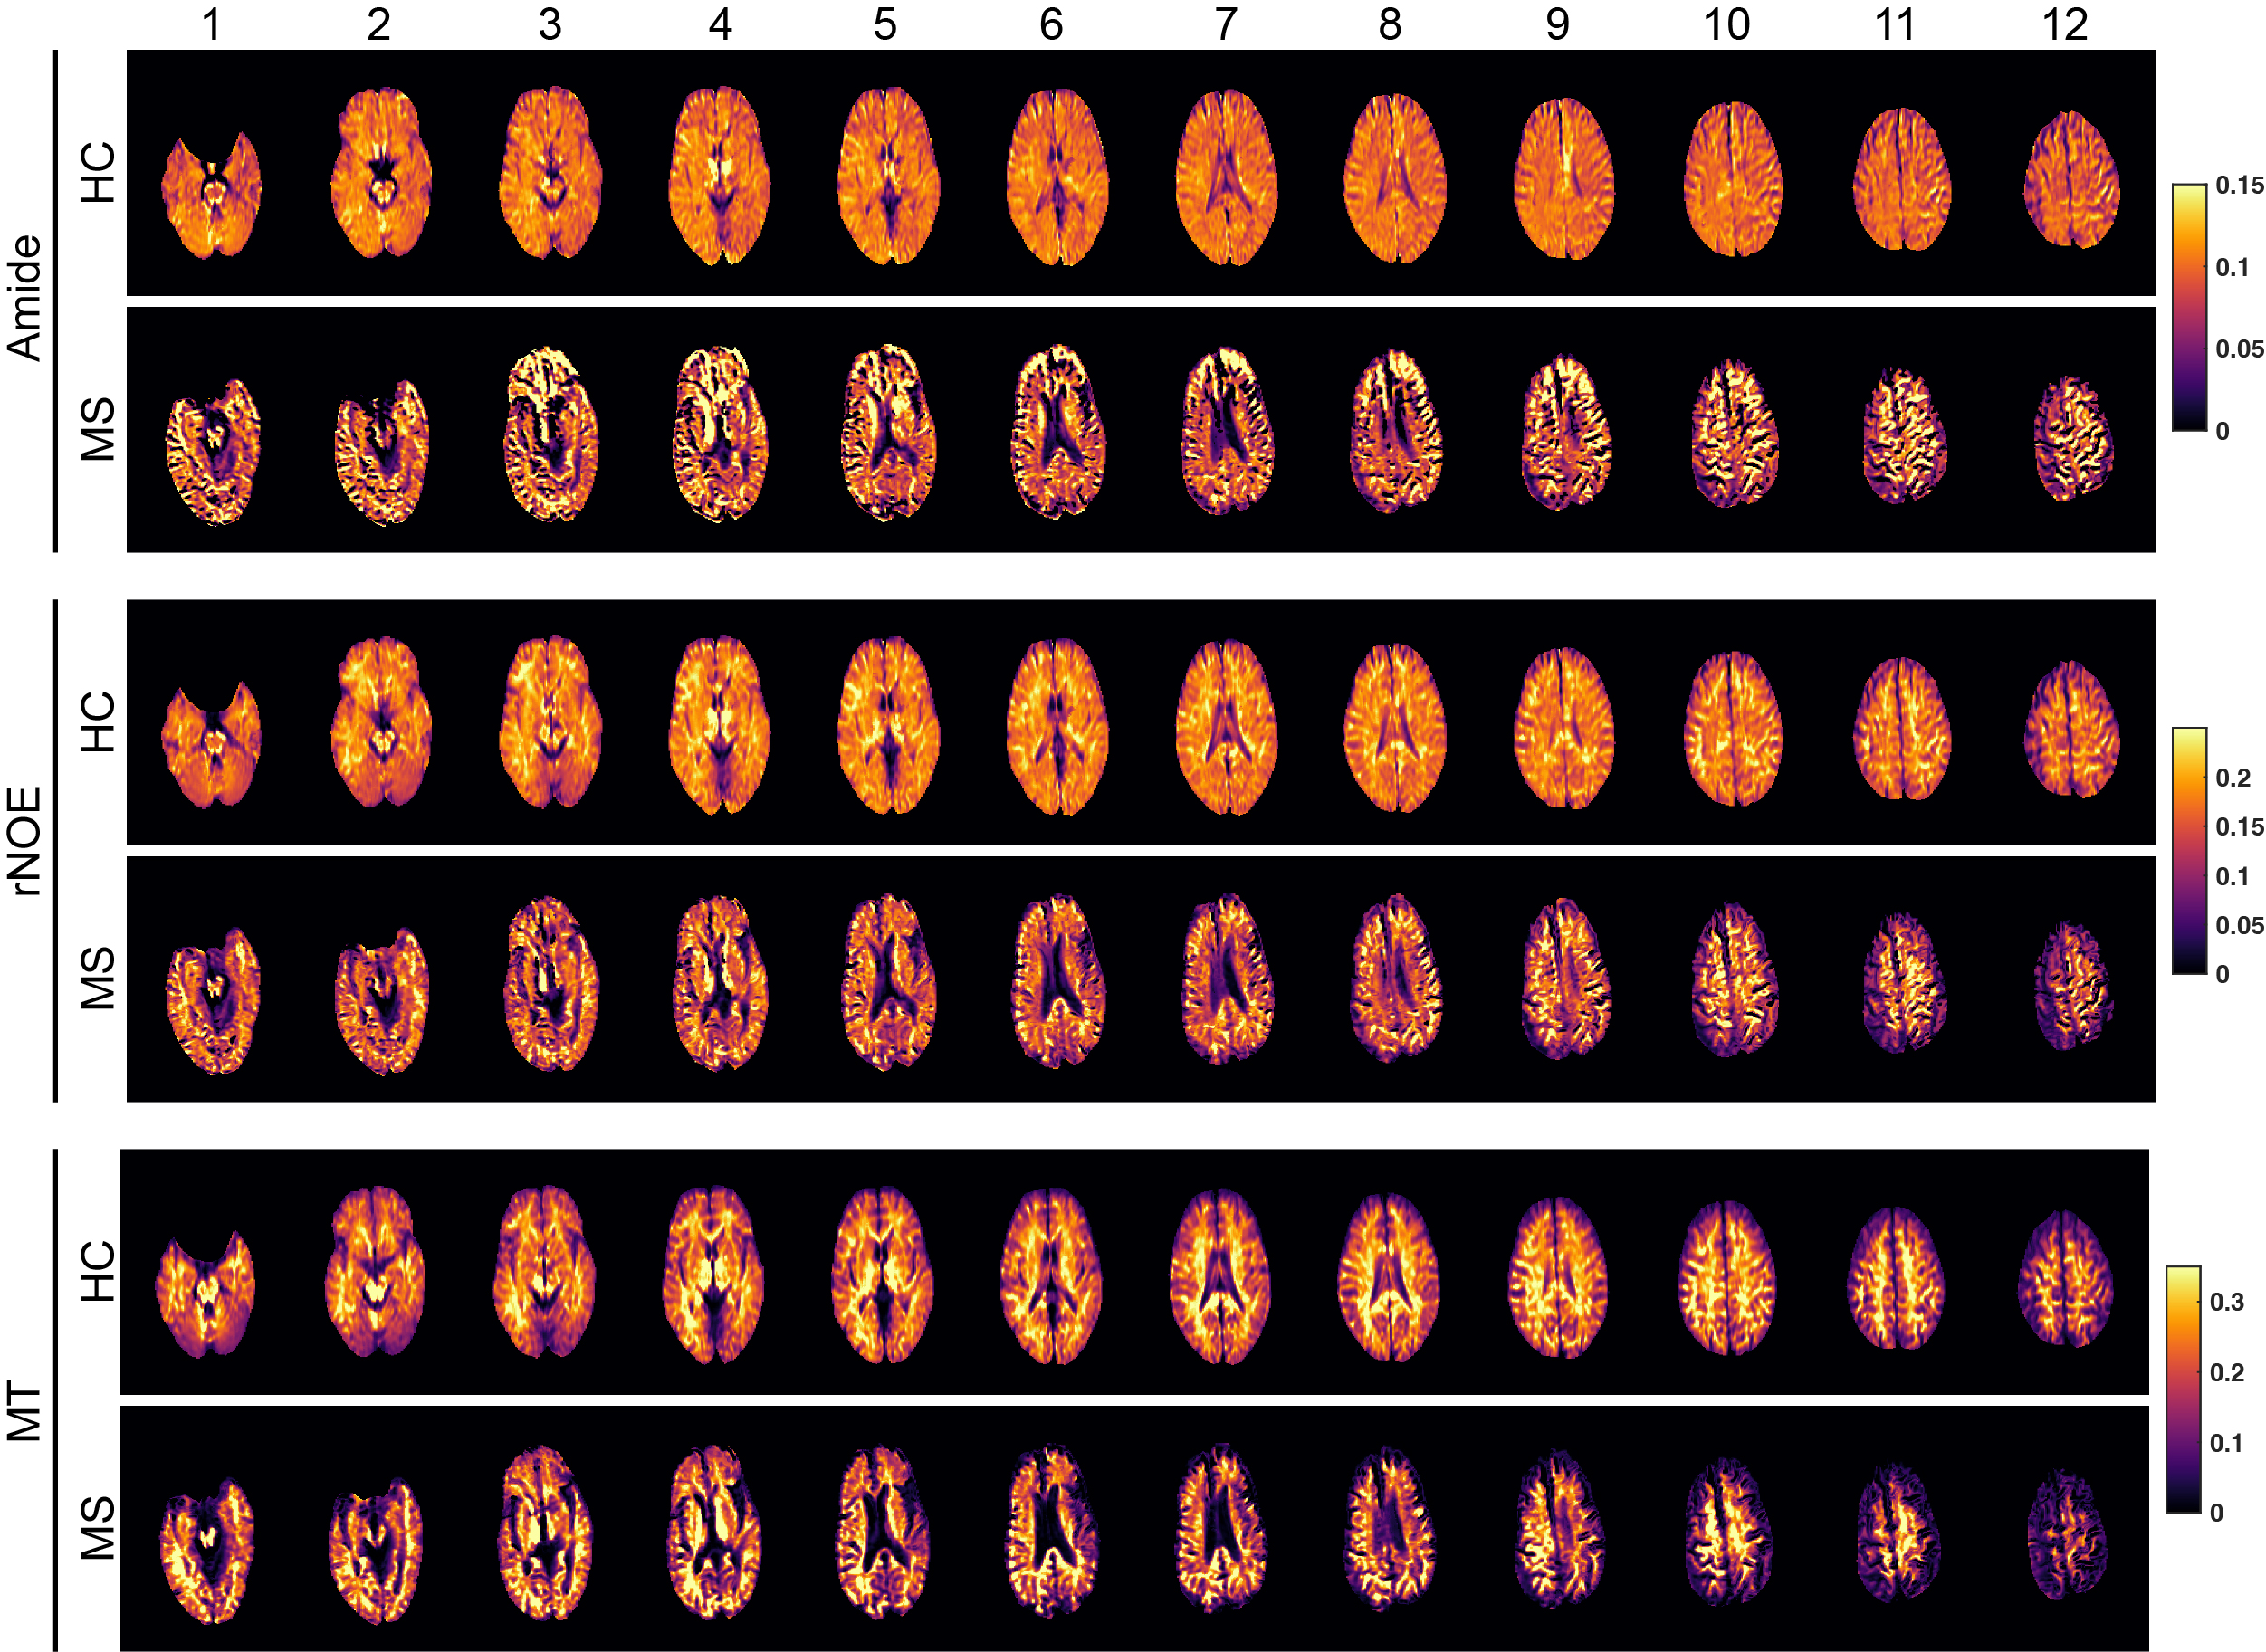
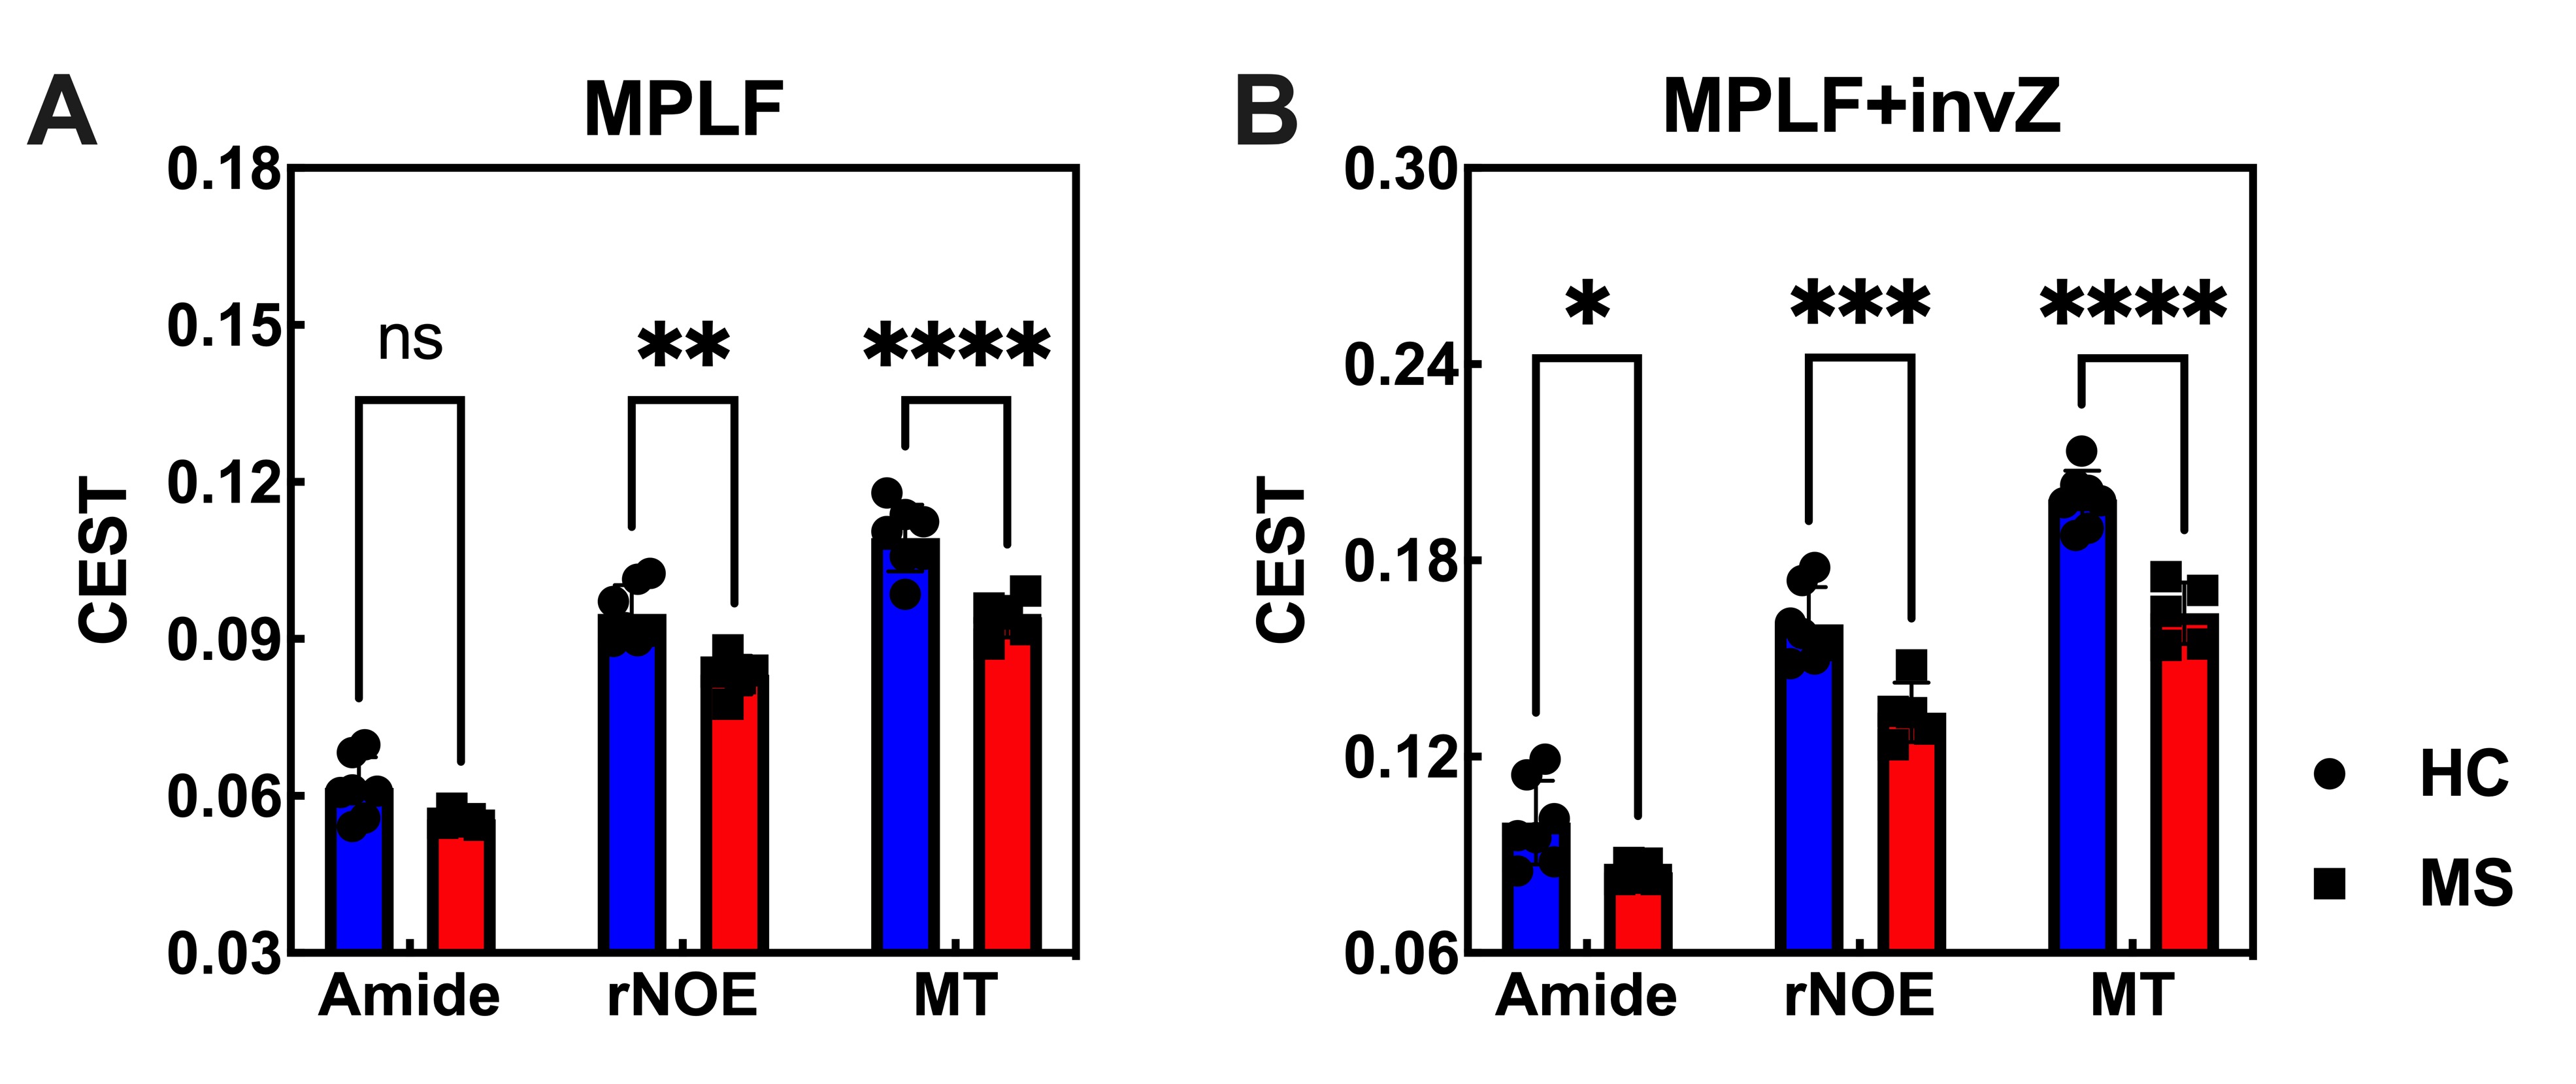
The Z-spectra of MS demonstrated a clear difference from that of HC, as illustrated in Figure 1, suggesting the potential of utilizing CEST MRI as an imaging diagnostic tool for MS. Representative CEST maps, including amide CEST, rNOE and MT, extracted using MPLF for both MS and healthy brains were showed in Figure 2. In comparison to the HC, MS brain exhibited higher heterogeneity and enlarged ventricles in all CEST maps. These observations could be attributed primarily to demyelination and brain atrophy. Similar differences were observed in CEST maps generated using MPLF+invZ (Figure 3). In the group-wise comparison between MS and HC (Figure 4), both rNOE and MT exhibited significantly lower signals in the MS group compared to the HC group (MPLF: P=0.0012 and <0.0001, respectively; MPLF+invZ: P=0.0002 and <0.0001, respectively). The observed decrease in rNOE signal here was consistent with previous findings reported in the literature7. The amide signal in the MS group was also lower than that in the HC group. This difference reached statistical significance in MPLF+invZ (P=0.0401) but not in MPLF (P=0.1428). These findings suggested that the detection of myelin damage in the MS brain can be more sensitive by using rNOE or MT contrasts, as the decrease in lipid content could be one of the dominant factors during this process. Notably, the P values of MPLF+invZ were lower than that of MPLF, indicating that MPLF+invZ had a better ability to differentiate MS from HC. This likely attributed to the capacity of MPLF+invZ to correct DS effect in CEST signals.Conclusion
In this study, we explored the potential of CEST MRI in imaging the human MS brain. CEST MRI exhibited a high sensitivity in distinguishing MS from HC. Specifically, we observed a significant decrease in both rNOE and MT contrasts extracted using MPLF and MPLF+invZ in MS brain compared to HC brain. Amide CEST signal in the MS brain was lower than that of the HC brain, with a significant difference observed in the MPLF+invZ results. Ongoing research with a larger sample size of MS patients is currently underway to validate these observations.Acknowledgements
Authors would like to acknowledge the funding supports from The University of Hong Kong: 109000487, 204610401 and 204610519.References
1. Wallin MT, Culpepper WJ, Nichols E, et al. Global, regional, and national burden of multiple sclerosis 1990–2016: a systematic analysis for the Global Burden of Disease Study 2016. Lancet Neurol. 2019;18(3):269-285.
2. Aung WY, Mar S, Benzinger TL. Diffusion tensor MRI as a biomarker in axonal and myelin damage. Imaging Med. 2013;5(5):427.
3. Duhamel G, Prevost V, Cayre M, et al. Validating the sensitivity of inhomogeneous magnetization transfer (ihMT) MRI to myelin with fluorescence microscopy. Neuroimage. 2019;199:289-303.
4. MacKay AL, Laule C. Magnetic resonance of myelin water: an in vivo marker for myelin. Brain Plast. 2016;2(1):71-91.
5. Ward K, Aletras A, Balaban RS. A new class of contrast agents for MRI based on proton chemical exchange dependent saturation transfer (CEST). J Magn Reson. 2000;143(1):79-87.
6. Van Zijl PC, Yadav NN. Chemical exchange saturation transfer (CEST): what is in a name and what isn't? Magn Reson Med. 2011;65(4):927-948.
7. Huang J, Xu J, Lai JH, et al. Relayed nuclear Overhauser effect weighted (rNOEw) imaging identifies multiple sclerosis. NeuroImage Clin. 2021;32:102867.
8. Dula AN, Asche EM, Landman BA, et al. Development of chemical exchange saturation transfer at 7T. Magn Reson Med. 2011;66(3):831-838.
9. Chen Z, Huang J, Lai JH, Tse KH, Xu J, Chan KW. Chemical exchange saturation transfer MRI detects myelin changes in cuprizone mouse model at 3T. NMR Biomed. 2023:e4937.
10. Lee D-W, Heo H, Woo D-C, Kim JK, Lee D-H. Amide proton transfer-weighted 7-T MRI contrast of myelination after cuprizone administration. Radiology. 2021;299(2):428-434.
11. Zaiss M, Schmitt B, Bachert P. Quantitative separation of CEST effect from magnetization transfer and spillover effects by Lorentzian-line-fit analysis of z-spectra. J Magn Reson. 2011;211(2):149-155.
12. Huang J, Lai JH, Tse K-H, et al. Deep neural network based CEST and AREX processing: Application in imaging a model of Alzheimer’s disease at 3 T. Magn Reson Med. 2022;87(3):1529-1545.
13. Zaiss M, Xu J, Goerke S, et al. Inverse Z-spectrum analysis for spillover-, MT-, and T1-corrected steady-state pulsed CEST-MRI–application to pH-weighted MRI of acute stroke. NMR Biomed. 2014;27(3):240-252.
Figures