2946
Resolution of glial activation in relapsing and primary progressive MS over 2 years with ocrelizumab: longitudinal MR spectroscopy study1MS MRI Research, University of British Columbia, Vancouver, BC, Canada, 2UBC MRI Research, University of British Columbia, Vancouver, BC, Canada, 3Philips Canada, Mississauga, ON, Canada, 4Genentech Inc., A Member of the Roche Group, South San Francisco, CA, United States, 5Medicine, University of British Columbia, Vancouver, BC, Canada, 6School for Biomedical Engineering, University of British Columbia, Vancouver, BC, Canada, 7Physics & Astronomy, University of British Columbia, Vancouver, BC, Canada
Synopsis
Keywords: Multiple Sclerosis, Spectroscopy
Motivation: Need for treatment tracking biomarkers in multiple sclerosis (MS).
Goal(s): To demonstrate increased sensitivity to metabolite changes in a more homogeneous MRS voxel in RMS and to investigate whether PMS exhibits a similar trend with treatment.
Approach: Single voxel spectroscopy to examine metabolite changes in a large white matter region over time in ocrelizumab treated MS patients compared to single timepoint healthy controls.
Results: Marker of glial cell density and activation decreased over 2 years of treatment in both relapsing (similar to previously study) and progressive MS. A weak correlation was observed between the glial marker and measure of disability at baseline.
Impact: Magnetic resonance spectroscopy (MRS) offers biomarkers of glial density/activation that may solve a clinical unmet need to track the neuroinflammatory response to multiple sclerosis (MS) therapies. This study demonstrates how MRS biomarkers change with treatment in MS white matter.
Introduction
Multiple sclerosis (MS) is a demyelinating disease that affects the central nervous system and causes lesions in the brain that are visible on conventional MRI. Beyond these areas of focal damage there is also evidence of diffuse white matter changes not visible on conventional MRI in the normal appearing white matter (NAWM). Magnetic resonance spectroscopy (MRS) can be used to determine the concentration levels of different metabolites in the brain and has been used to investigate biochemical changes in MS1. Ocrelizumab (OCR) is a B-cell depleting monoclonal antibody that reduces new focal inflammatory lesions and confirmed disability progression in both relapsing MS (RMS) and primary progressive MS (PPMS)2-4. Using MRS, we recently found stable N-acetylaspartate (NAA, a marker of neuron-oligodendrocyte coupling) and a significant decrease in myo-inositol (mI, a marker for neuroinflammation) in RMS over 2 years of treatment with OCR5. The goals here were to demonstrate increased sensitivity to metabolite changes in a more homogeneous MRS voxel in RMS and to investigate whether PMS exhibits a similar trend with OCR treatment.Methods
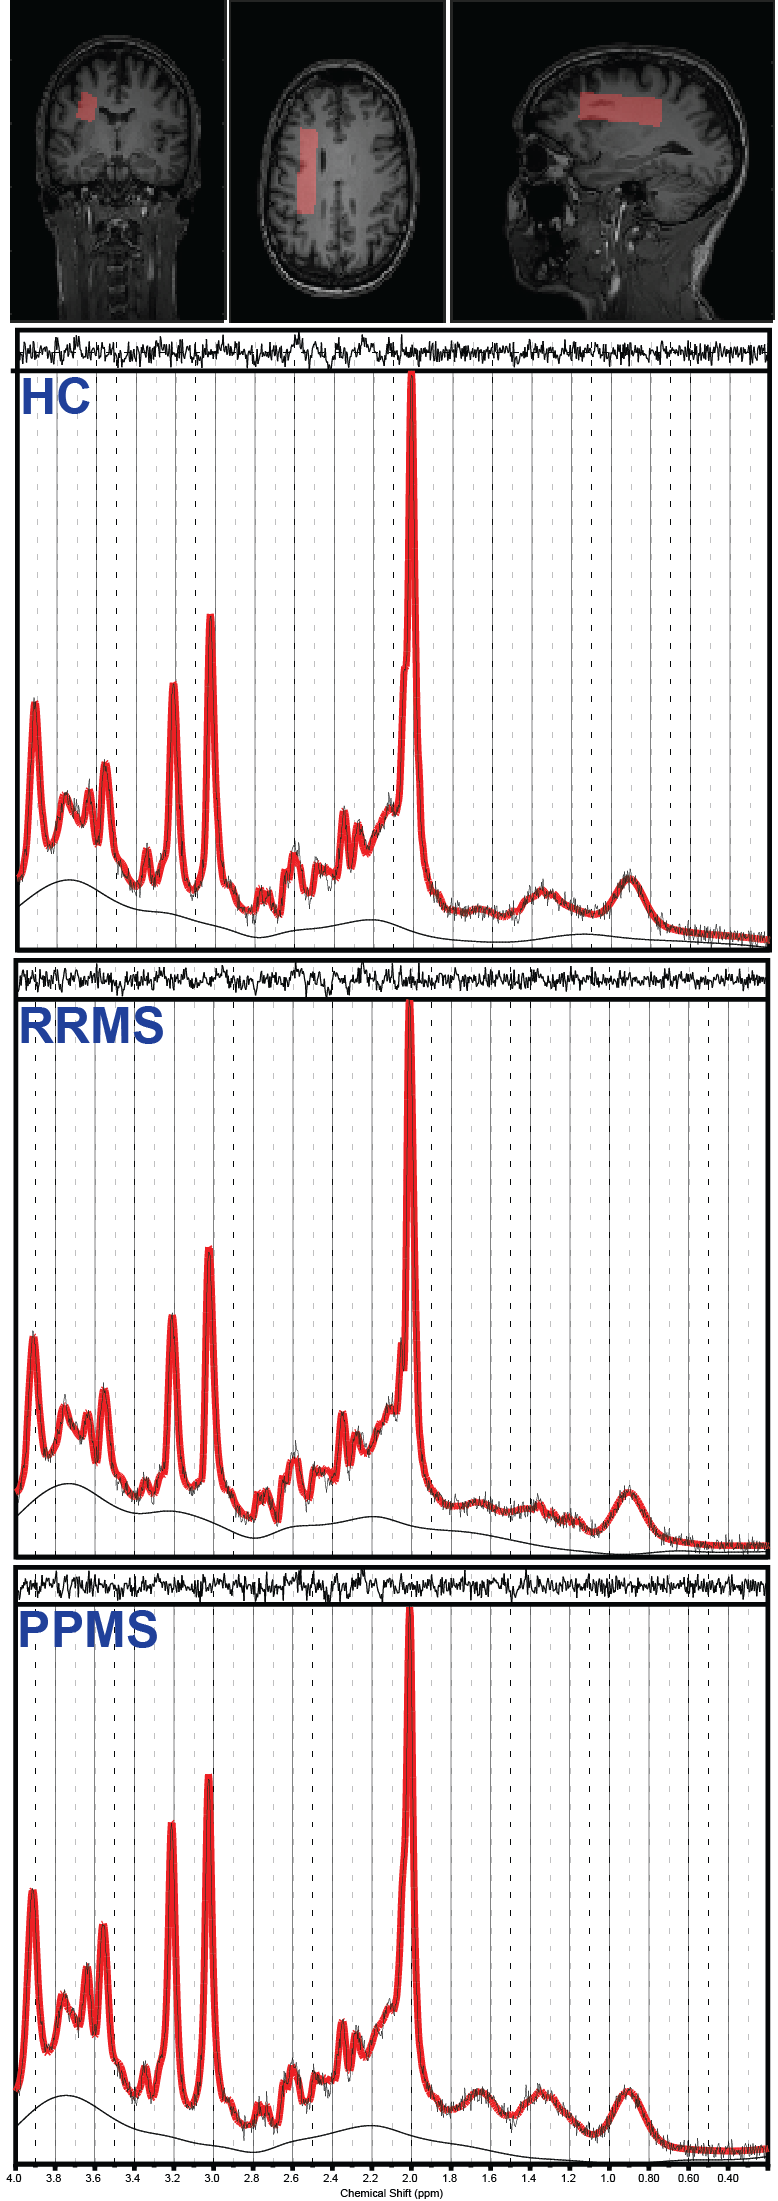
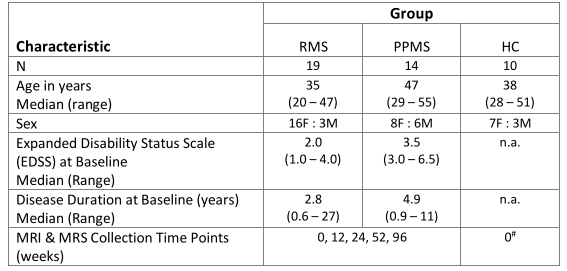
This study was a substudy of a multi-centre clinical trial (OBOE; ML29966)6. Participant demographics are given in table 1. Participants underwent MRI scans which included MRS data acquisition at baseline (week 0) and weeks 12, 24, 52, and 96 post treatment with OCR and healthy controls (HC) were scan-rescanned at week 0. All subjects were scanned on a Philips 3.0 T Achieva MRI system (Best, The Netherlands) with structural imaging including 3D MP-RAGE, Proton Density weighted (PDW), and post-Gd FLAIR (in MS participants) acquisitions for tissue and lesion segmentation. MRS data was collected using Point RESolved Spectroscopy (PRESS) localization: voxel size = 65x15x20mm3 in lateral NAWM (shown in Figure 1); TE/TR=31/4000 ms; NSA=32; water suppression = excitation option; 2nd order shimming. 3D MP-RAGE images were segmented using FSL FAST7,8. Lesion masks were generated with a semi-automated routine using the PDW and post-Gd FLAIR images9. The MRS voxel was mapped onto the segmentation maps and the voxel tissue fractions were extracted. Averaged metabolite spectra were fit with LCModel (version 6.3-1H)10,11. Absolute metabolite concentrations were calculated using the water scaling approach12.Results
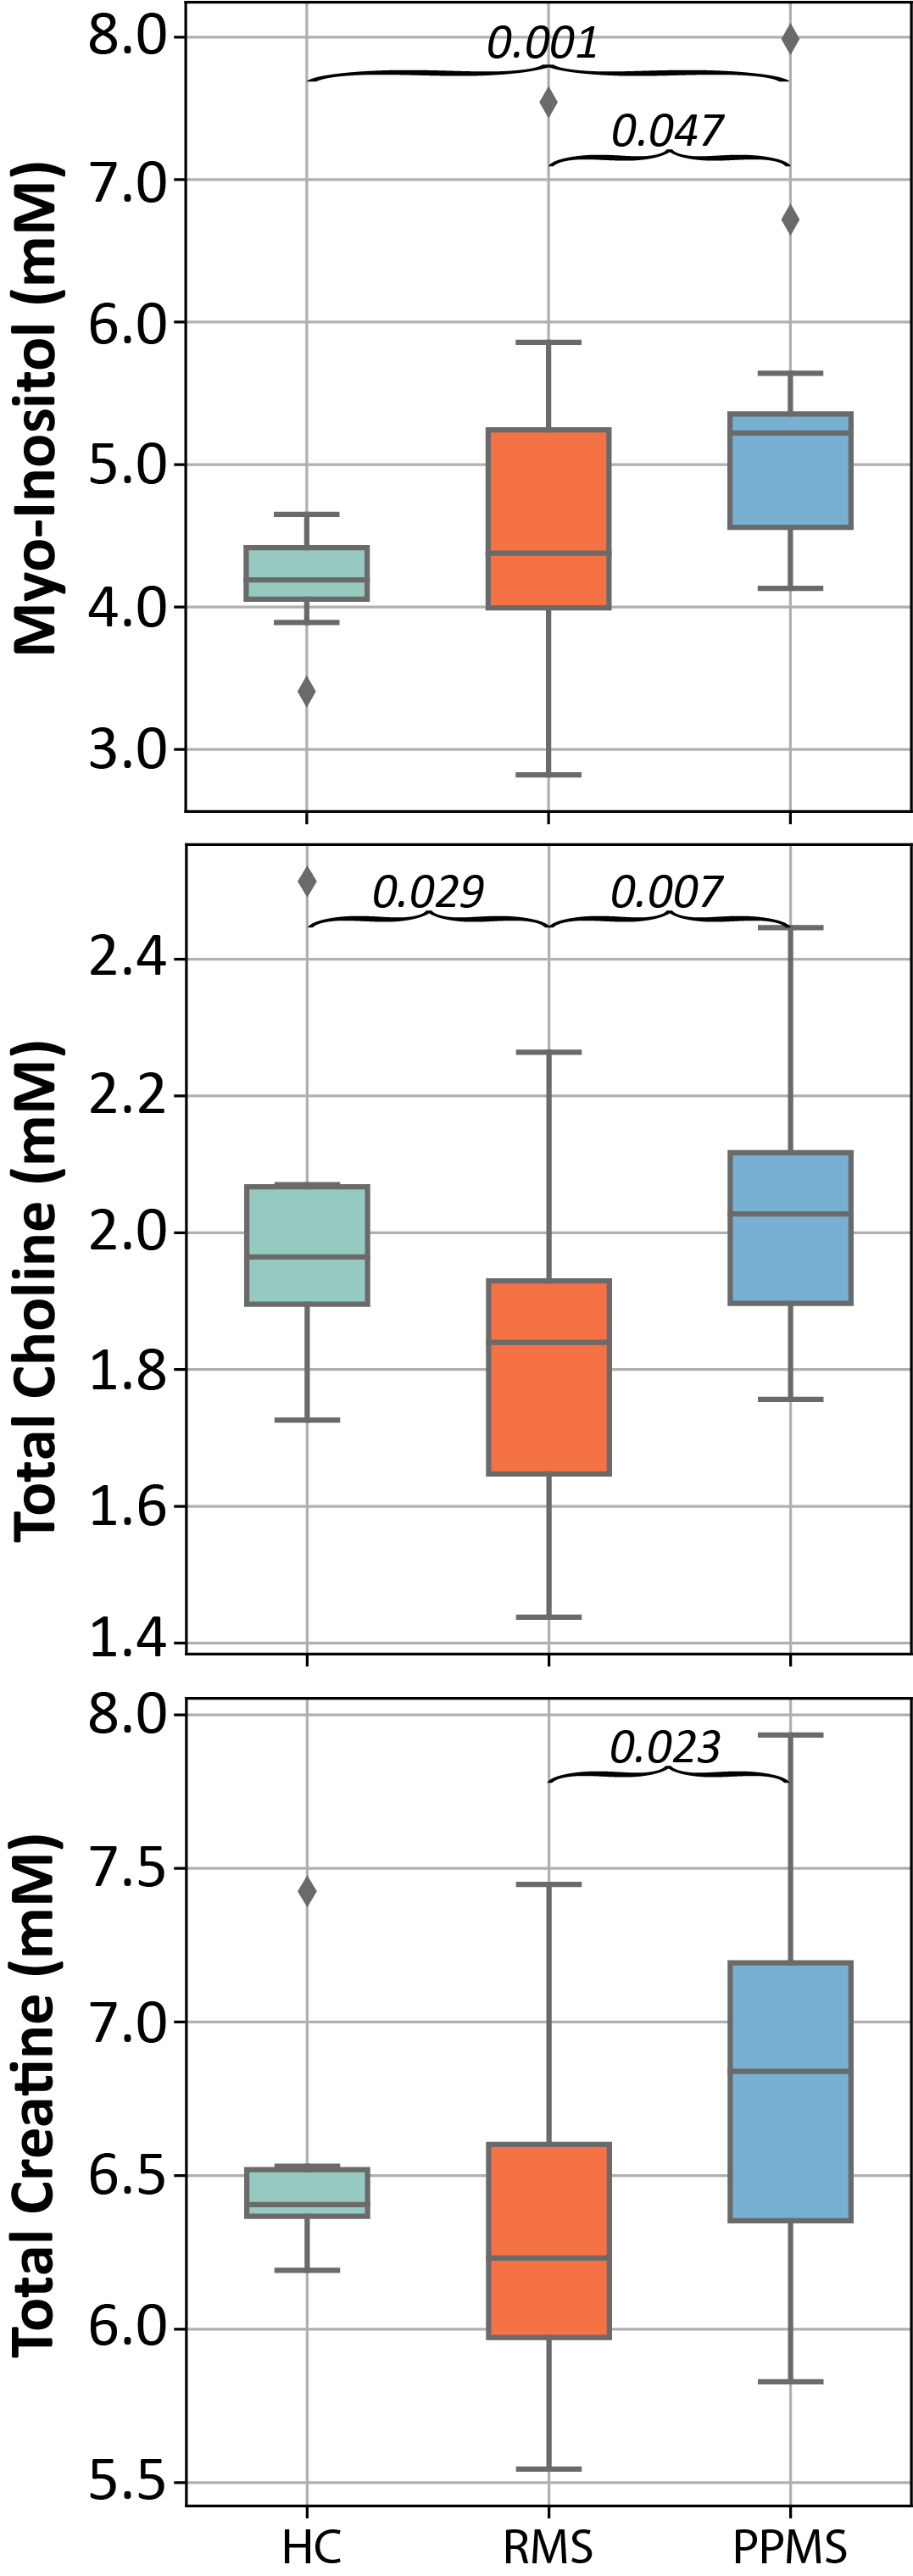
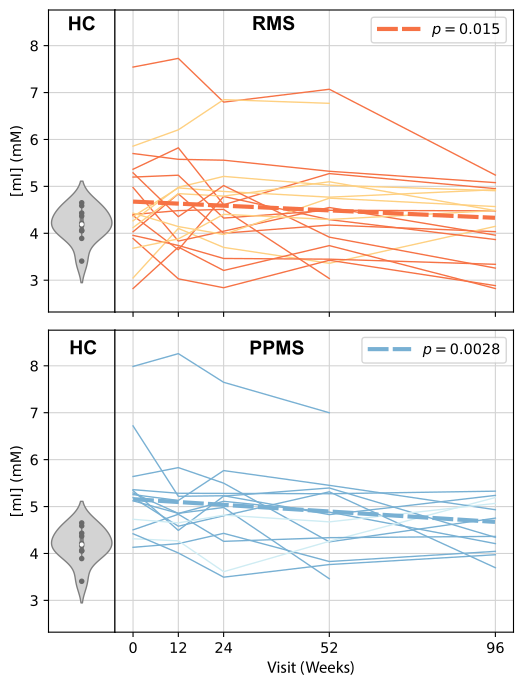
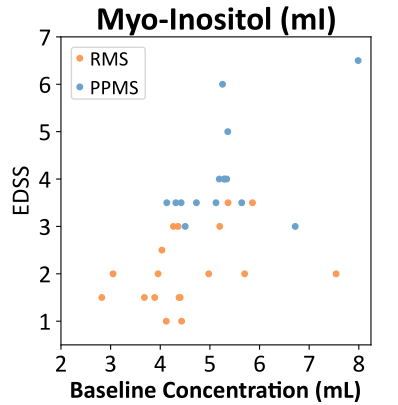
Subject study retention was high with 17/19 RMS and 12/14 PPMS completing all visits. All output spectra were high quality (SNR>25 and FWHM<8.8 Hz) and no data was rejected during QA review. Sample MRS spectra for each subject group are given in Figure 1. Voxel fractions of grey matter (GM), white matter (WM), cerebrospinal fluid (CSF) and lesion did not change over time in any of the cohorts. Baseline PPMS mI values were significantly higher than HC and RMS (Kruskal-Wallis p=0.009; PPMS vs HC p=0.001; PPMS vs RMS p=0.047), RMS was not different than HC (p=0.422). Baseline mI exhibited weak correlations with EDSS across the entire MS cohort (r2 = 0.32, Figure 2). The linear mixed effects model estimated the rate of mI decline over 2 years was -7.4% (-13.4 to -1.4 %) for RMS (p=0.015), and -9.4% (-15.5 to -3.2 %) for PPMS (p=0.0028), Figure 3. Other metabolites did not display trends with time over the follow-up period (p>0.20).Discussion
We found mI decreased over 2 years of treatment with OCR in NAWM. Since mI is considered to be a glial cell marker, declining mI suggests reduced microglial density or activation, which is in line with previous findings in MS mouse models treated with anti-CD20 therapies13. A weak correlation between mI and EDSS at baseline suggested that higher active inflammation is related to more severe disability. Those MS participants with higher mI at baseline as compared to HC exhibiting a greater decrease in mI over the two years. We found stable NAA over time consistent with our previous RMS5 study but not with previous MS literature which found decreased NAA in newly diagnosed RRMS using MRS imaging in NAWM14.Conclusion
This study supports the use of absolute concentration of mI as a biomarker in MS studies.Acknowledgements
We gratefully acknowledge support from UBC MRI Research, patients with MS, and volunteers.
This OBOE clinical trial was funded by Genentech a subsidiary of F. Hoffmann-La Roche Ltd. The MRS sub-study was an independent investigator initiated study supported in part by Genentech and the UBC MSMRI Research Group. ELM received salary support from Philips Canada.
References
1. Swanberg, K.M., et al., Quantifying the Metabolic Signature of Multiple Sclerosis by in vivo Proton Magnetic Resonance Spectroscopy: Current Challenges and Future Outlook in the Translation From Proton Signal to Diagnostic Biomarker. Frontiers in Neurology, 2019. 10: p. 1173.
2. Kappos, L., et al., Ocrelizumab in relapsing-remitting multiple sclerosis: a phase 2, randomised, placebo-controlled, multicentre trial. Lancet, 2011. 378(9805): p. 1779-87.
3. Hauser, S.L., et al., Ocrelizumab versus Interferon Beta-1a in Relapsing Multiple Sclerosis. N Engl J Med, 2017. 376(3): p. 221-234.
4. Hauser, S.L., et al., Five years of ocrelizumab in relapsing multiple sclerosis: OPERA studies open-label extension. Neurology, 2020. 95(13): p. e1854-e1867
5. MacMillan, E.L., et al., Magnetic resonance spectroscopy evidence for declining gliosis in MS patients treated with ocrelizumab versus interferon beta-1a. Mult Scler J Exp Transl Clin, 2019. 5(4): p. 2055217319879952.
6. https://classic.clinicaltrials.gov/ct2/show/NCT02688985
7. Zhang, Y., M. Brady, and S. Smith, Segmentation of brain MR images through a hidden Markov random field model and the expectation-maximization algorithm. IEEE transactions on medical imaging, 2001. 20(1): p. 45-57.
8. Jenkinson, M., et al., FSL. Neuroimage, 2012. 62(2): p. 782-90.
9. McAusland, J., et al., Optimizing the use of radiologist seed points for improved multiple sclerosis lesion segmentation. IEEE Trans Biomed Eng, 2010. 57(11).
10. Provencher, S.W., Estimation of metabolite concentrations from localized in vivo proton NMR spectra. Magn Reson Med, 1993. 30(6): p. 672-9.
11. Provencher, S., LCModel and LCMgui User’s Manual. 2021: http://lcmodel.ca.
12. MacMillan, E.L., et al., Progressive multiple sclerosis exhibits decreasing glutamate and glutamine over two years. Mult Scler, 2016. 22(1): p. 112-6.
13. Anthony, D.C., et al., Anti-CD20 inhibits T cell-mediated pathology and microgliosis in the rat brain. Ann Clin Transl Neurol, 2014. 1(9): p. 659-69.
14. Kirov, I.I., et al., Serial proton MR spectroscopy of gray and white matter in relapsing-remitting MS. Neurology, 2013. 80(1): p. 39-46.
Figures