2945
Increased Cerebral Lactate-to-Pyruvate Ratio in Primary Progressive Multiple Sclerosis using Hyperpolarized Pyruvate MRI.1Oxford Centre for Clinical Magnetic Resonance Research, University of Oxford, Oxford, United Kingdom, 2Nuffield Department of Clinical Neurosciences, University of Oxford, Oxford, United Kingdom, 3Department of Radiology, Oxford University Hospitals, Oxford, United Kingdom, 4Department of Oncology, Oxford University Hospitals, Oxford, United Kingdom, 5Department of Physiology, Anatomy and Genetics, University of Oxford, Oxford, United Kingdom, 6Department of Radiology, Cambridge University Hospitals, Cambridge, United Kingdom, 7GE Healthcare, Munich, Germany
Synopsis
Keywords: Multiple Sclerosis, Multiple Sclerosis, Hyperpolarized MR (Non-Gas)
Motivation: There remains an absence of imaging modalities capable of probing the neuroinflammatory processes that precede the well-defined brain structural changes in Primary Progressive Multiple Sclerosis (PPMS).
Goal(s): We investigated whether hyperpolarized [1-13C]pyruvate MRI can delineate alterations in cerebral glycolytic and oxidative metabolism between treatment naïve PPMS and healthy volunteers.
Approach: Two treatment naïve PPMS patients and two sex matched healthy volunteers underwent [1-13C]pyruvate MRI to characterise cerebral glycolytic and oxidative metabolism.
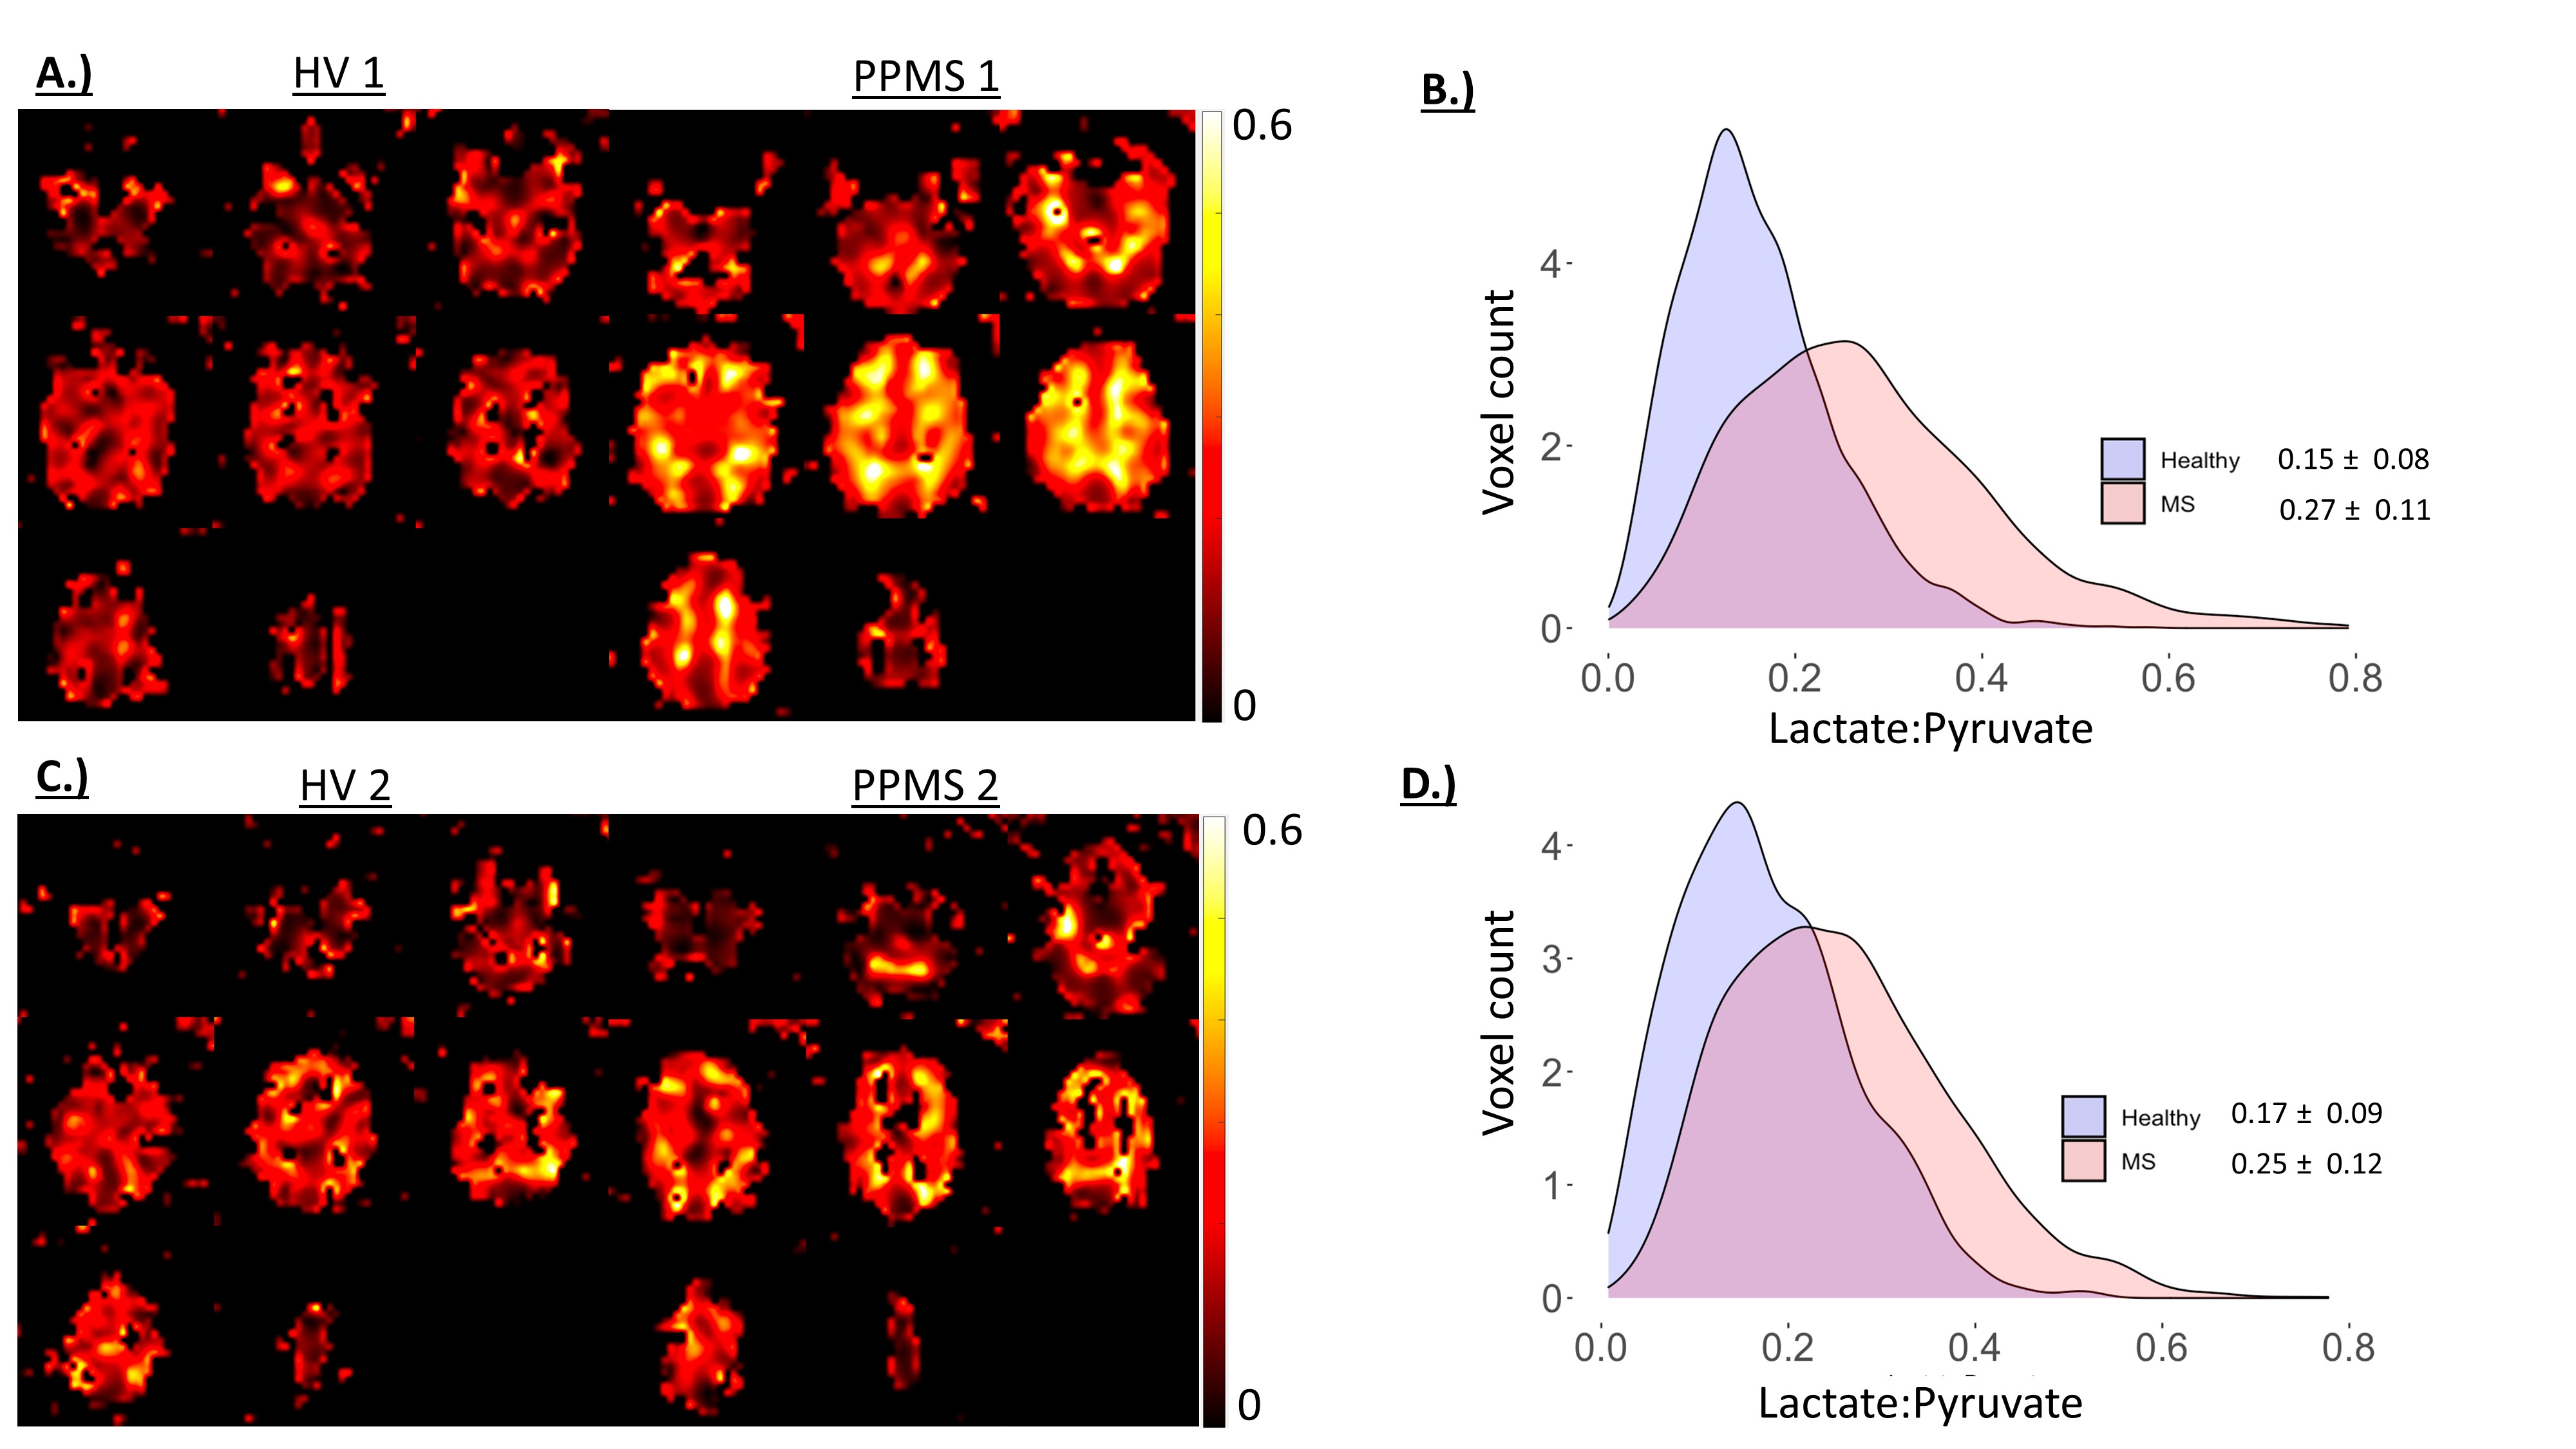
Results: A global increase in [1-13C]lactate: [1-13C]pyruvate was found in both PPMS patients relative to sex-matched healthy controls (0.23 ± 0.12 vs 0.16 ± 0.08). The 13C bicarbonate:[1-13C]pyruvate ratio was no different.
Impact: These preliminary findings demonstrate a global increase in cerebral glycolytic metabolism in treatment naïve PPMS relative to age and gender matched healthy controls. This may reflect diffuse neuroinflammatory processes and suggests [1-13C]pyruvate MRI could be used to monitor disease activity.
Introduction
Primary Progressive Multiple Sclerosis (PPMS) is a clinical subtype of MS presenting in 10-15% of patients which is characterised by irreversible accumulation of neurological symptoms and disability[1]. Conventional MRI techniques, such as T2 -FLAIR and T1-weighted imaging, enable the longitudinal quantification of lesion volume, thought to reflect the extent of focal inflammatory processes, and regional brain volumes, enabling quantitation of neuronal atrophy. The clinical usefulness of these readouts is exemplified by their inclusion as secondary endpoints in MS clinical trials[2]. However, they are limited to enabling the retrospective quantification of gross CNS damage. The development of imaging modalities capable of detecting inflammatory activity preceding structural CNS alterations are required to aid the clinical management of PPMS. Hyperpolarized [1-13C]pyruvate MRI involves the intravenous administration of a [1-13C]pyruvate bolus to probe real-time transfer of the 13C label through lactate dehydrogenase (LDH) and pyruvate dehydrogenase (PDH). The technique has been utilized to probe cerebral metabolism in healthy volunteers[3], brain tumours patients[4], healthy ageing[5] and in a murine model of MS, where increased[1-13C]lactate production from pro-inflammatory mononuclear phagocytes was reported[6]. Therefore, hyperpolarized [1-13C]pyruvate MRI may be useful for probing markers of metabolic dysregulation indicative of immune activation in PPMS[7].Methods
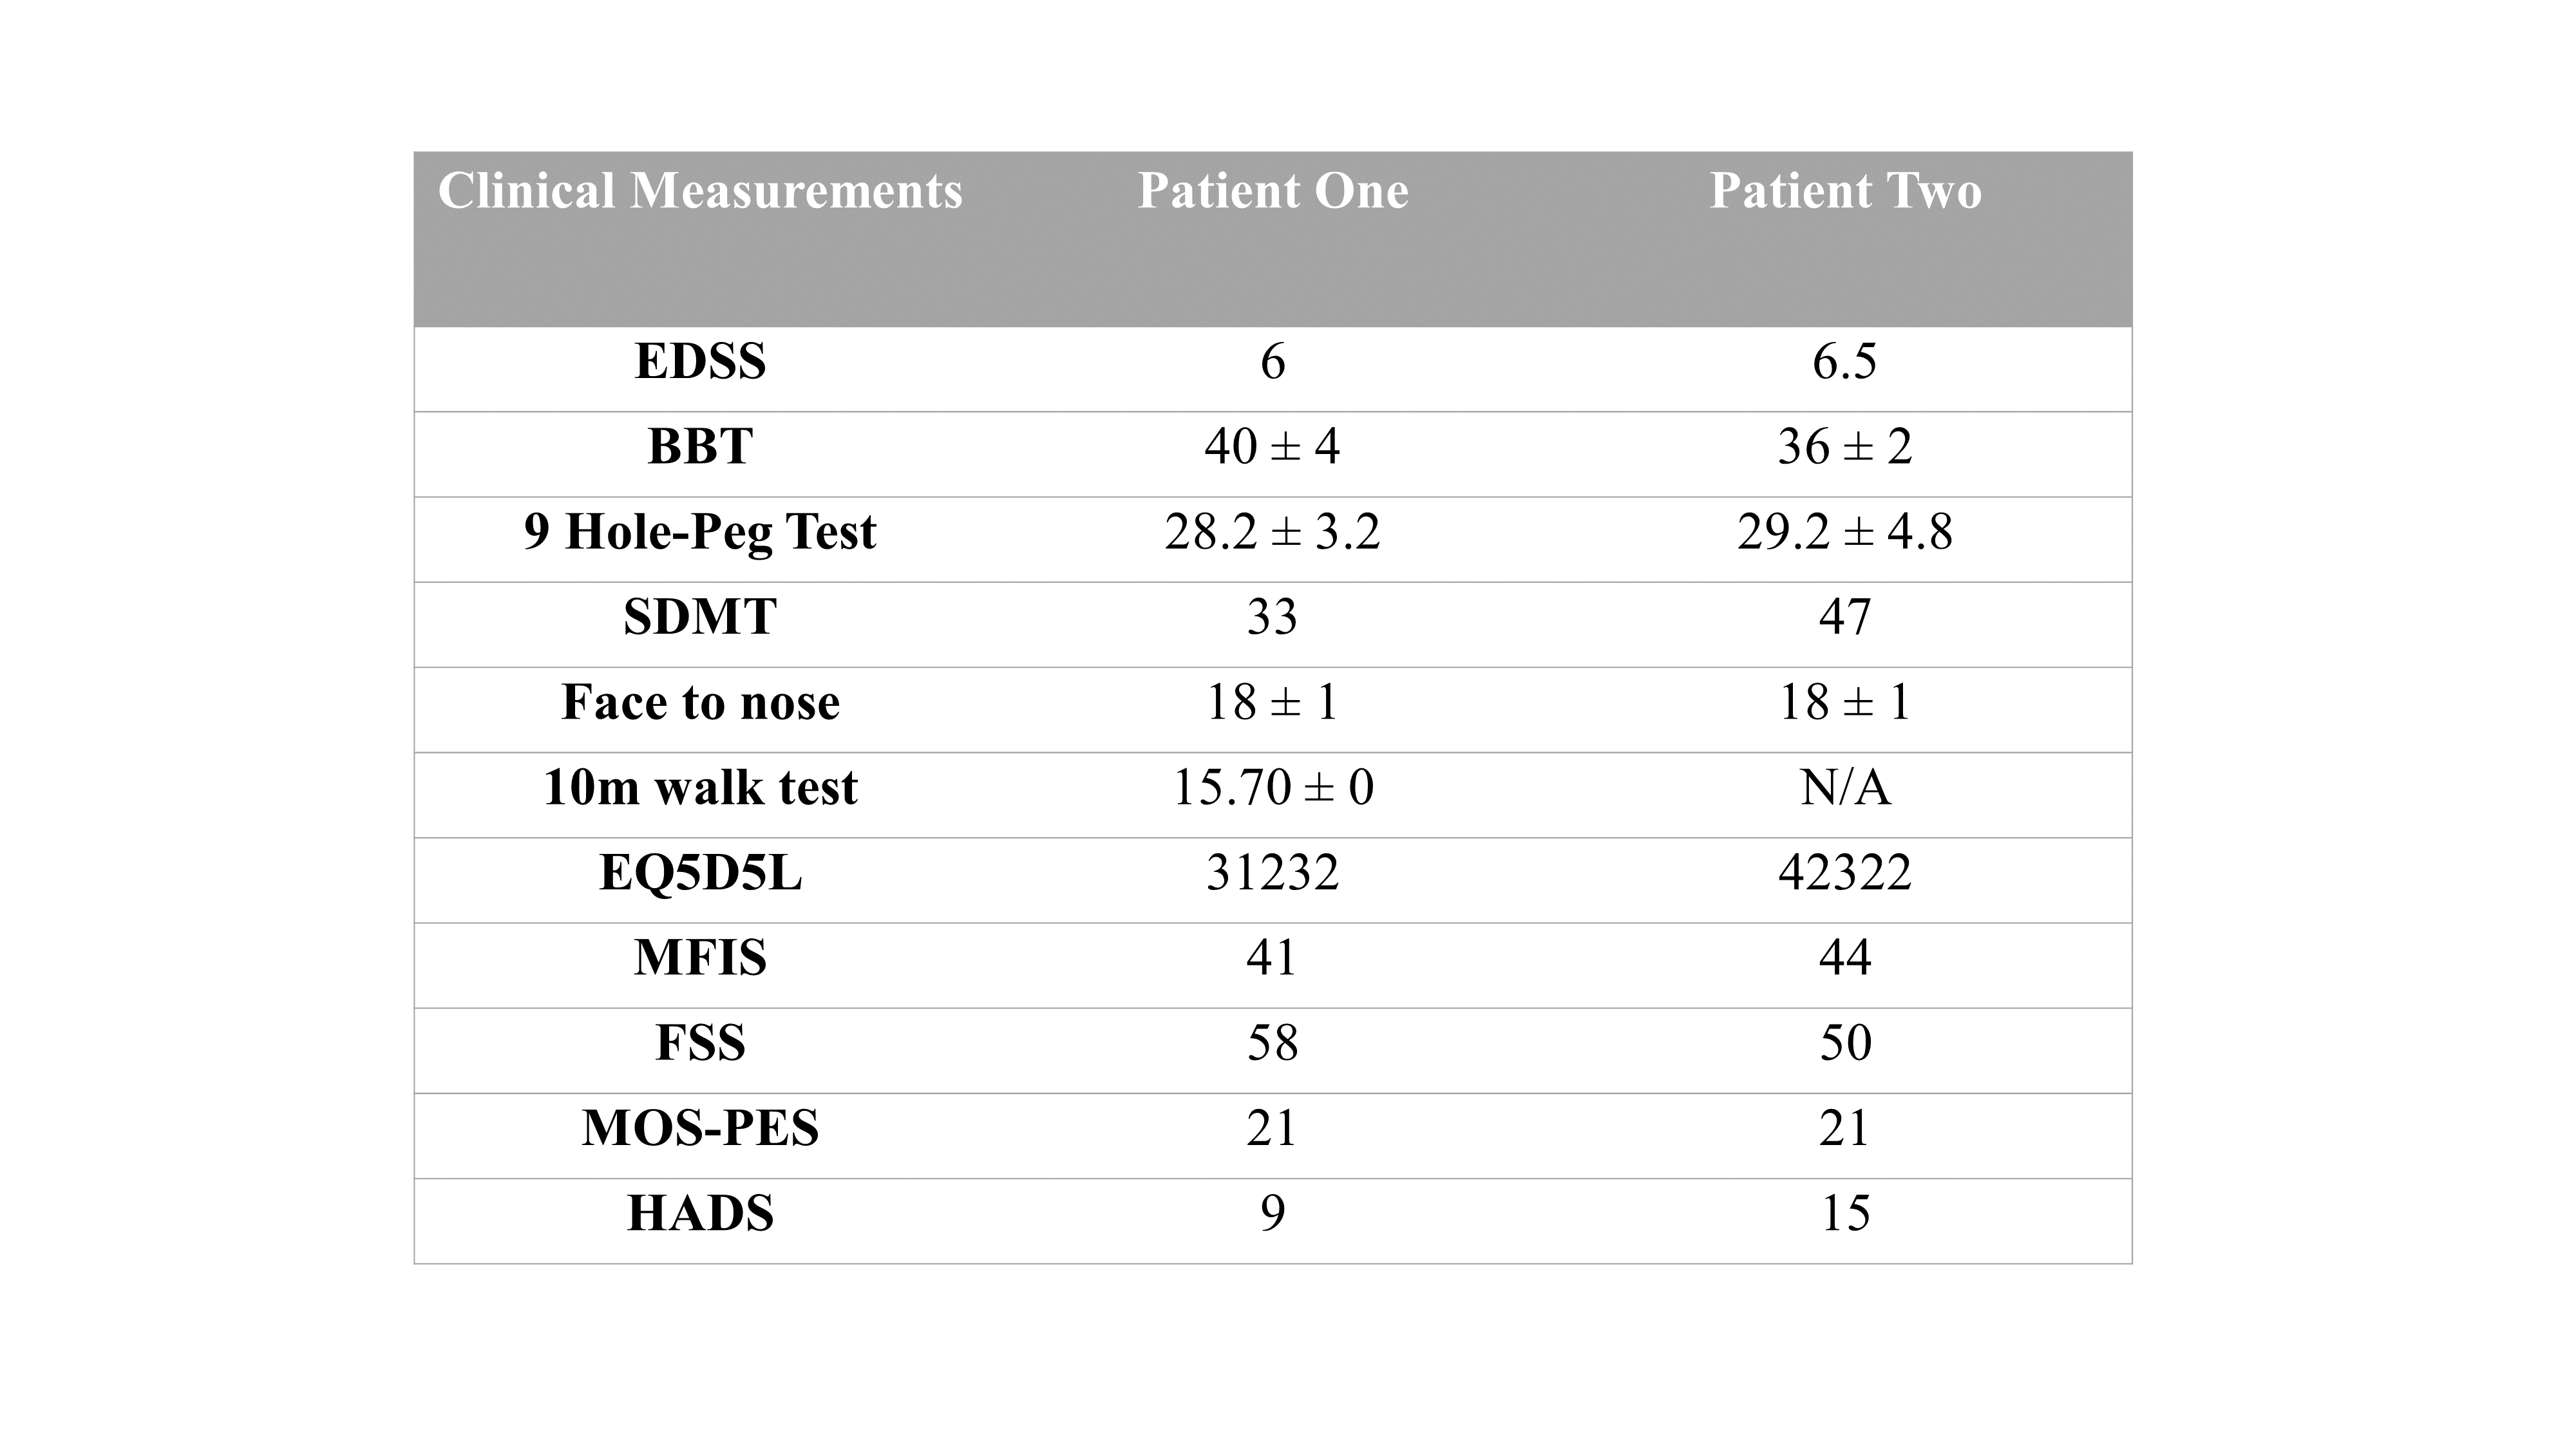
Two treatment naïve male subjects with PPMS (59±3 years) and two sex-matched healthy volunteers (HV, 66±2 years) were recruited and gave written, informed, consent to participate in the study, which was approved by a local ethics committee. Subjects with PPMS underwent a full clinical assessment prior to imaging (Table 1). All participants were scanned after intravenous injection of 0.4 ml/kg of 250mM hyperpolarized sodium [1-13C]pyruvate following polarization for ~4 hours in a SPINLab hyperpolarizer (GE Healthcare, WI). Images were acquired on a 3T GE Premier (GE Healthcare, WI) using a dual-tuned 1H/13C birdcage head coil (Rapid Biomedical, Germany). The imaging protocol included a spectral-spatial multi-slice spiral sequence (16x16 acquisition matrix, 240x240mm FOV, eight 20mm slices, 32x32 reconstruction matrix, planned ACPC, Temporal Resolution=4s) with pyruvate (Flip Angle (FA)py:5o), lactate (FAlac:15o) and bicarbonate (FAbic:60o) images acquired. Clinical imaging, using a 21-channel head and neck coil, comprised: T1-weighted volumetric pre- and post-contrast (0.1mL/kg, Dotarem) 3D MPRAGE, T2-FLAIR post contrast, Arterial Spin Labelling, Susceptibility Weighted, Diffusion Tensor (b=0, 1000, 32 directions), T2-weighted and Phase Sensitive Inversion Recovery imaging.The spectral-spatial imaging data was postprocessed using in-house written MATLAB scripts to generate time-summed metabolite maps ([1-13C]pyruvate, [1-13C]lactate and 13C bicarbonate) which were used to calculate metabolite:[1-13C]pyruvate maps, with histogram analysis performed for ratio maps to provide an indication of brain glycolytic and oxidative metabolism. All data are presented as Mean±Standard Deviation.
Results
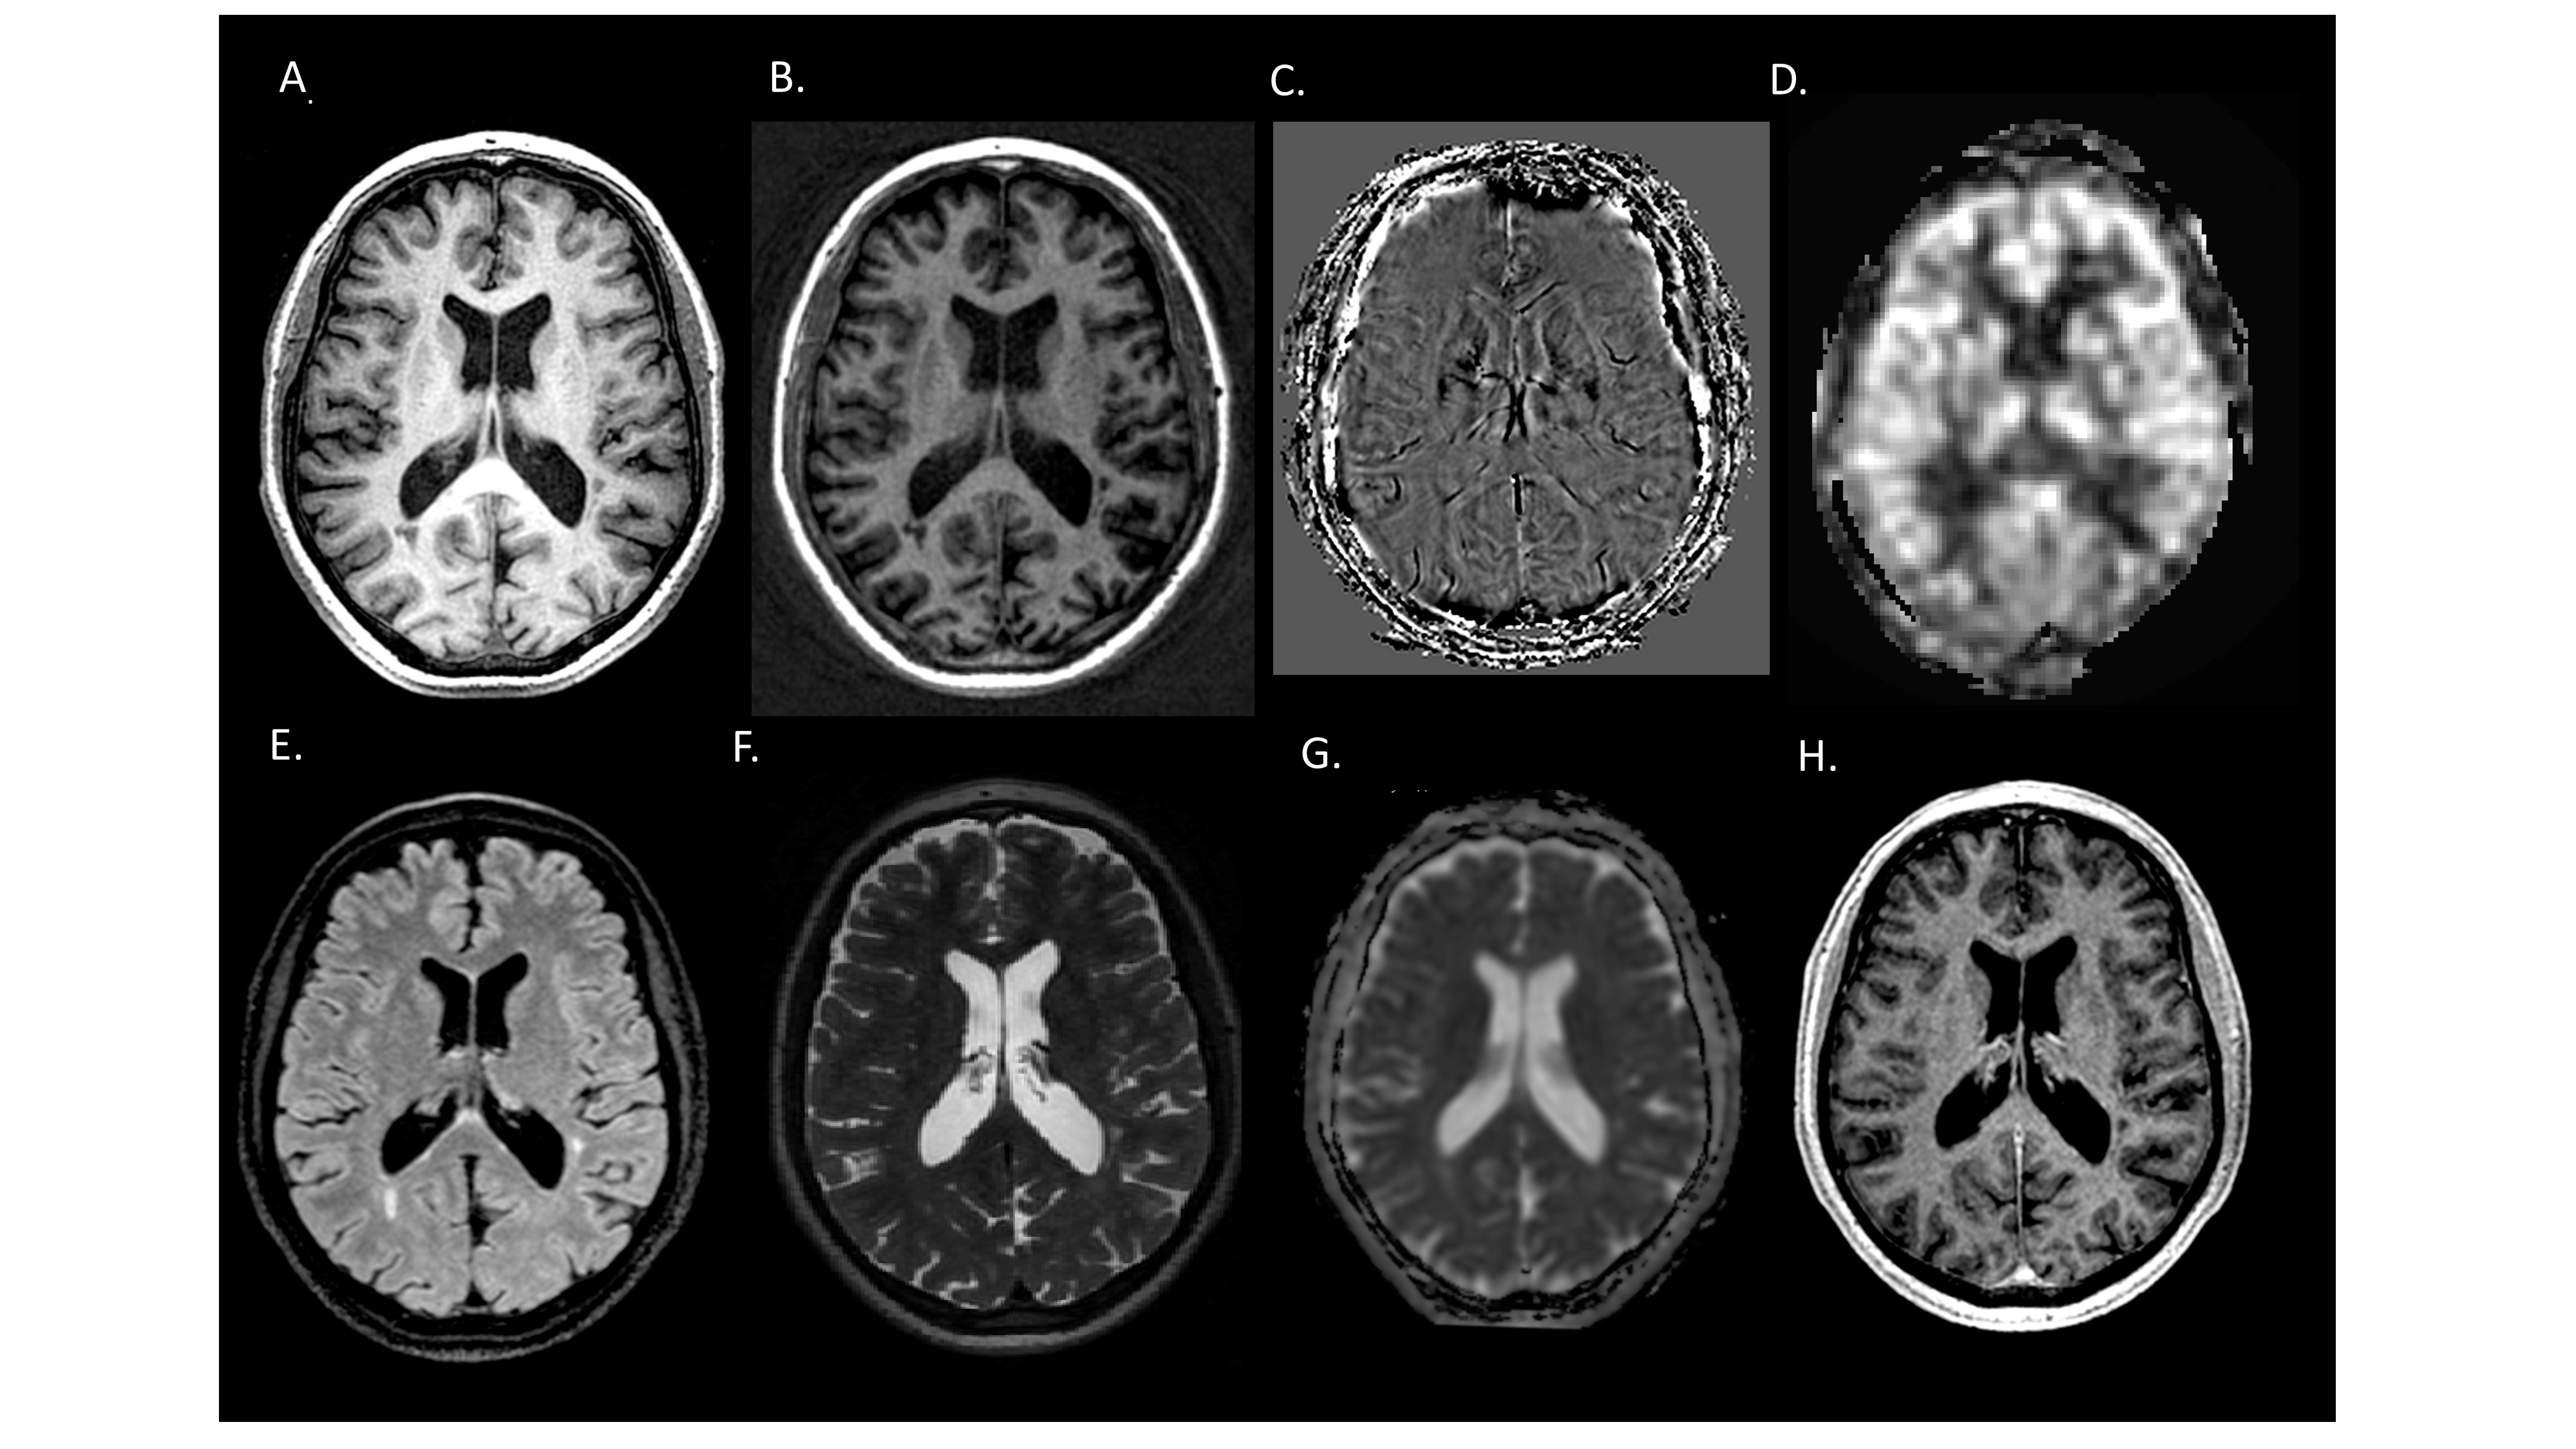
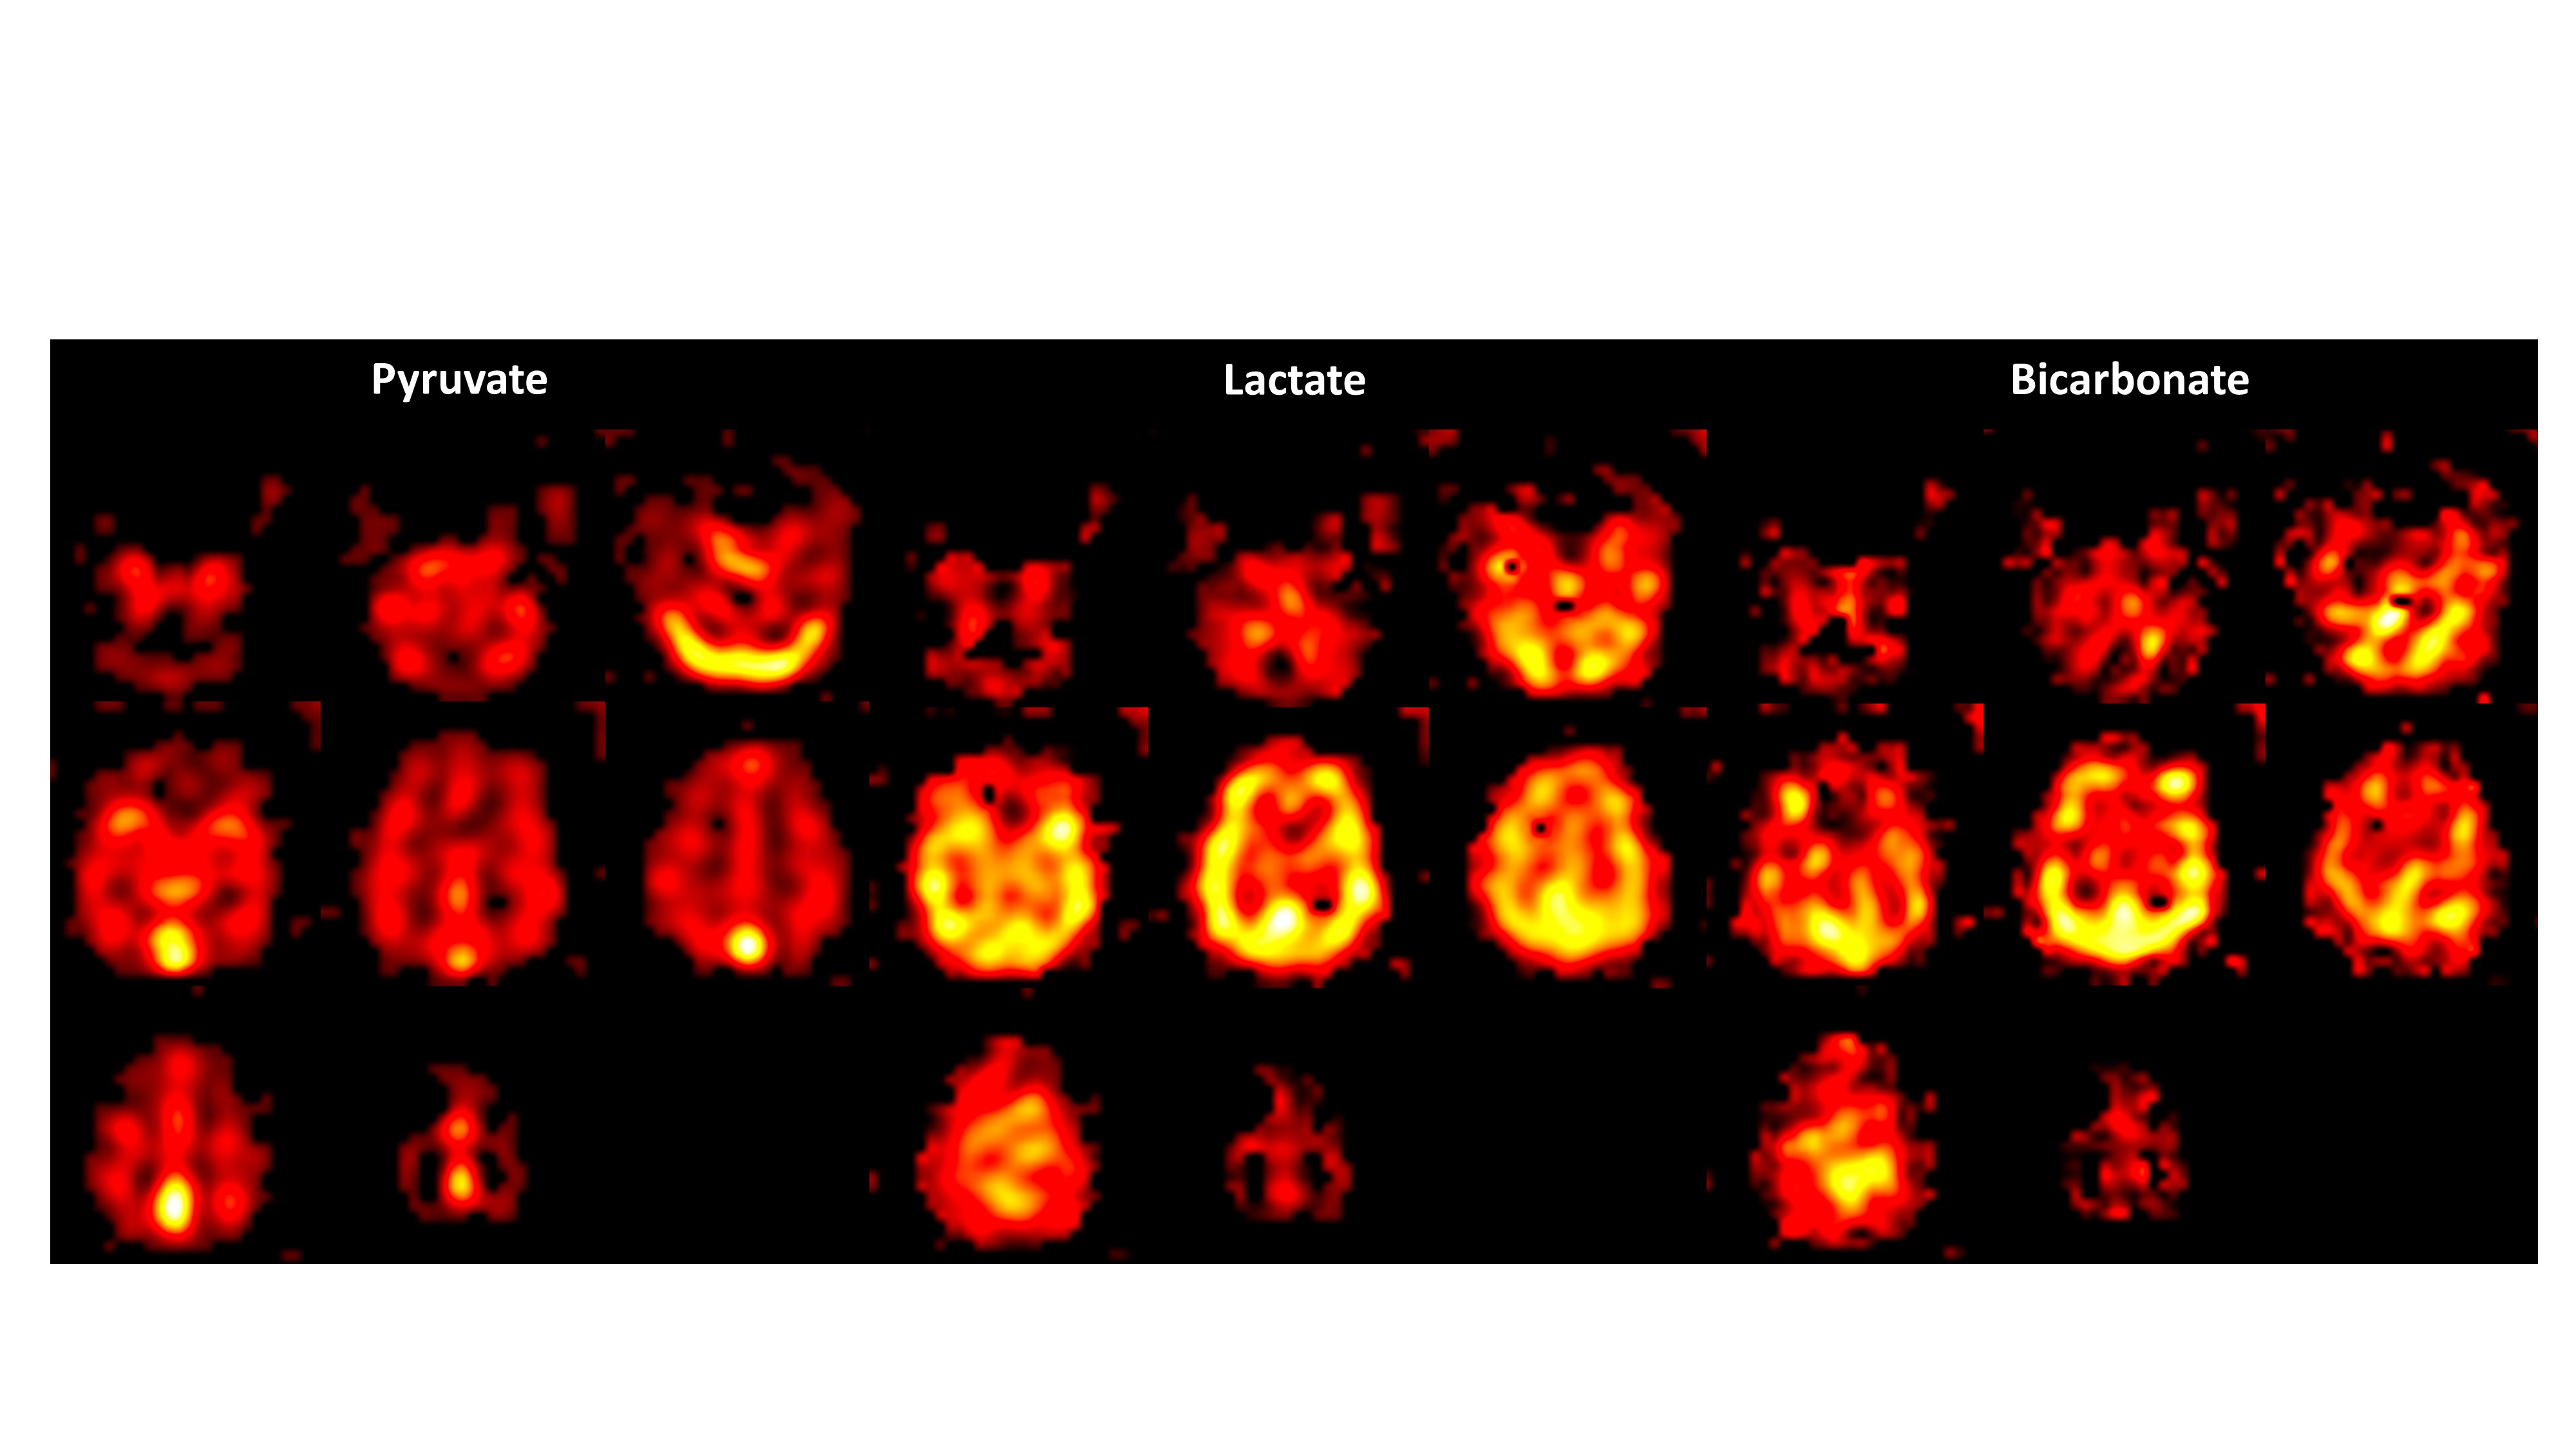
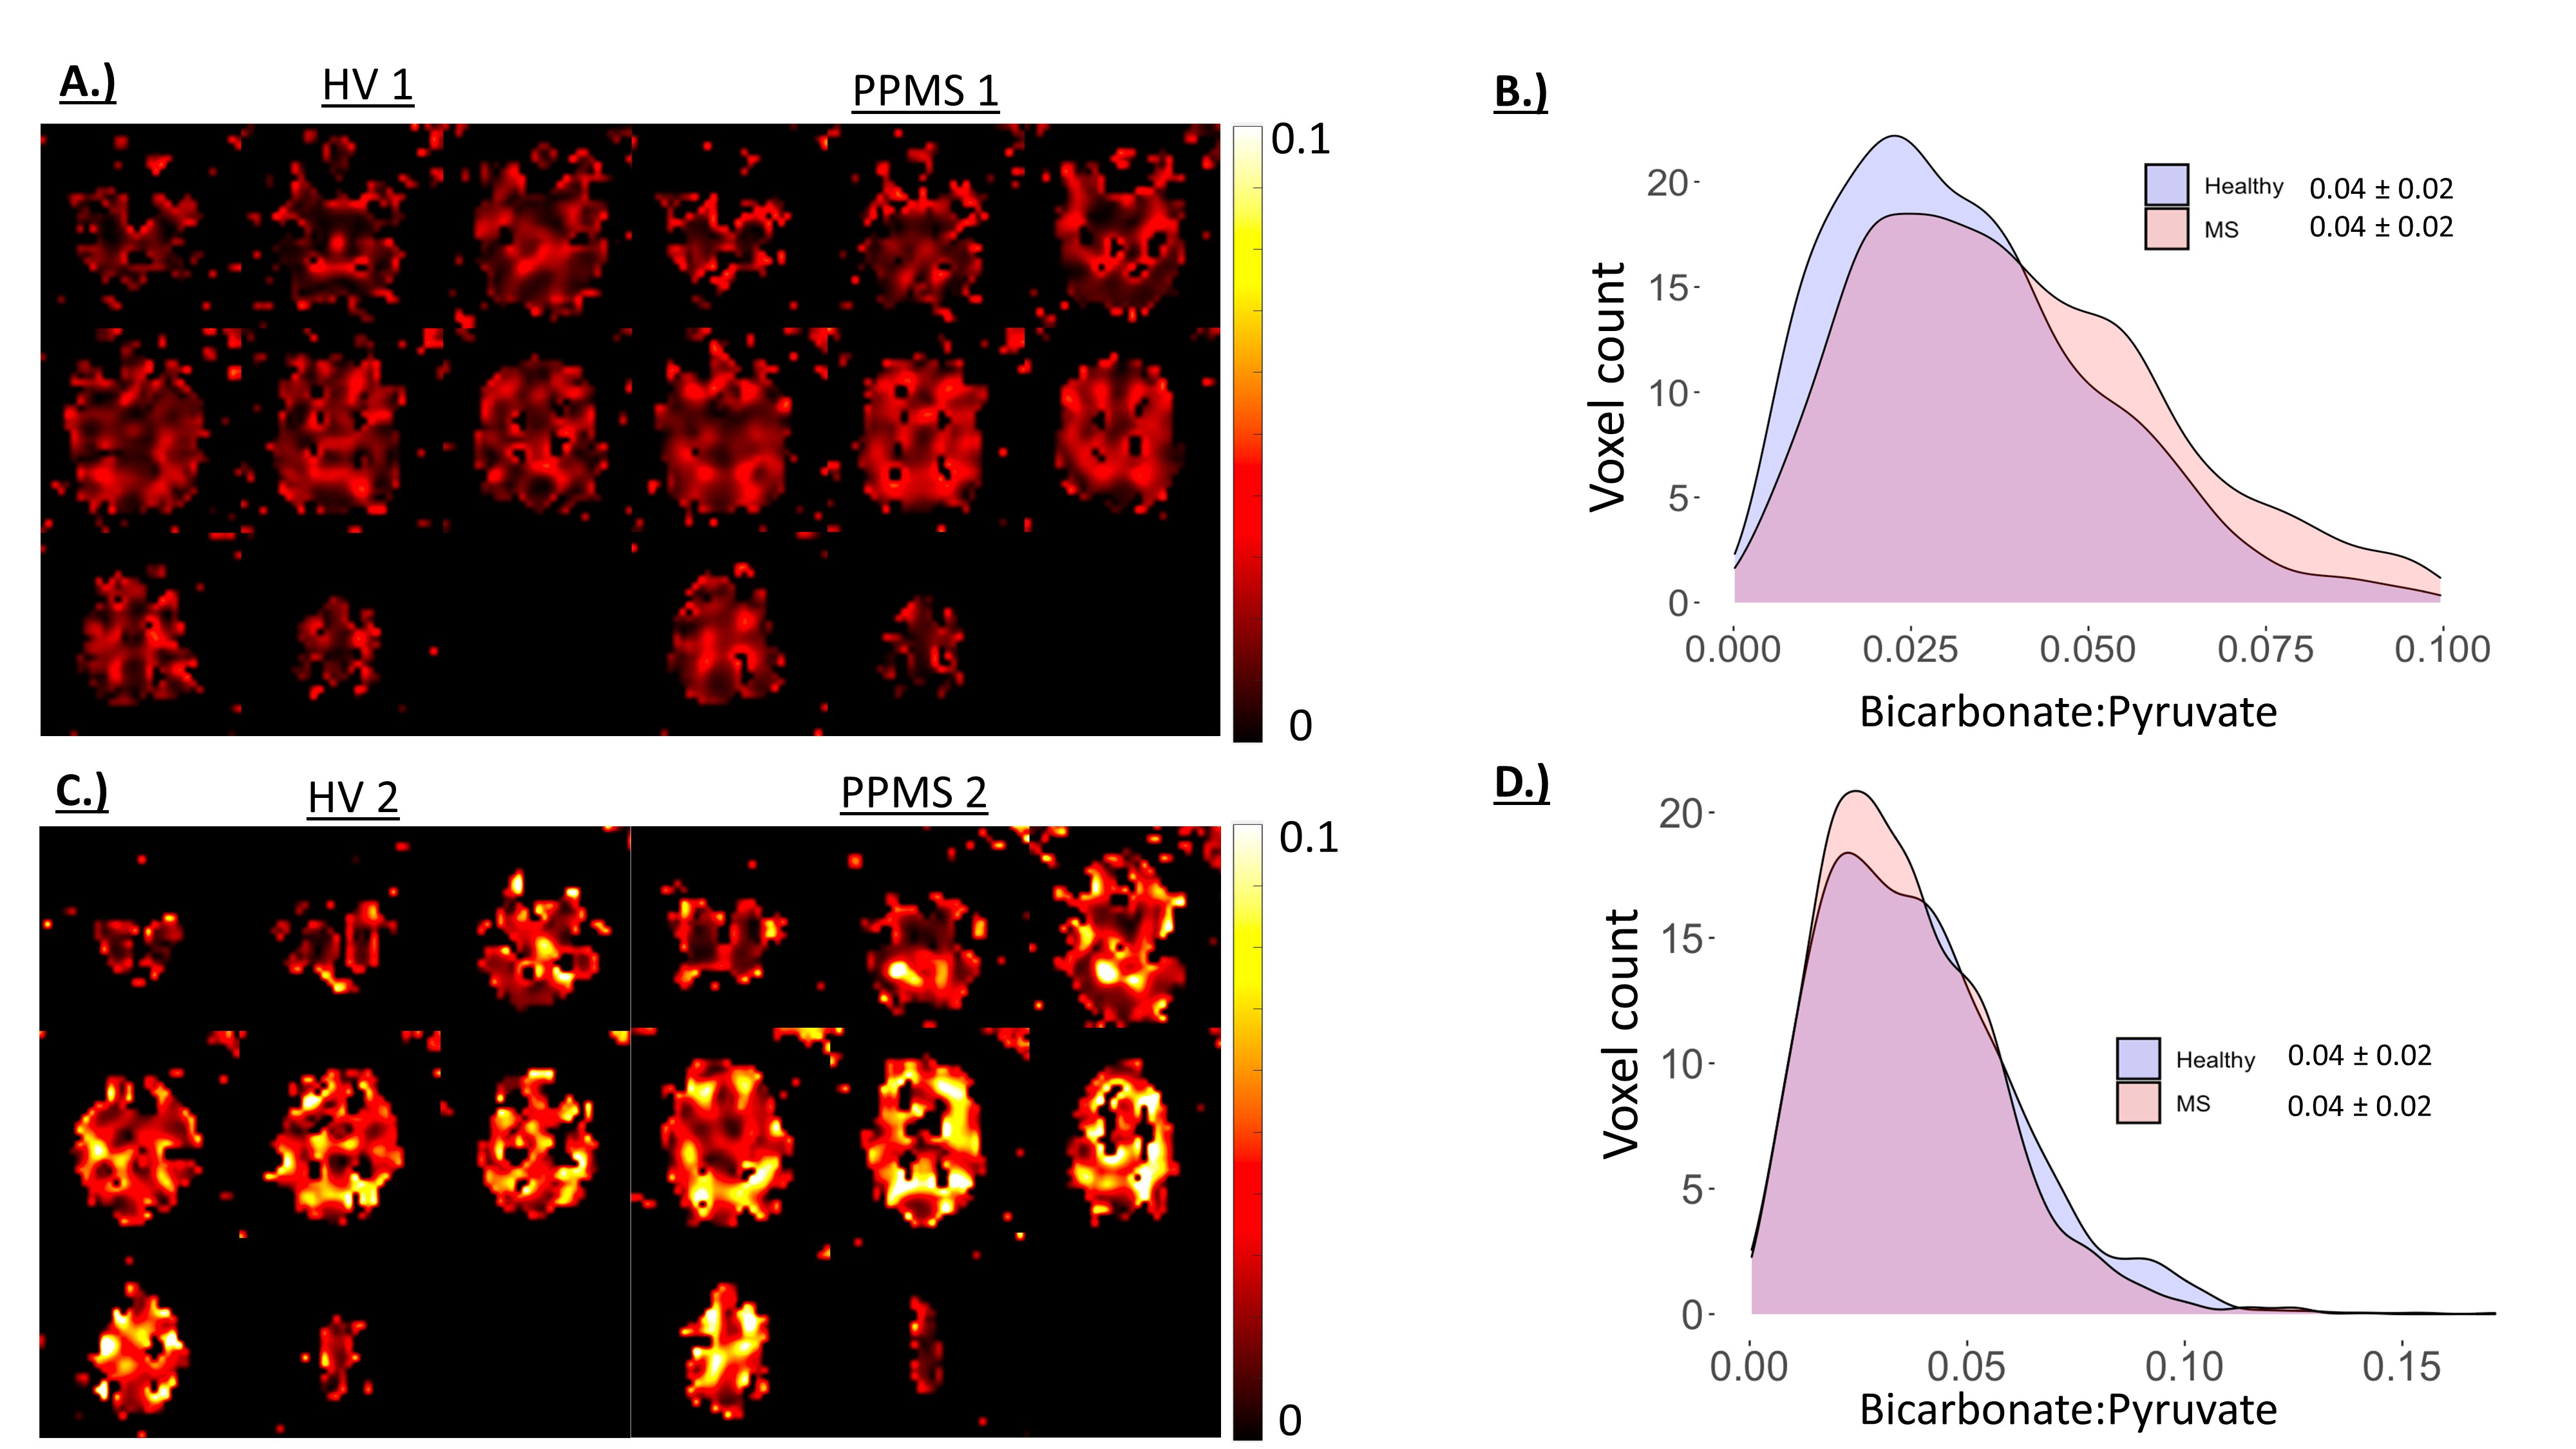
A comprehensive 1H MRI PPMS protocol reflecting a typical diagnostic work up is shown in Figure 1. Hyperpolarized [1-13C]pyruvate MRI was successfully acquired in all participants (N=2 HV and N=2 PPMS). Figure 2 displays an example of global 13C pyruvate metabolism in the PPMS brain. [1-13C]pyruvate entry into cerebral circulation and subsequent 13C label exchange through LDH can be visualised via the [1-13C]lactate signal across axial brain slices. The oxidative metabolism of [1-13C]pyruvate is demonstrated by the 13C bicarbonate signal, reflecting [1-13C]pyruvate flux through PDH. There was a global increase in [1-13C]lactate:[1-13C]pyruvate in both people with PPMS relative to age- and sex-matched healthy controls (Figure 3) (0.23 ± 0.12 vs 0.16 ± 0.08), whereas the 13C bicarbonate:[1-13C]pyruvate ratio, reflecting cerebral oxidative metabolism, was not different in either person with PPMS relative to their age- and sex-matched healthy controls (Figure 4.)Discussion
These preliminary data demonstrate an increased conversion of [1-13C]pyruvate into [1-13C]lactate in treatment naïve PPMS subjects relative to sex-matched healthy controls. This occurred independently of alterations in oxidative metabolism, which was maintained in PPMS subjects relative to healthy volunteers. These findings are in line with increased glycolytic metabolism reported in brain tumours[4] and in a murine model of MS, where the elevation in 13C label exchange through LDH was associated with pro-inflammatory macrophage density[6]. This effect has also been explored in vitro[8], in activated cultured T cells[9] and in the heart post-myocardial infarction, where elevated [1-13C]lactate was shown to correlate with activated macrophages[10]. This preliminary data may indicate the ability of hyperpolarized [1-13C]pyruvate MRI to probe aberrant cerebral metabolism in PPMS resulting from diffuse neuroinflammatory processes involving glycolytic pro-inflammatory microglia, which is not captured using conventional 1H MRI.Conclusion
Hyperpolarized [1-13C]pyruvate MRI may enable detection of neuroinflammation in PPMS by probing alterations in cerebral glycolytic metabolism. Integration of this technique into multi-parametric clinical imaging workflows may provide complementary metabolic data to aid in clinical management of PPMS.Acknowledgements
We are grateful for the support of Bristol Myers Squibb Neuroscience and Imaging during this work.References
1.Miller, D.H. and S.M. Leary, Primary-progressive multiple sclerosis. The Lancet Neurology, 2007. 6(10): p. 903-912.2. Montalban, X., et al., Ocrelizumab versus placebo in primary progressive multiple sclerosis. New England Journal of Medicine, 2017. 376(3): p. 209-220.
3. Grist, J.T., et al., Quantifying normal human brain metabolism using hyperpolarized [1–13C] pyruvate and magnetic resonance imaging. Neuroimage, 2019. 189: p. 171-179.
4.Miloushev, V.Z., et al., Metabolic imaging of the human brain with hyperpolarized 13C pyruvate demonstrates 13C lactate production in brain tumor patients. Cancer research, 2018. 78(14): p. 3755-3760.
5. Uthayakumar, B., et al., Age‐associated change in pyruvate metabolism investigated with hyperpolarized 13C‐MRI of the human brain. Human Brain Mapping, 2023.
6. Guglielmetti, C., et al., Hyperpolarized 13C MR metabolic imaging can detect neuroinflammation in vivo in a multiple sclerosis murine model. Proceedings of the National Academy of Sciences, 2017. 114(33): p. E6982-E6991.
7. Anderson, S., et al., Hyperpolarized 13C magnetic resonance imaging for noninvasive assessment of tissue inflammation. NMR in Biomedicine, 2021. 34(3): p. e4460.
8. Grist, J.T., et al., Extracellular lactate: a novel measure of T cell proliferation. The Journal of Immunology, 2018. 200(3): p. 1220-1226.
9.Can, E., et al., Noninvasive rapid detection of metabolic adaptation in activated human T lymphocytes by hyperpolarized 13C magnetic resonance. Scientific reports, 2020. 10(1): p. 200.
10.Lewis, A.J., et al., Noninvasive immunometabolic cardiac inflammation imaging using hyperpolarized magnetic resonance. Circulation research, 2018. 122(8): p. 1084-1093.
Figures