2944
Serum 24-Hydroxycholesterol is weakly correlated with brain water content, myelin water fraction and T1 relaxation in different stages of MS1Radiology, University of British Columbia, Vancouver, BC, Canada, 2International Collaboration on Repair Discoveries, Vancouver, BC, Canada, 3Pathology & Laboratory Medicine, University of British Columbia, Vancouver, BC, Canada, 4Analytical Core for Metabolomics and Nutrition, BC Children's Hospital Research Institute, Vancouver, BC, Canada, 5Medicine, University of British Columbia, Vancouver, BC, Canada, 6MSMRI Research Group, University of British Columbia, Vancouver, BC, Canada, 7Physics & Astronomy, University of British Columbia, Vancouver, BC, Canada, 8School of Biomedical Engineering, University of British Columbia, Vancouver, BC, Canada
Synopsis
Keywords: Multiple Sclerosis, Multiple Sclerosis, serum, white matter, myelin, water content, T1, brain
Motivation: Quantitative and specific MRI methods may better characterize brain changes in multiple sclerosis (MS). Serum biomarkers that reflect advanced MRI measures would be an accessible and cost-effective tool for tracking these changes.
Goal(s): To explore the ability of serum 24-hydroxycholesterol to reflect changes in advanced brain MRI measures in MS.
Approach: 103 MS participants with diverse disease course subtypes underwent 3T MRI and same-day venous blood sampling.
Results: Lesion water content and myelin water fraction (MWF), normal appearing white matter MWF and T1, and diffusely abnormal white matter MWF demonstrated relationships with serum 24-hydroxycholesterol in specific disease courses of MS.
Impact: Correlation between serum 24-hydroxycholesterol and advanced MRI measures in different MS subtypes encourage further investigation of its use as a supportive marker. The development of MRI and serum markers could improve the sensitivity and frequency of monitoring MS disease progression.
Background
The limited sensitivity and specificity of conventional magnetic resonance imaging (MRI) methods has driven the development of more sophisticated MRI data acquisition and analysis approaches to characterize changes happening in the brains of people with multiple sclerosis (MS). Advance MRI imaging, including water content (WC), myelin water fraction (MWF), and T1 relaxation, quantifies focal damage within lesions and diffuse damage within brain regions that appear non-lesional on clinical MRI. Current Canadian guidelines recommend annual clinical MRI monitoring in medically-treated MS; however, limited resources hinder the use of MRI to closely monitor MS-related brain changes. Because of limited MRI resources in many places around the world and a desire for additional objective metrics related to MS tissue damage, exploring the potential of serum biomarkers that may reflect MRI abnormalities and support clinical management is warranted.In blood, 24-hydroxycholesterol (24S-HC) is a known marker of neuronal metabolism and cholesterol efflux from the central nervous system (CNS) and an increase may represent ongoing and chronic demyelination and neurodegeneration1,2,3,4. The majority of 24S-HC crosses the blood brain barrier into the circulation before subsequent metabolism by the liver1, thereby allowing a window into CNS oxysterol homeostasis. This study examined the relationship between serum 24S-HC and advanced MRI measures of brain WC, MWF and T1 relaxation in a diverse group of MS participants.
Methods
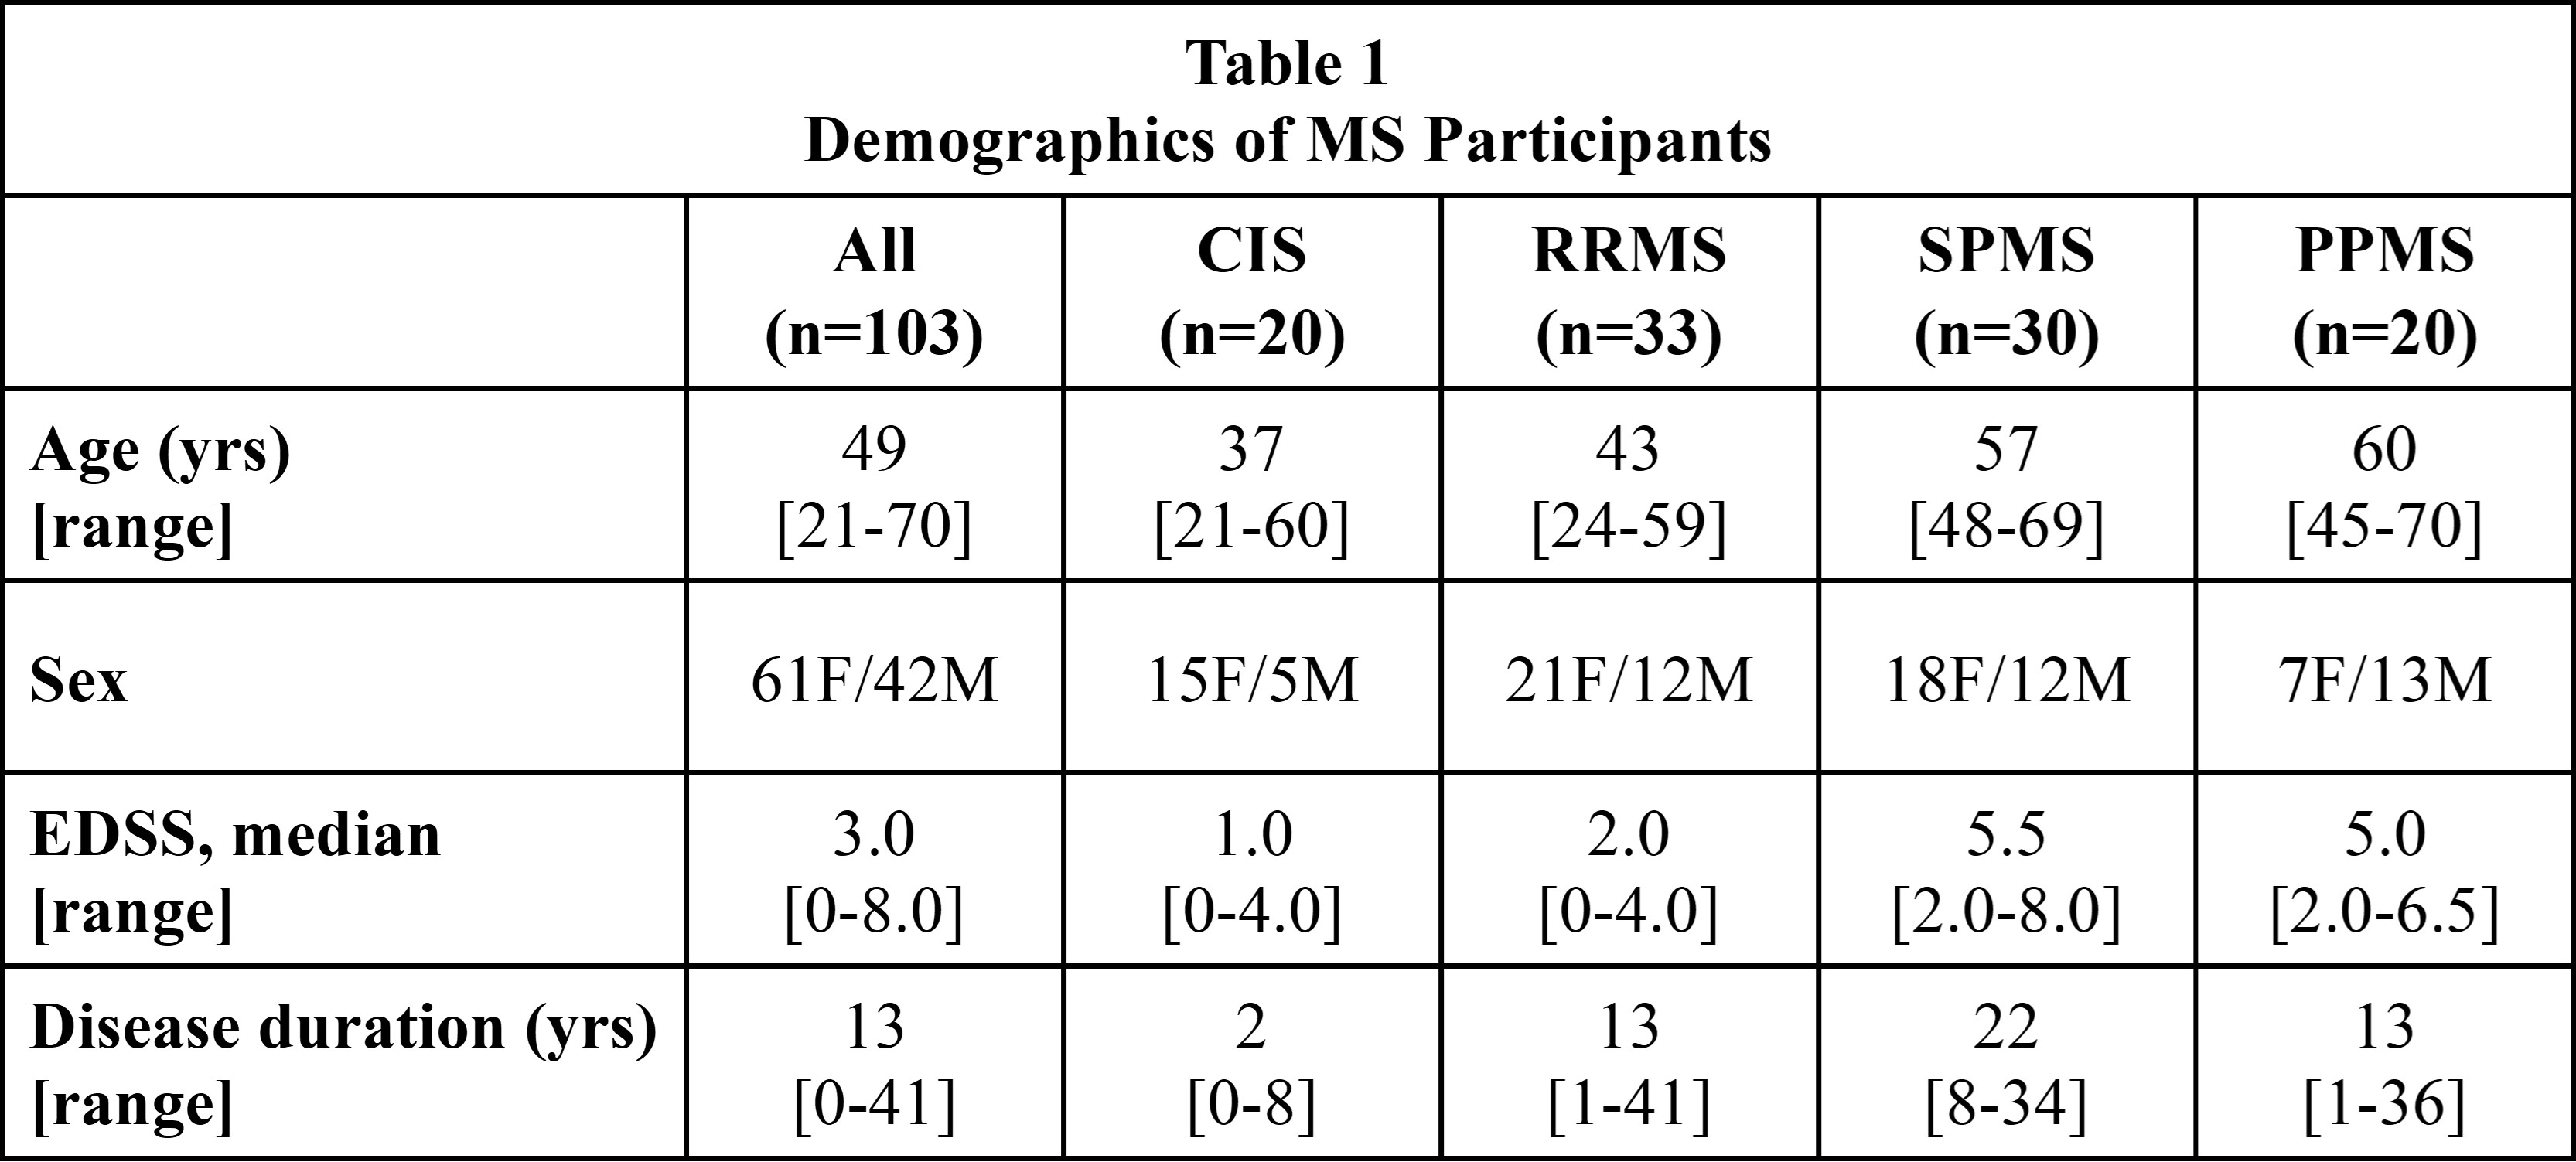
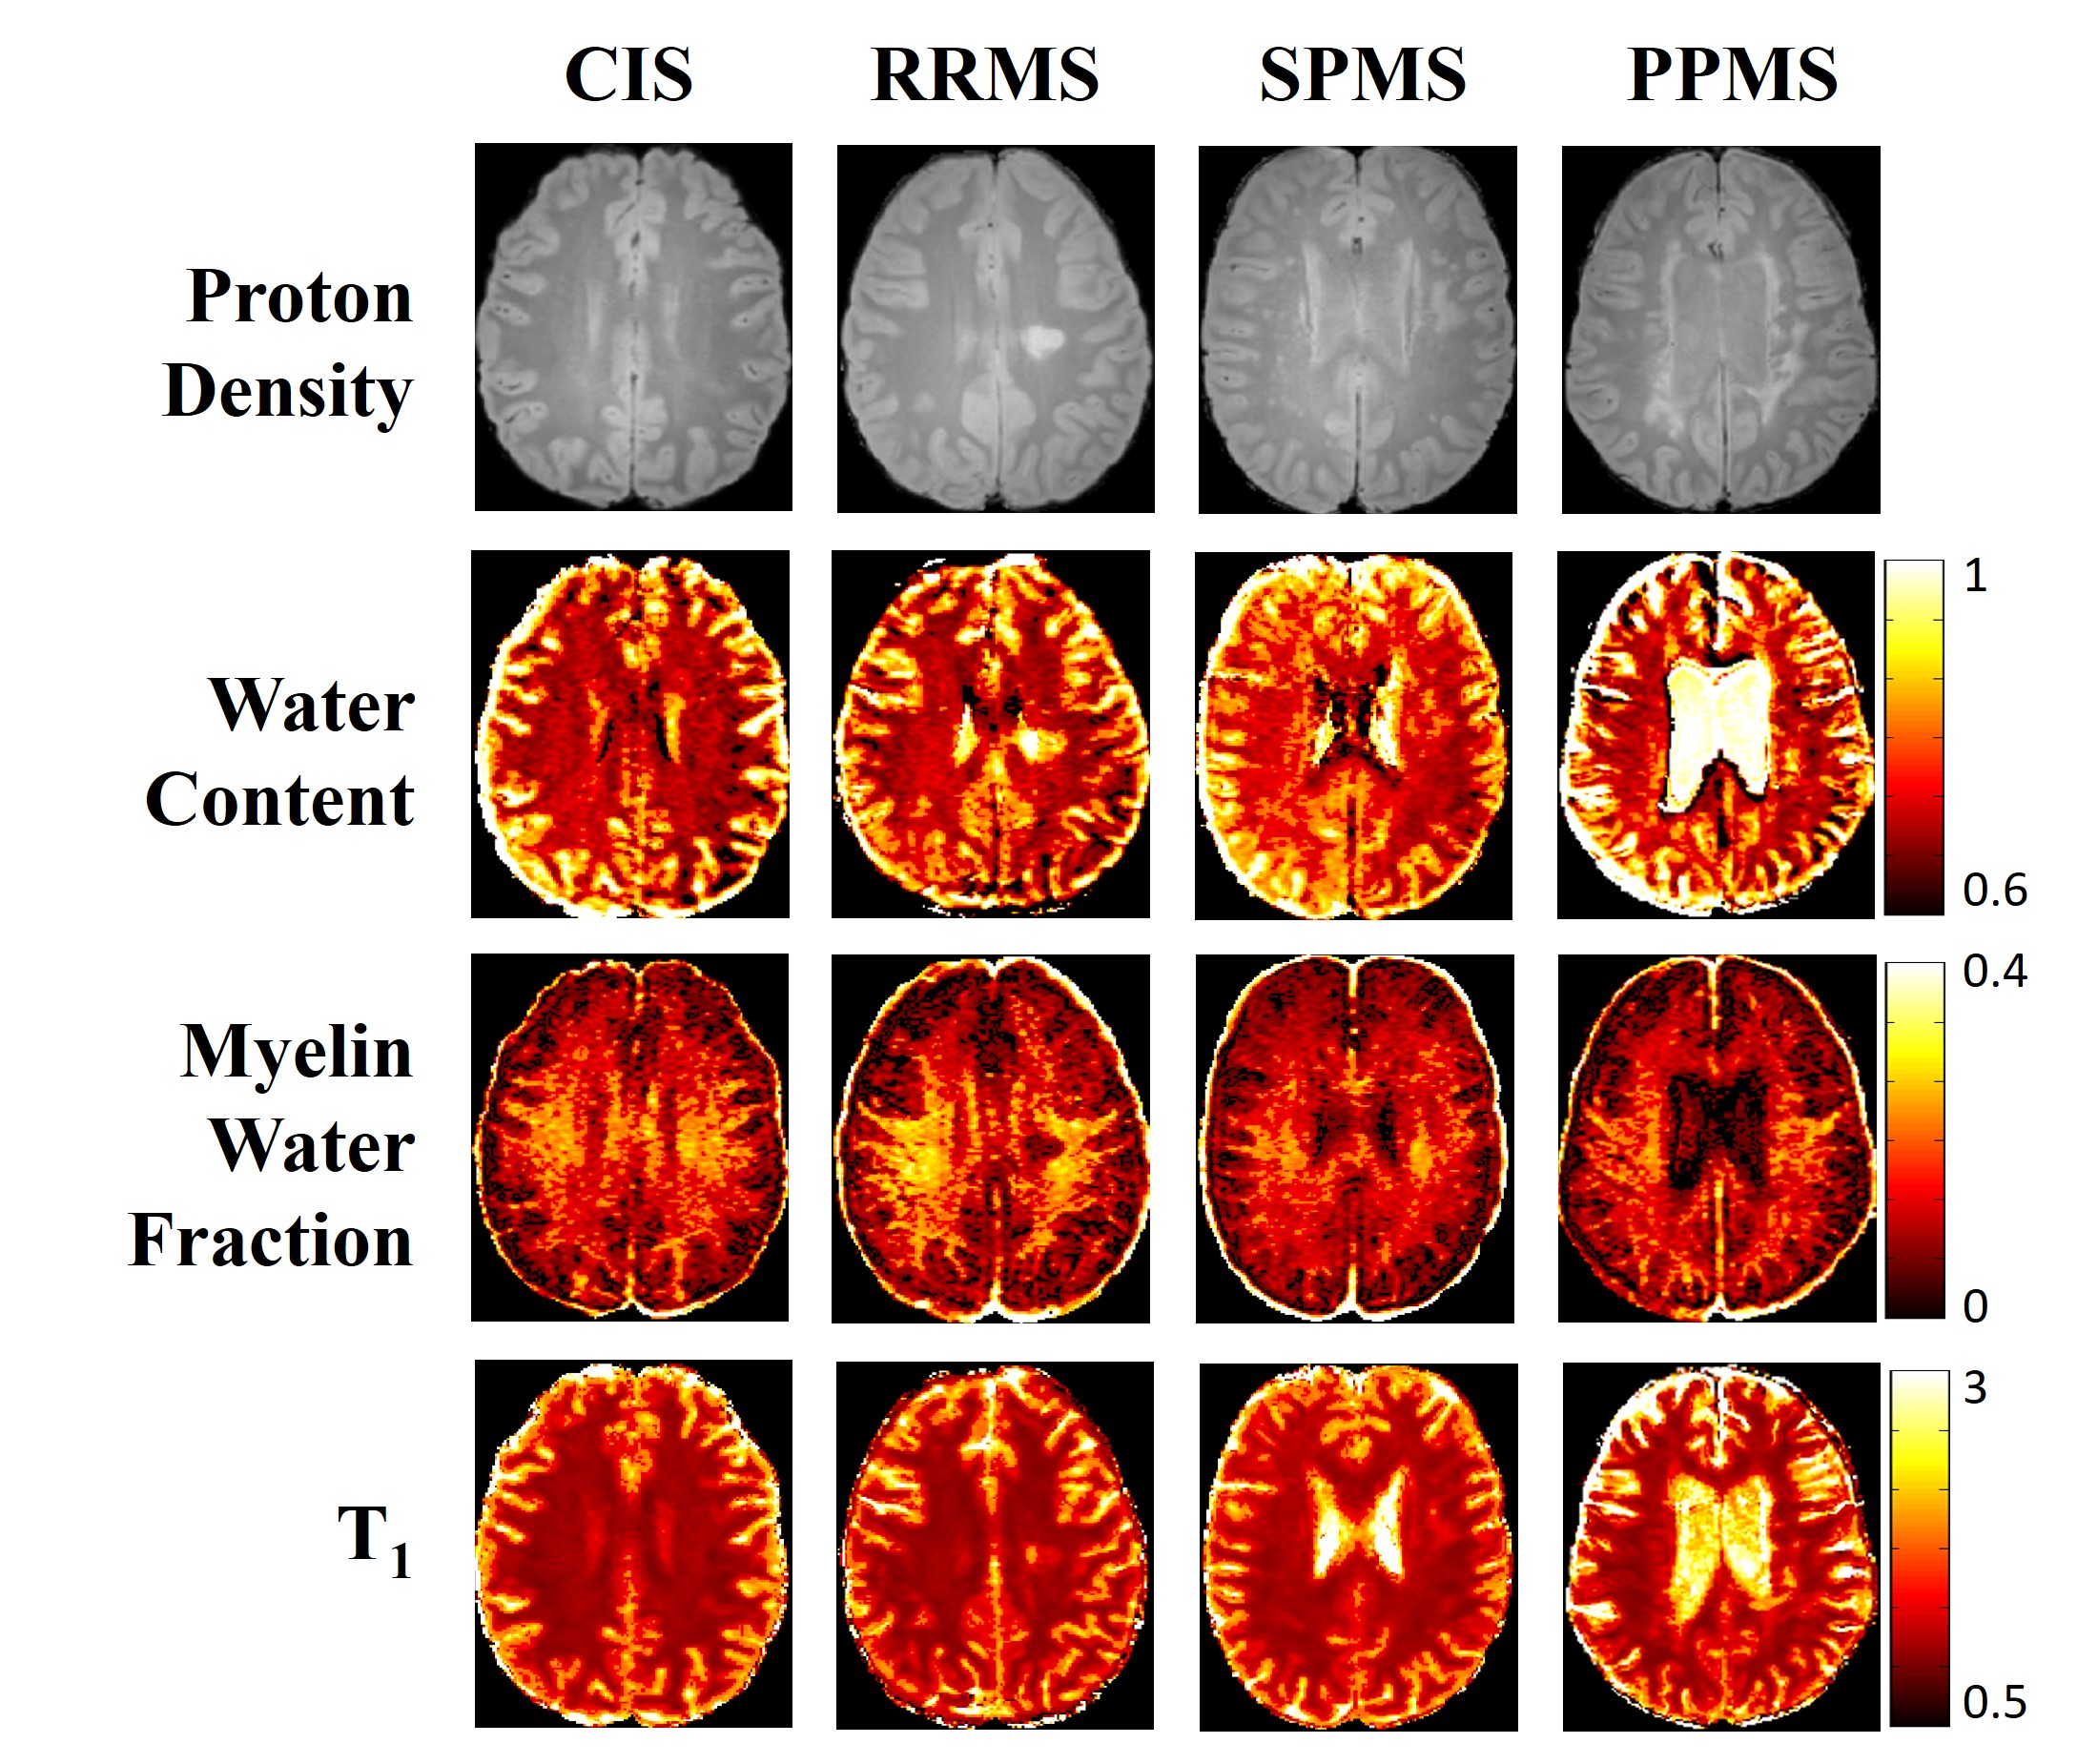
Participants & Data Collection: 103 MS participants (20 clinically isolated syndrome (CIS), 33 relapsing-remitting (RRMS), 30 secondary progressive (SPMS), 20 primary progressive (PPMS), Fig.1) underwent 3T MRI (Philips Acheiva) and same-day venous blood sampling. MRI sequences included 48-echo GRAdient and Spin-Echo (GRASE) T2 relaxation (TR/TE=1073/8ms, 1x1x2.5mm3, slices=40),5 inversion recovery T1 relaxation (TIs=150,400,750,1200,2100ms, TR/TE=3000/3.2ms, 1x1x2.5mm3, slices=40), PD/T2-weighted (TR/TE1/TE2=2900/8.42/80ms, 1x1x3mm3, slices=54), 3DT1-MPRAGE (TR/TE/TI=3000/3.5/926ms, 1x1x1mm3).Analysis/Statistics: 24S-HC was measured using gas chromatography–mass spectrometry. Voxel-wise T2 distributions were calculated using non-negative least squares (MWF: fractional signal T2<40ms)6,7. T1 was fit to a single exponential. WC was calculated using the reference method8. Metric maps (Fig.2) were registered to 3DT1 (FLIRT, FSL toolbox)9. White matter masks were created on the 3DT1 (FAST10). Lesions were automatically segmented using seed points11 and subtracted from white matter masks to create NAWM masks. DAWM was manually segmented. Normalized brain volume was calculated using in-house software12. Cortical thickness was determined with ANTs13. Thalamic and deep grey matter (GM) volumes were calculated with FIRST14. Multiple linear regression by MS subtype assessed the relationship and association strength between advanced MRI measures and 24S-HC, while controlling for age, sex, expanded disability status scale, and disease duration (adjusted R2 reported).
Results
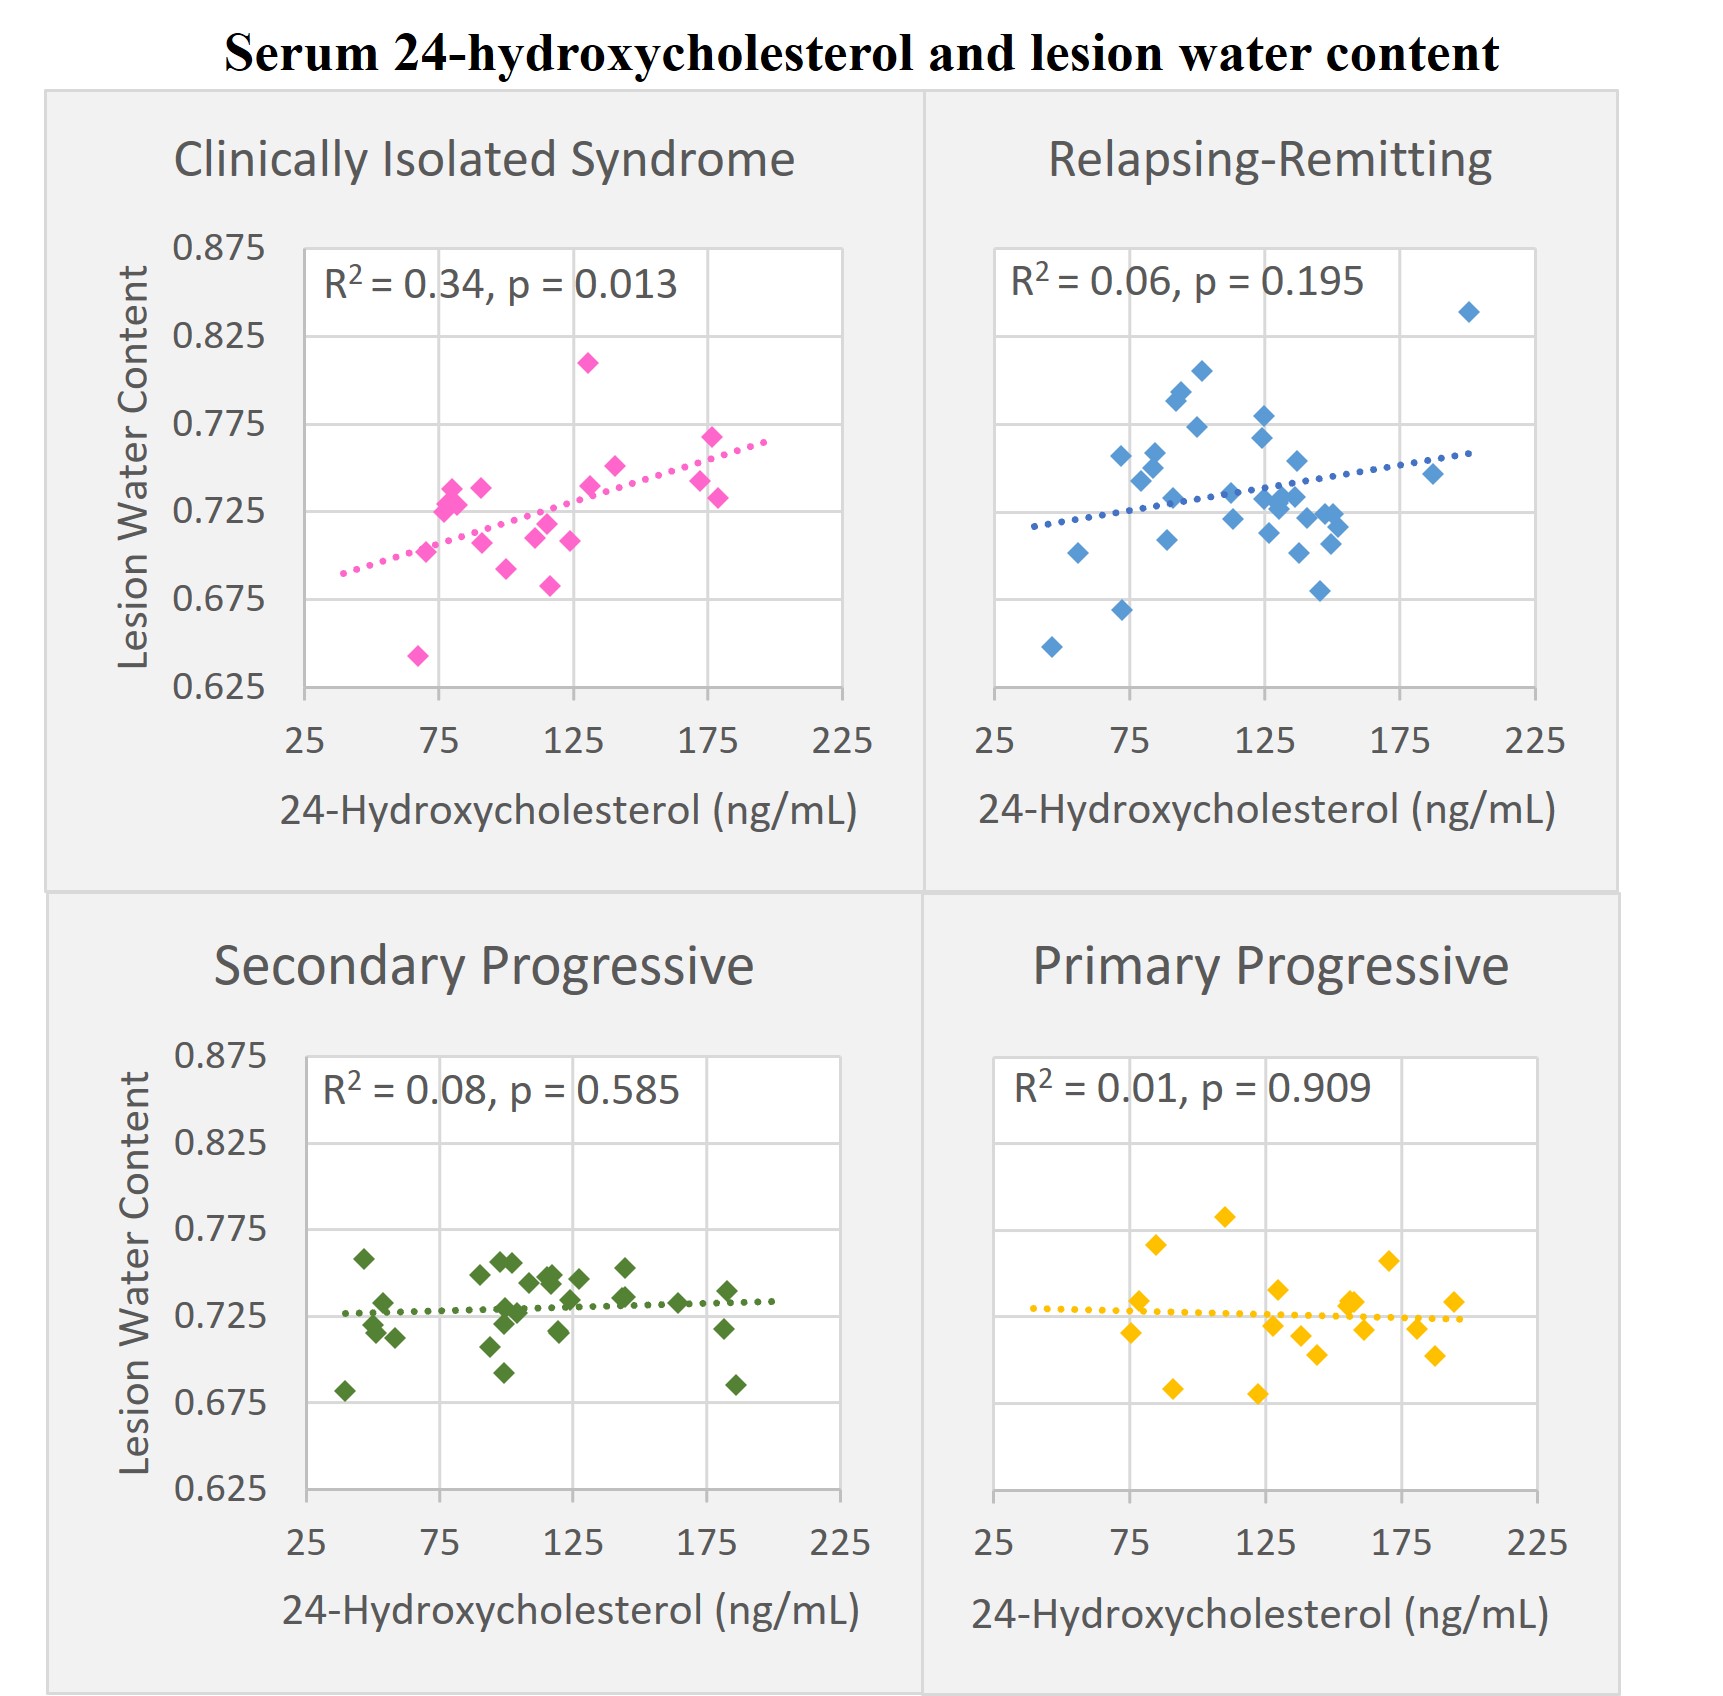
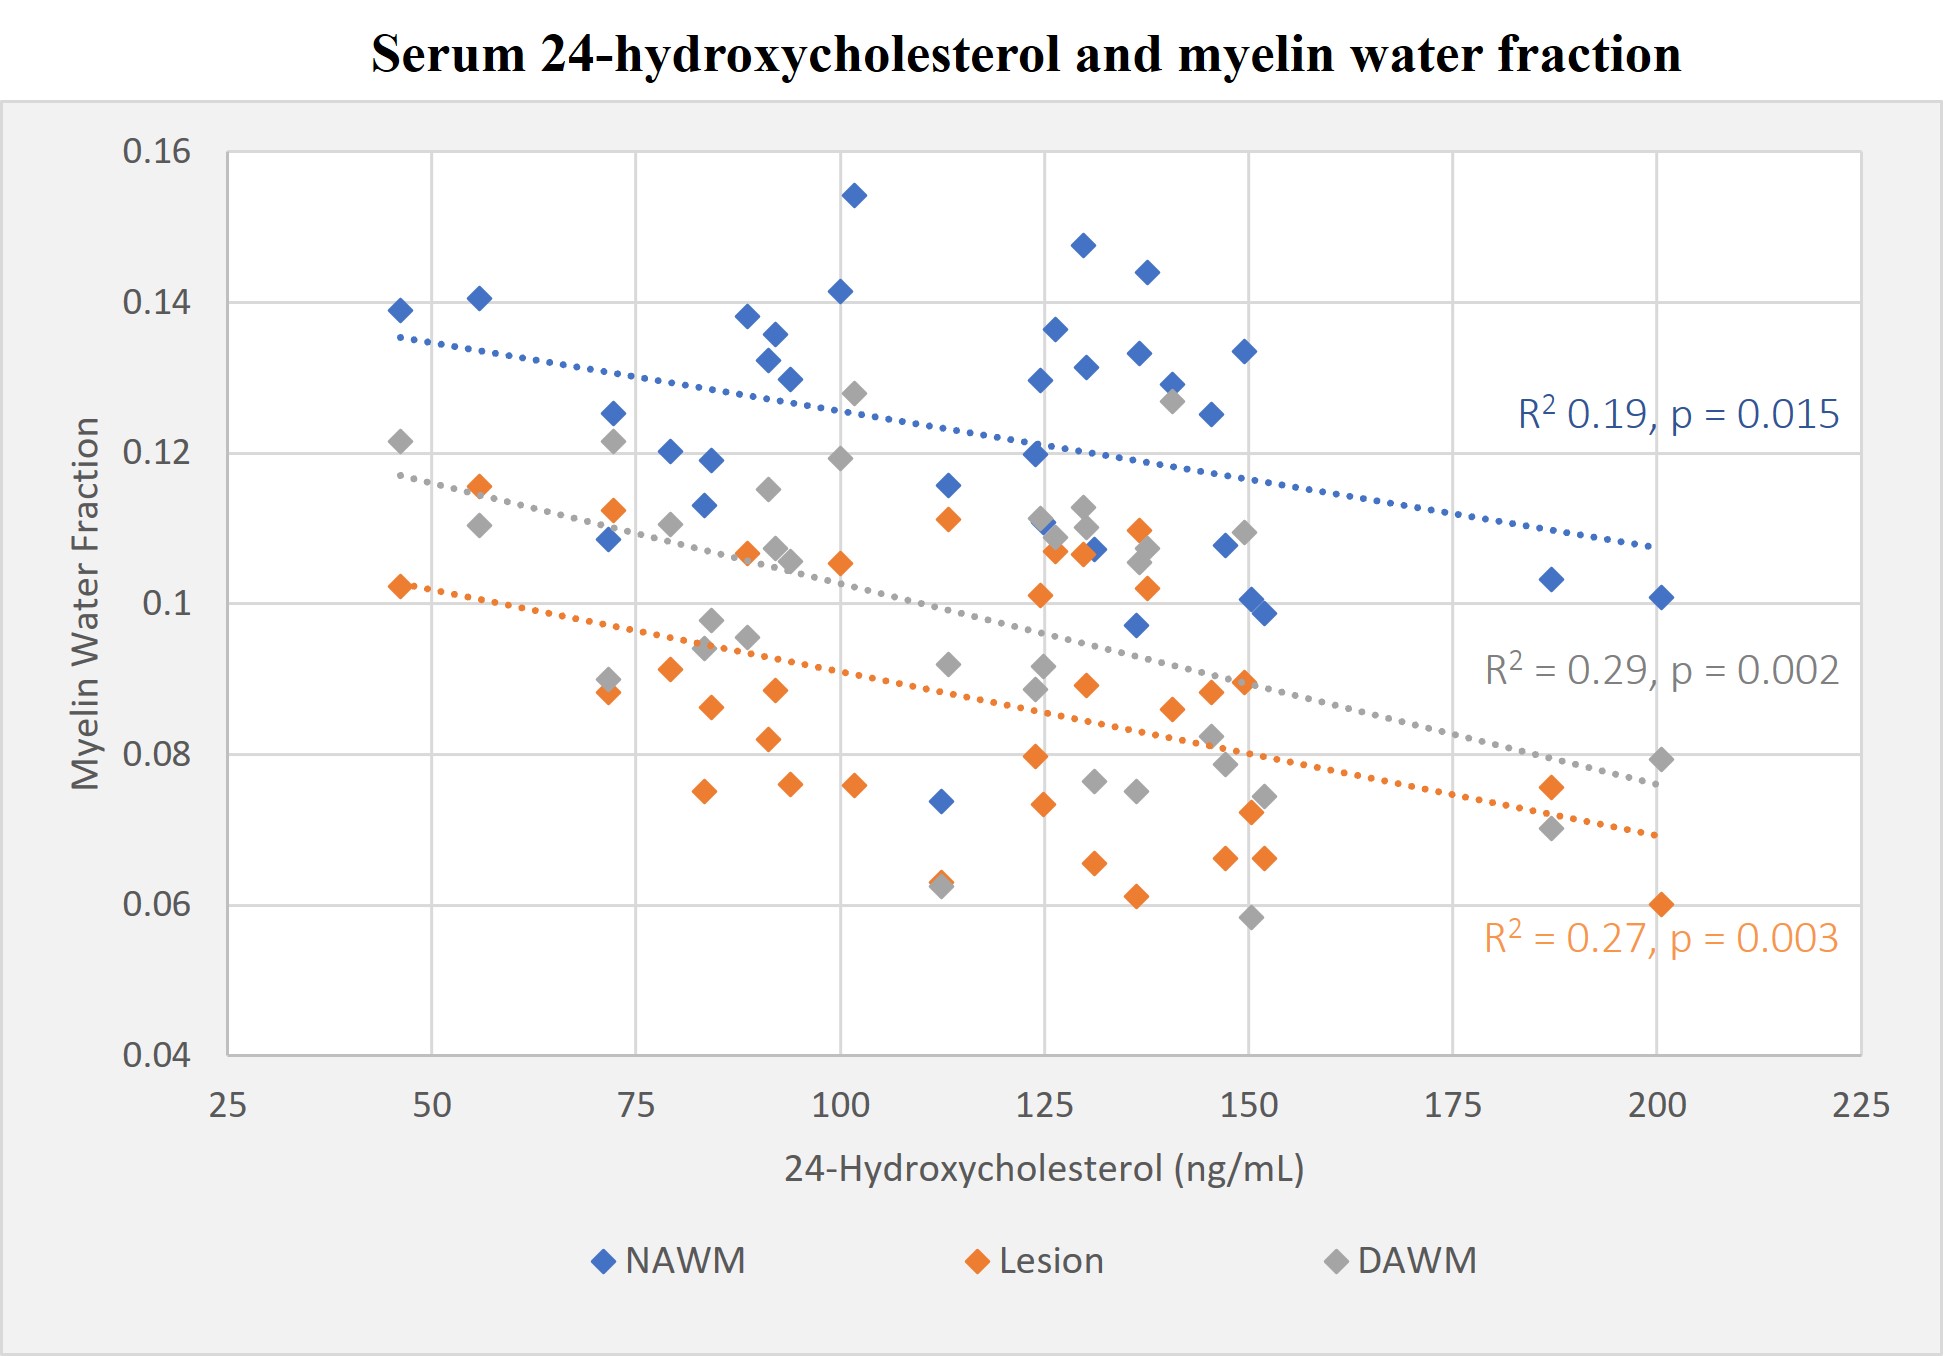
Water content: Increased lesion WC was associated with increased 24S-HC in CIS (R2=0.34, p=0.013) (Fig.3).MWF: Decreased MWF was associated with increased 24S-HC in NAWM (R2=0.12, p=0.015), DAWM (R2=0.29, p=0.002), and lesion tissue (R2=0.27, p=0.003) in RRMS (Fig.4). Lesion MWF was also inversely associated with 24S-HC in CIS (R2=0.24, p=0.042).
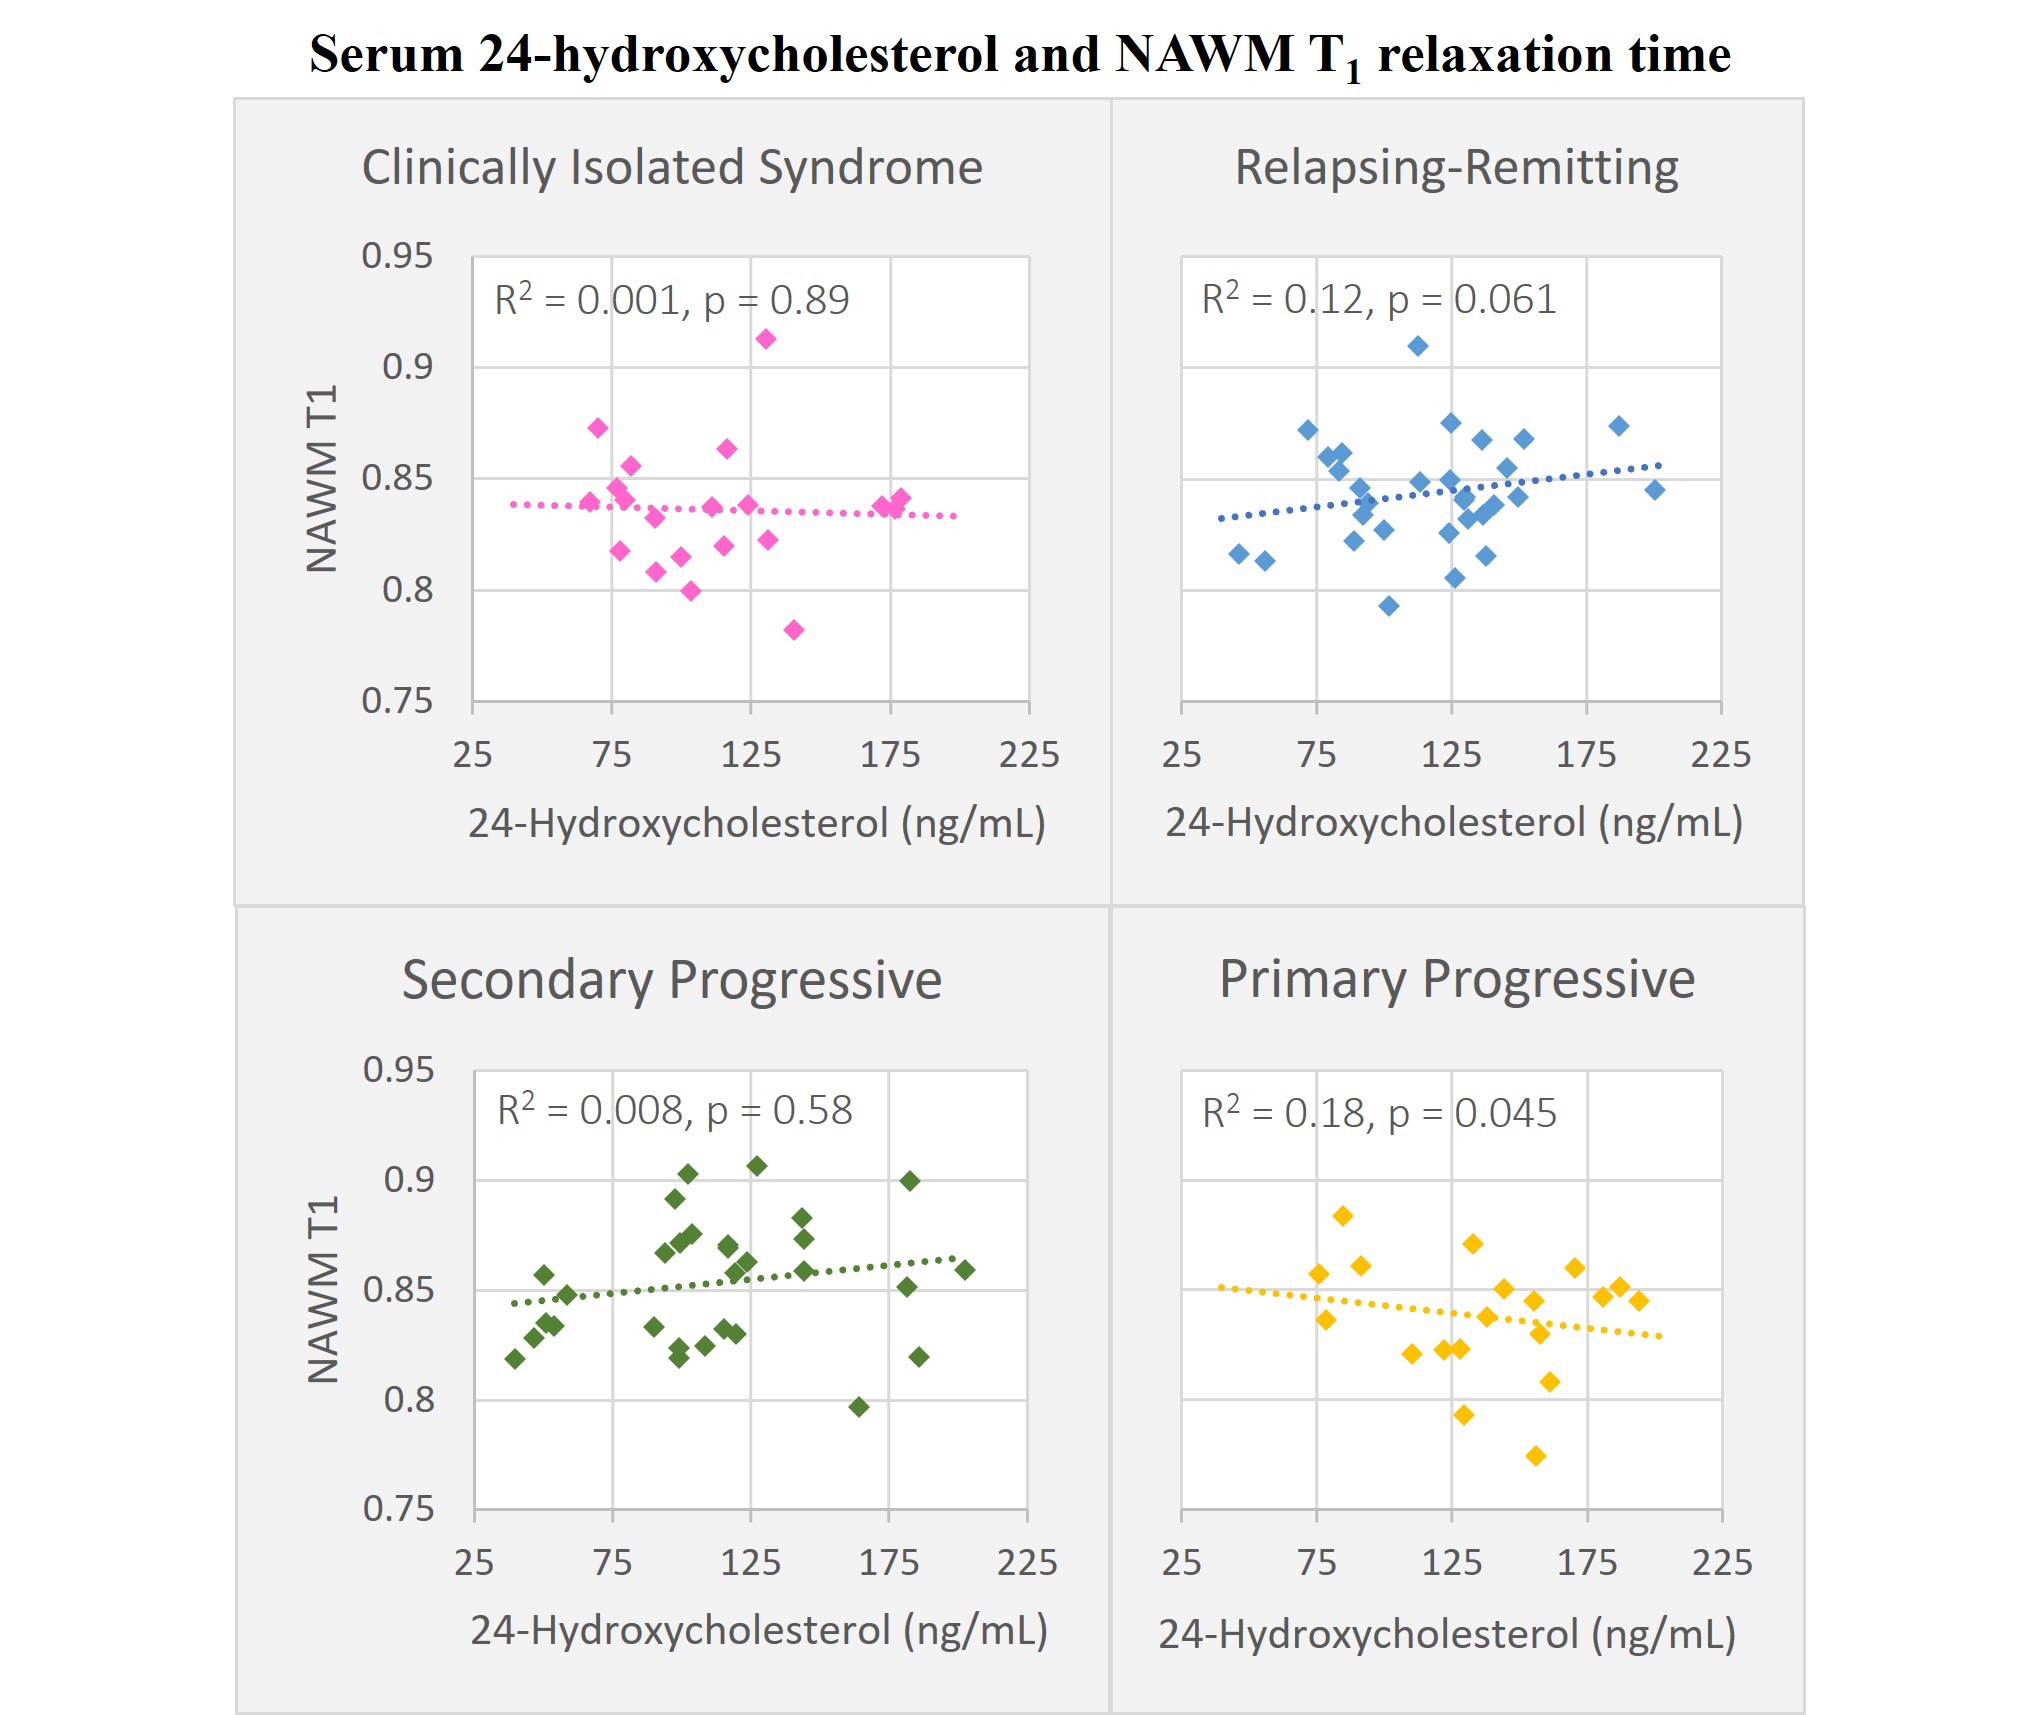
T1: Decreasing NAWM T1 relaxation times were weakly associated with increased 24S-HC in PPMS (R2=0.18, p=0.045) (Fig.5).
No significant relationships between 24S-HC and other MRI measures (normalized brain, lesion, thalamic, and deep GM volumes, cortical thickness) were observed.
Discussion
The strongest association between 24S-HC and lesion WC and MWF was seen in the earliest stages of MS (CIS, RRMS) and was less evident in progressive MS. This may reflect the natural history of early RRMS that appears dominated by acute focal inflammation15,16. 24S-HC may also reflect the severity of chronic demyelination processes occurring in NAWM. Previous work has demonstrated increased white matter lesion WC in MS17,18,19, which could be due to an influx of water from edema/inflammation but may also be replacing lost tissue from demyelination, axonal loss, or both. MWF is often decreased in MS due to demyelination20,21. Our WC and MWF results are in congruence with the proposed pathophysiology of these MRI metrics and 24S-HC in the context of MS. While T1 relaxation may reflect changes to tissue and water content22, NAWM T1 associations with 24S-HC do not seem to point to specific or understood pathologic relationships.Conclusion
Our analysis demonstrated varying degrees of correlation between 24S-HC and lesion WC in CIS; MWF of NAWM, DAWM, and lesions in RRMS and CIS; and NAWM T1 in PPMS. 24S-HC could potentially have utility as a supportive biomarker for assessing white matter pathology in different MS disease courses. However, further research is needed to better understand and establish these relationships and define quantitative thresholds for clinical significance.Acknowledgements
Thank you to the study participants and UBC MRI Research technologists. Funding was provided by the MS Society of Canada. NM was supported by a UBC MS Connect Scholarship and a Foundation of the Consortium of MS Centers Research Scholar Award. This work was conducted on the traditional, ancestral, and unceded territories of Coast Salish Peoples, including the territories of the xwməθkwəy̓əm (Musqueam), Skwxwú7mesh (Squamish), Stó:lō and Səl̓ílwətaʔ/Selilwitulh (Tsleil-Waututh) Nations.References
1. Lorincz, B et al. Autoimmunity Reviews, 2022; 21(6): 103088.
2. Vejux, A et al. J Steroid Biochem. Mol. Biol., 2021; 210: 105870-105870.
3. Duc, D et al. Int. J. Mol. Sci., 2019; 20(18): 4522.
4. Podbielska M, O’Keeffe J, Pokryszko-Dragan A. Int. J. Mol. Sci., 2021; 22(14):7319.
5. Zhang J et al. ISMRM, 2015; 824.
6. Prasloski T et al. Magn Reson Med. 2012; 67: 1803–1814.
7. Whittall KP and MacKay AL. J Magn Reson. 1989; 84: 134–152.
8. Meyers SM, Kolind SH, MacKay AL. Magn Reson Imaging. 2017; 37: 187-194.
9. Jenkinson M et al. NeuroImage. 2002; 17(2):825-841.
10. Zhang Y, Brady M, Smith S. IEEE Trans Med Imag. 2001; 20(1): 45-57.
11. McAusland J et al. IEEE Trans Biomed Eng. 2010; 57(11): 2689–2698.
12. Wicks E et al. ISMRM. 2015, 3750.
13. Das SR et al. Neuroimage, 2009; 45: 867-79.
14. Patenaude B et al. NeuroImage, 2011; 56: 907-922.
15. Ghasemi, N., et. Al. Cell Journal, 2017; 19(1): 1-10.
16. Meca-Lallana, V., et al. Front. Neurol., 2021; 12: 608491.
17. Vavasour, Irene M., et al. J. Neuroimaging, 2021; 31(6): 1119-1125.
18. Shah, N Jon et al. NeuroImage, 2022; 252: 119014.
19. Laule, C., et al. J. Neurology, 2004; 251(3): 284-293.
20. Laule, C. et al. NeuroImage, 2008; 40(4): 1575-1580.
21. Laule, C. et al. Mult. Scler. J., 2006; 12(6): 747-753.
22. Thaler, C. et al. Am. J. Neuroradiol., 2017; 38(2): 264-269.
Figures