2942
Characterization of White Matter Lesions in Multiple Sclerosis using Proton density and T1-relaxation Measures1Neurology, Wayne State University, DETROIT, MI, United States, 2Radiology, Wayne State University, DETROIT, MI, United States, 3College of Engineering, University of Michigan, Ann Arbor, MI, United States, 4Neurology, Wayne State University, Detroit, MI, United States
Synopsis
Keywords: Multiple Sclerosis, Multiple Sclerosis
Motivation: There is a limited understanding of the lesion heterogeneity in multiple sclerosis (MS), which needs to be investigated through different imaging techniques.
Goal(s): To characterize MS lesions using proton density (PD) and T1-relaxation maps.
Approach: PD and T1 data were generated for 20 relapsing-remitting MS patients. Lesions were voxel-wise divided into high PD regions and the remaining lesional tissue. Clinical scores were correlated with total lesion volume, volumes of high PD regions and high T1 regions.
Results: Lesions with high PD exhibited highest probability of occurrence at the boundary of lateral ventricles and likely represent chronic lesions with significant local tissue rarefaction.
Impact: Proton density and T1-relaxation maps act as an essential complement to the conventional clinical sequences and could serve as a new biomarker for assessing tissue damage in white matter lesions in relapsing-remitting multiple sclerosis patients.
Introduction
Although lesion dissemination in time is a defining characteristic of multiple sclerosis (MS), there is a limited understanding of lesion heterogeneity. Currently, T2-weighted (T2W), fluid attenuated inversion recovery (FLAIR) and T1-weighted (T1W) data are used to assess MS lesions qualitatively. Estimating water content could provide a measure of local tissue rarefaction, or reduced tissue density, resulting from chronic inflammation. Our goal was to utilize the proton spin density (PD), derived from a rapid, multi-contrast STAGE (strategically acquired gradient echo) protocol to characterize white matter (WM) lesions seen on T2W, FLAIR and T1W data.Materials and Methods
Twenty (20) subjects with relapsing-remitting MS were scanned at 3T using T1W, T2-weighted, FLAIR and strategically acquired gradient echo (STAGE) sequences. STAGE imaging utilizes a multi-echo time (TE), multi-flip angle (FA) 3D gradient echo acquisition strategy to simultaneously quantify voxel-wise tissue properties (including PD and T1), with inherent rf inhomogeneity corrections [1]–[3]. Imaging parameters for STAGE: TR = 25 ms, resolution = 1.33×0.67×2 mm3, bandwidth = 241 Hz/pxl with an axial acquisition; for 6° flip angle (FA) data, TEs = 7.5/17.5 ms; for 24° FA data, TEs = 8.75/18.75 ms. PD maps were normalized by setting the PD for white matter (WM) to 0.7 [4]–[7]. The lesions were segmented in 3D using the lesion prediction algorithm [8]. The lesion masks were edited manually, when necessary, for the regions with high PD values that were suppressed on the FLAIR images. The threshold for high PD and T1 regions within the lesions was set using: µGM + 2∙σGM, where µGM and σGM are the mean and inter-subject variability of the average gray matter (GM) PD and T1 values for all subjects. Clinical scores, including Extended Disability Status Scale (EDSS), nine-hole peg test for the dominant hand (DH) and the non-dominant hand (NDH), paced auditory serial addition test (PASAT), and a timed 25-feet walk test, were correlated with total and high PD lesion volumes. Multiple comparison for volumetric correlations were performed using the false discovery rate (FDR) correction [9]. The lesion masks (total and high PD-only masks) were then transformed into stereotaxic space with the Montreal Neurological Institute 1 mm isotropic T1 space template using the symmetric image normalization method in Advanced Normalization Tools (ANTs) [10]. A probability map of high PD regions and all lesions across all subjects was generated. Five peri-lesional bands covering the adjacent normal appearing WM (NAWM) were generated by dilating the lesion masks with one voxel, for each band, in order to compare the median PD and T1 values in each band with the lesional values and the global WM. Analysis of variance with Bonferroni correction for multiple comparisons was used to identify the groups that have significantly different median PD and T1 values in different regions.Results
T1W intensity was negatively correlated with PD as expected (R = −0.87, p<0.01, R2 = 0.756) and the FLAIR signal was suppressed for high PD volumes within the lesions, roughly for PD≥0.85 (Figure 1). Two example datasets displaying this FLAIR signal suppression due to high PD lesional areas are shown in Figure 2. The threshold for high PD and T1 regions was set to 0.905 and 1950.3 ms, respectively. High PD regions showed a high probability of occurrence near the boundary of lateral ventricles (Figure 3). As shown in Figure 4, EDSS score (FDR<10%) and nine-hole peg test (dominant and non-dominant hand, FDR<5%) were significantly correlated with both the total lesion volume and the volume of high PD regions (p<0.05). The plots in Figure 5 include all lesions in 20 subjects, and show that the PD and T1 maps exhibited significantly higher median values for high PD regions within the lesions and the remaining lesional tissue (p<0.001). Additionally, the PD values of first NAWM perilesional band directly adjacent to the lesional boundary displayed a significant difference (p<0.05) as compared to the global WM.Discussion and Conclusion
Lesions with high PD had the highest probability of occurrence at the boundary of the lateral ventricles and likely represent chronic lesions with significant local tissue rarefaction. Moreover, the perilesional NAWM exhibited subtly increasing PD and T1 values from the NAWM up to the lesion boundary. Unlike on the T1 maps, the perilesional band adjacent to the lesion boundary possessed significantly higher PD value than the global WM PD values. This shows that PD maps were sensitive to the subtle changes in NAWM surrounding the lesions. For the above-mentioned reasons, the PD and T1 maps act as an essential complement to the conventional clinical sequences (T1W and FLAIR).Acknowledgements
The data was collected with the collaboration with AbbVie Inc. This work was also supported, in part, by the Silverman Endowment Fund at Wayne State University and by the Office of the Vice President for Research at Wayne State University for their support of the MR Research Facility.References
[1] Y. Chen, S. Liu, Y. Wang, Y. Kang, and E. M. Haacke, “STrategically Acquired Gradient Echo (STAGE) imaging, part I: Creating enhanced T1 contrast and standardized susceptibility weighted imaging and quantitative susceptibility mapping,” Magn Reson Imaging, vol. 46, pp. 130–139, Feb. 2018, doi: 10.1016/j.mri.2017.10.005.
[2] Y. Wang et al., “STrategically Acquired Gradient Echo (STAGE) imaging, part II: Correcting for RF inhomogeneities in estimating T1 and proton density,” Magn Reson Imaging, vol. 46, pp. 140–150, Feb. 2018, doi: 10.1016/j.mri.2017.10.006.
[3] E. M. Haacke et al., “STrategically Acquired Gradient Echo (STAGE) imaging, part III: Technical advances and clinical applications of a rapid multi-contrast multi-parametric brain imaging method,” Magn Reson Imaging, vol. 65, pp. 15–26, 2020, doi: 10.1016/j.mri.2019.09.006.
[4] K. P. Whittall, A. L. MacKay, D. A. Graeb, R. A. Nugent, D. K. Li, and D. W. Paty, “In vivo measurement of T2 distributions and water contents in normal human brain,” Magn Reson Med, vol. 37, no. 1, pp. 34–43, Jan. 1997, doi: 10.1002/mrm.1910370107.
[5] P. Farace, R. Pontalti, L. Cristoforetti, R. Antolini, and M. Scarpa, “An automated method for mapping human tissue permittivities by MRI in hyperthermia treatment planning,” Phys Med Biol, vol. 42, no. 11, pp. 2159–2174, Nov. 1997, doi: 10.1088/0031-9155/42/11/011.
[6] R.-M. Gracien et al., “The Relationship between Gray Matter Quantitative MRI and Disability in Secondary Progressive Multiple Sclerosis,” PLoS One, vol. 11, no. 8, p. e0161036, 2016, doi: 10.1371/journal.pone.0161036.
[7] S. Gutteridge, C. Ramanathan, and R. Bowtell, “Mapping the absolute value of M0 using dipolar field effects,” Magn Reson Med, vol. 47, no. 5, pp. 871–879, May 2002, doi: 10.1002/mrm.10142.
[8] P. Schmidt, “Bayesian inference for structured additive regression models for large-scale problems with applications to medical imaging,” Ludwig-Maximilians-Universität München, 2017.
[9] Y. Benjamini and Y. Hochberg, “Controlling the False Discovery Rate: A Practical and Powerful Approach to Multiple Testing,” Journal of the Royal Statistical Society. Series B (Methodological), vol. 57, no. 1, pp. 289–300, 1995.
[10] B. B. Avants, C. L. Epstein, M. Grossman, and J. C. Gee, “Symmetric diffeomorphic image registration with cross-correlation: evaluating automated labeling of elderly and neurodegenerative brain,” Med Image Anal, vol. 12, no. 1, pp. 26–41, Feb. 2008, doi: 10.1016/j.media.2007.06.004.
Figures
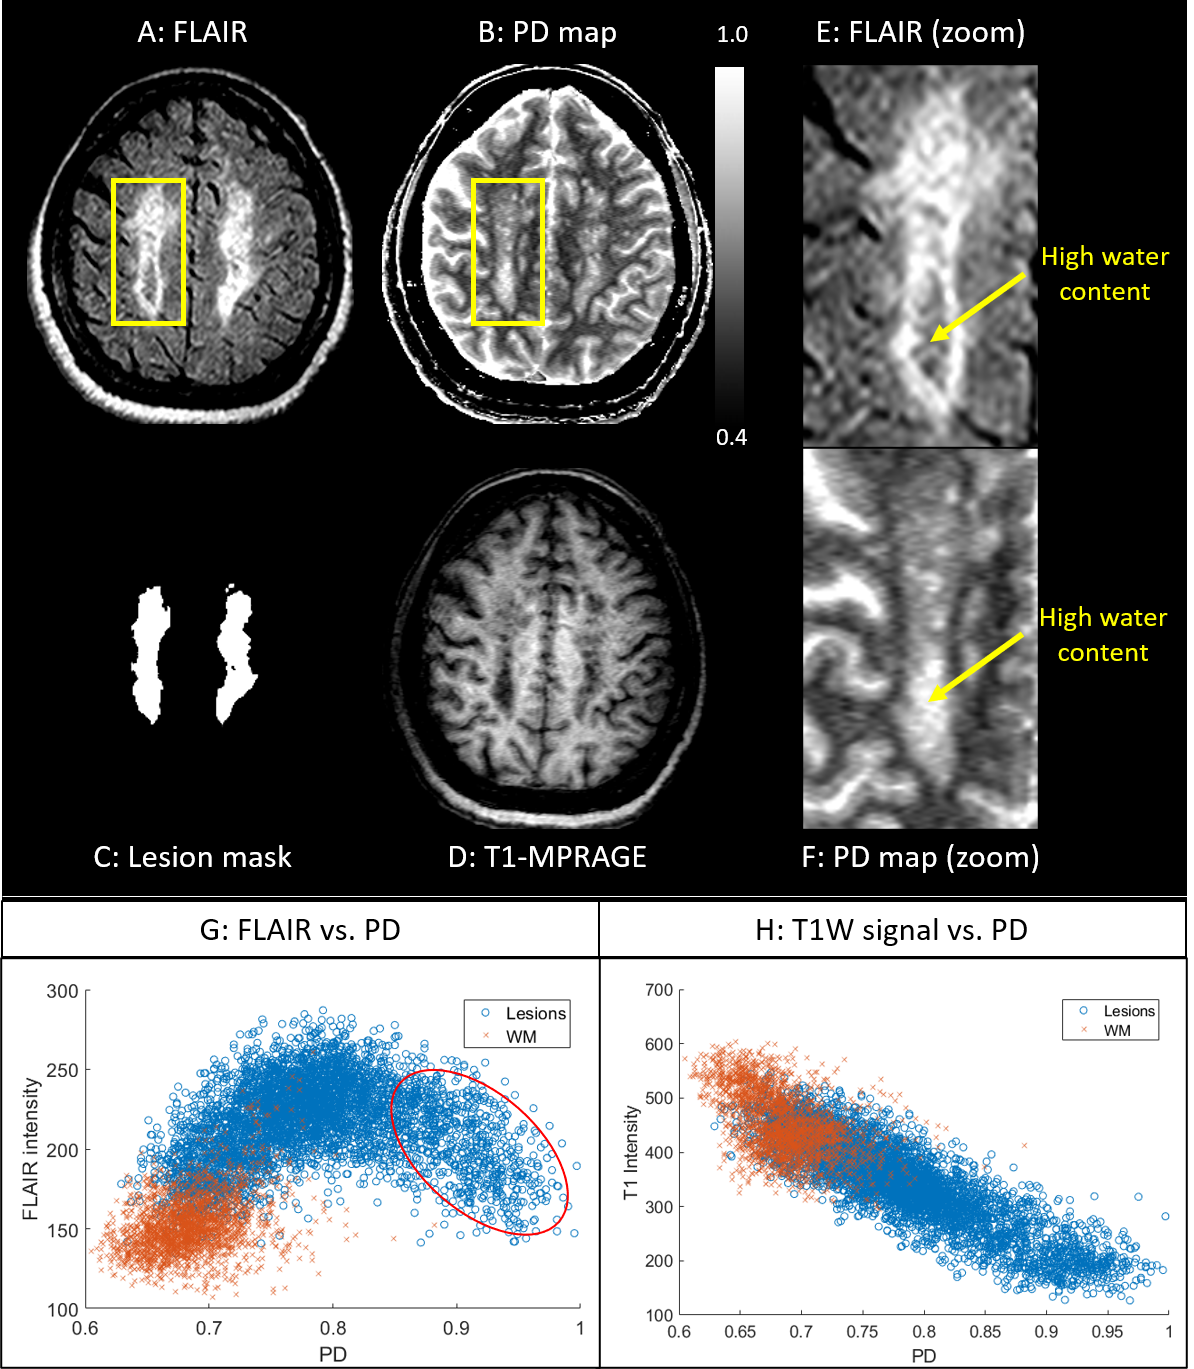
Figure 1. Original FLAIR (A), the STAGE-derived PD image (B) extracted lesion mask (C), and the original T1W data (D) demonstrate that the lesions with the high PD (yellow arrows) are the darkest in the T1W data. The same region on the FLAIR data is isointense with the surrounding white matter, and exhibits high PD as demonstrated by plot (G). This suggests an atrophied area within the lesion, occupied primarily with fluid. Plot (H) displays a negative correlation between the T1W signal and PD, showing agreement between the hypointense T1 signal (including the T1 black holes) with high PD.
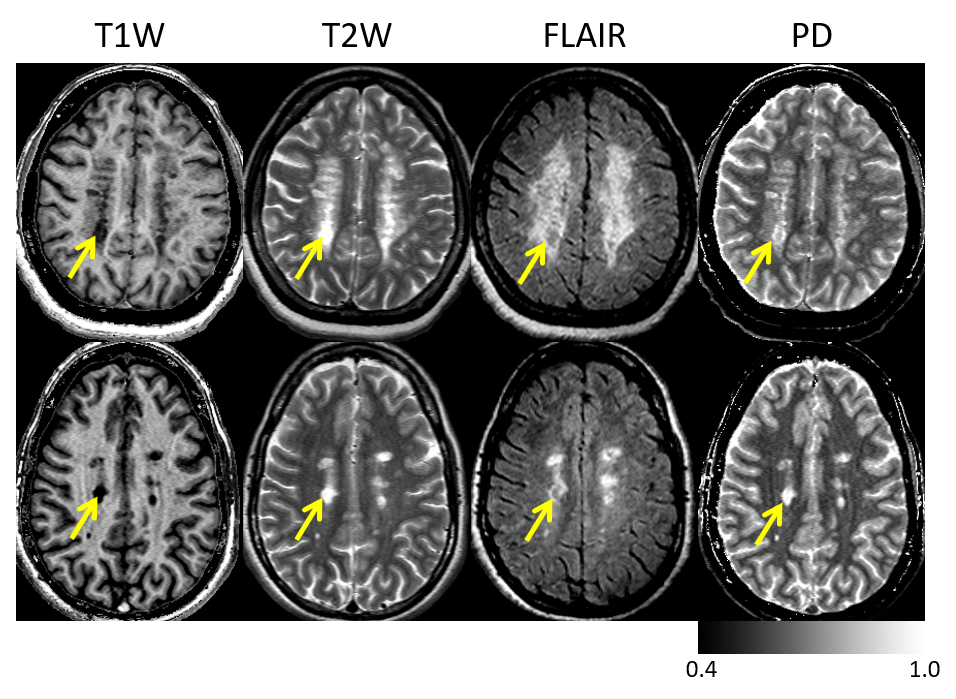
Figure 2. Comparison of the lesion signal on different imaging modalities. Left-to-right: The STAGE T1W data; original T2W data; original FLAIR data and STAGE water content (PD). Each rows represents a different subject. The yellow arrows highlight the lesions with the highest water content that are the brightest on the PD map and darkest in the T1W image. The black holes inside the lesions seen in FLAIR correspond to high PD values in that part of the lesion. Note that although the PD map looks similar to the T2W image, it is, in fact, a quantitative representation of absolute water content.
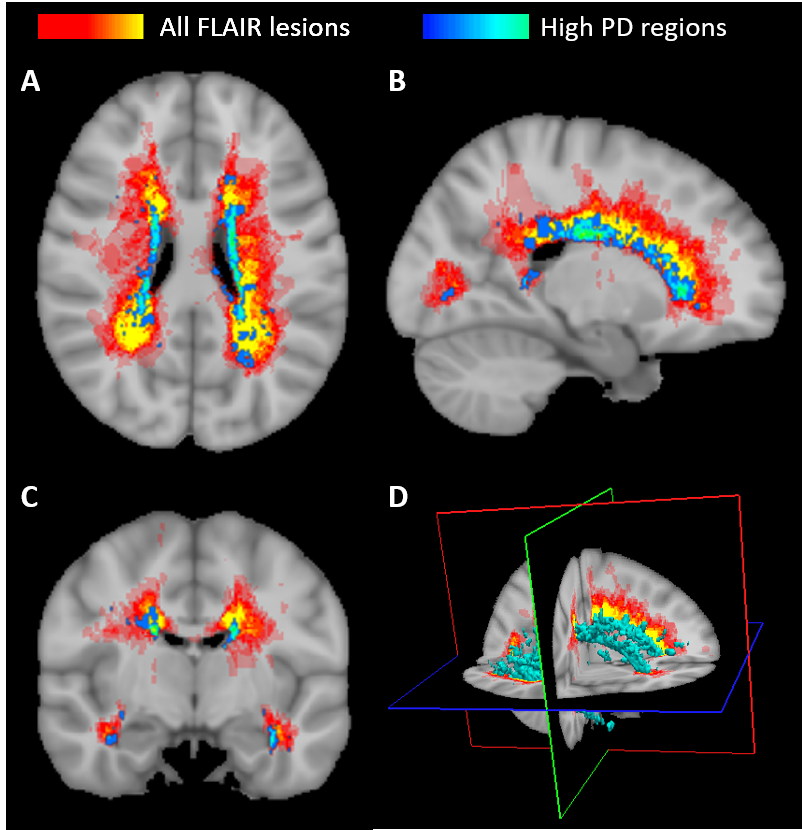
Figure 3. Probability map of high PD regions (where blue represents high probability of PD lesions) superimposed on the averaged total lesion map (red-to-yellow, where yellow represents high probability of lesion occurrence for the rest of the lower water content lesions) obtained as an average across all subjects. An example orthogonal view of the map is shown in (A: axial, B: sagittal and C: coronal views), whereas the image in (D) displays the 3D rendered overlay of the high PD regions along with the FLAIR lesion probability map.
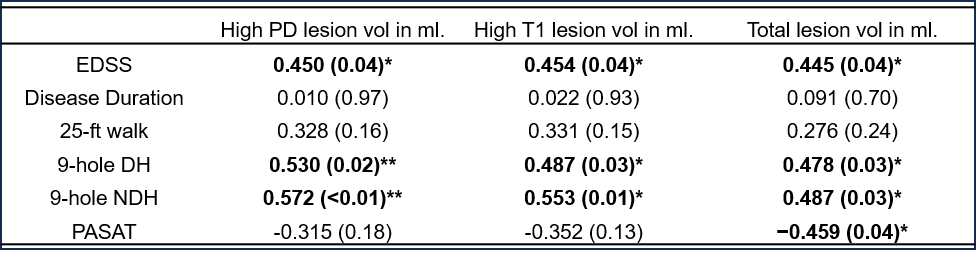
Figure 4. Pearson’s correlation coefficients comparing the clinical/neuropathological demographics and scores [including EDSS, disease duration (DD), MSFC tests, the nine-hole peg test (dominant hand (DH) and non-dominant hand (NDH)), paced auditory serial addition test (PASAT), and a timed 25-foot walk test] with the volumes of all lesions, high T1 regions and high PD regions within these lesions. The values in bold represent significant correlations (p < 0.05) and the p-values are shown in the brackets. *FDR<10%. **FDR<5%.
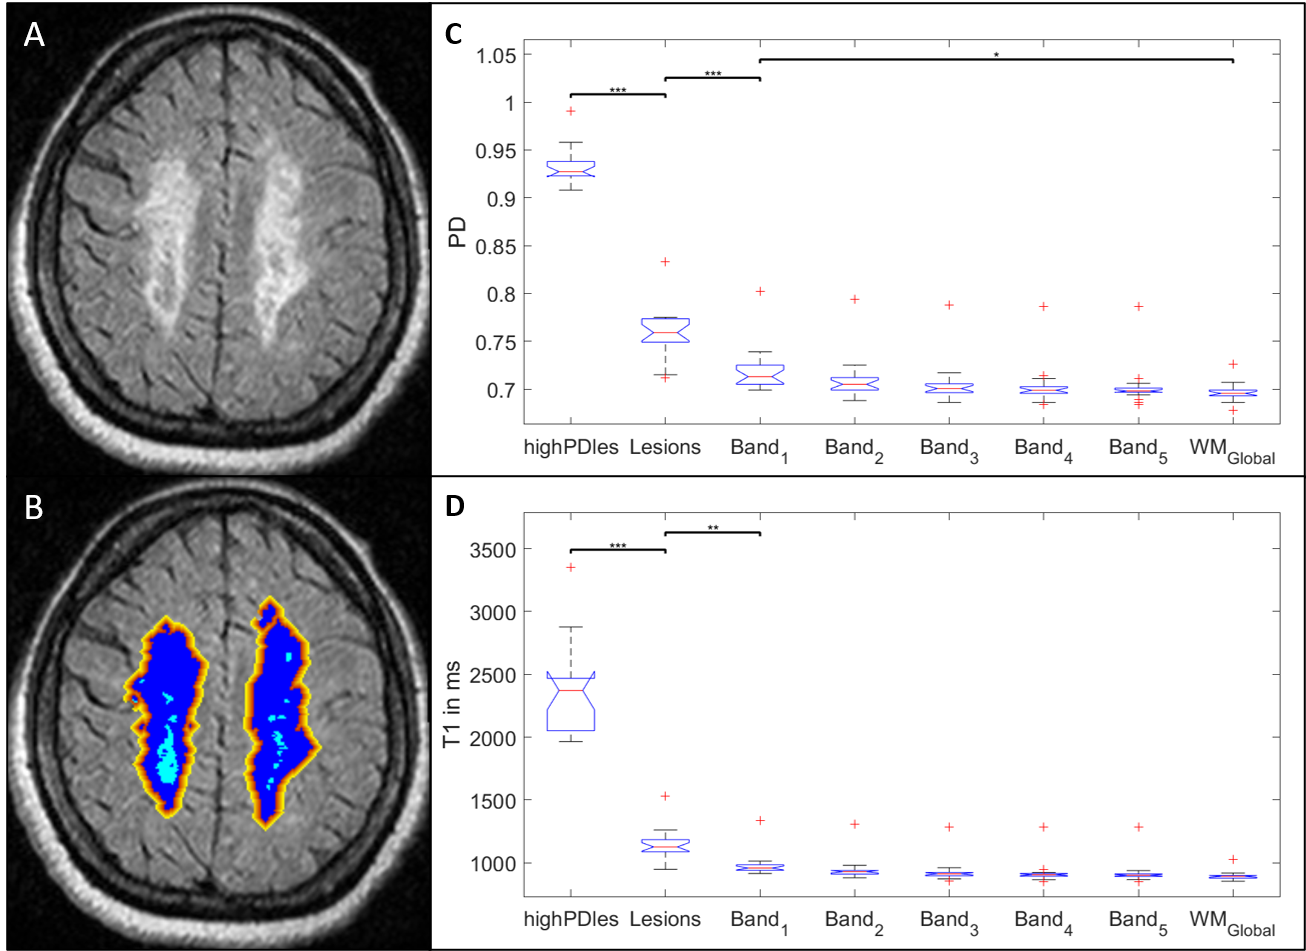
Figure 5. (A) Original FLAIR and (B) the same FLAIR data with the overlays of the segmented five perilesional NAWM bands surrounding the lesions (color coded from red to yellow starting from the lesion boundary). Each perilesional band was generated by dilating the lesion mask (blue) with one voxel. Comparison of the (C) PD and (D) T1 values in different regions, namely, the high PD regions within the lesions (highPDles), the remaining lesional tissue (lesions), five perilesional NAWM bands, and the global NAWM mask (WMGlobal). *p < 0.05, **p < 0.01 and ***p < 0.001.