2941
Quantitative Myelin Assessment for Multiple Sclerosis Using Multi-Inversion Magnetic Resonance Fingerprinting1The University of Hong Kong, Hong Kong, Hong Kong
Synopsis
Keywords: Multiple Sclerosis, MR Fingerprinting, Multiple sclerosis; Myelin water
Motivation: Myelin water imaging is a potential tool for observing demyelination in multiple sclerosis (MS).
Goal(s): Using a rapid multiple inversion recovery (mIR) magnetic resonance fingerprinting (MRF) with multiple compartment analysis identified white matter (WM) lesions and evaluated the severity of demyelination by calculating the MWF in WM.
Approach: This is a prospective study. Myelin water fraction (MWF) from mIR-MRF of WM in healthy control (HC), normal appear WM in MS patient, and WM lesion in MS patient were calculated.
Results: The sensitivity of MWF map on identifying WM lesions was 100%. MWF was statistical difference between MS patient and HC.
Impact: The myelin water fraction map achieved from mIR MRF was comparable to FLAIR and MPRAGE in identifying white matter lesions with 100% sensitivity and provided additional insights into the demyelination process of MS.
Introduction
Multiple sclerosis (MS) is an inflammatory demyelination disease that damages the myelin and axon in the brain and spinal cord. White matter (WM) lesions are presented as multiple focal areas of myelin loss in MS patient[1, 2]. Myelin water imaging (MWI) can quantify myelin water by evaluating the water trapped between myelin bilayers via quantitative MRI (qMRI) [3]. MWI is especially useful for monitoring the demyelination and remyelination processes, as it provides a quantitative measurement of myelin water in vivo [4-6]. We recently proposed a rapid multiple inversion recovery (mIR) MRF protocol [7] for multi-compartmental brain water mapping. It is desirable to further develop the mIR MRF for myelin water mapping in clinical settings. Anatomic and compartmental characterization based on T1/T2 MRI relaxometry can provide pathological insights into myelin integrity, which may be sensitive to white matter changes during demyelination and possibly differentiate different phases of WM lesions. To achieve this, the mIR MRF was used to identify various WM lesions and evaluate the severity of demyelination by calculating the MWF in WM.Method
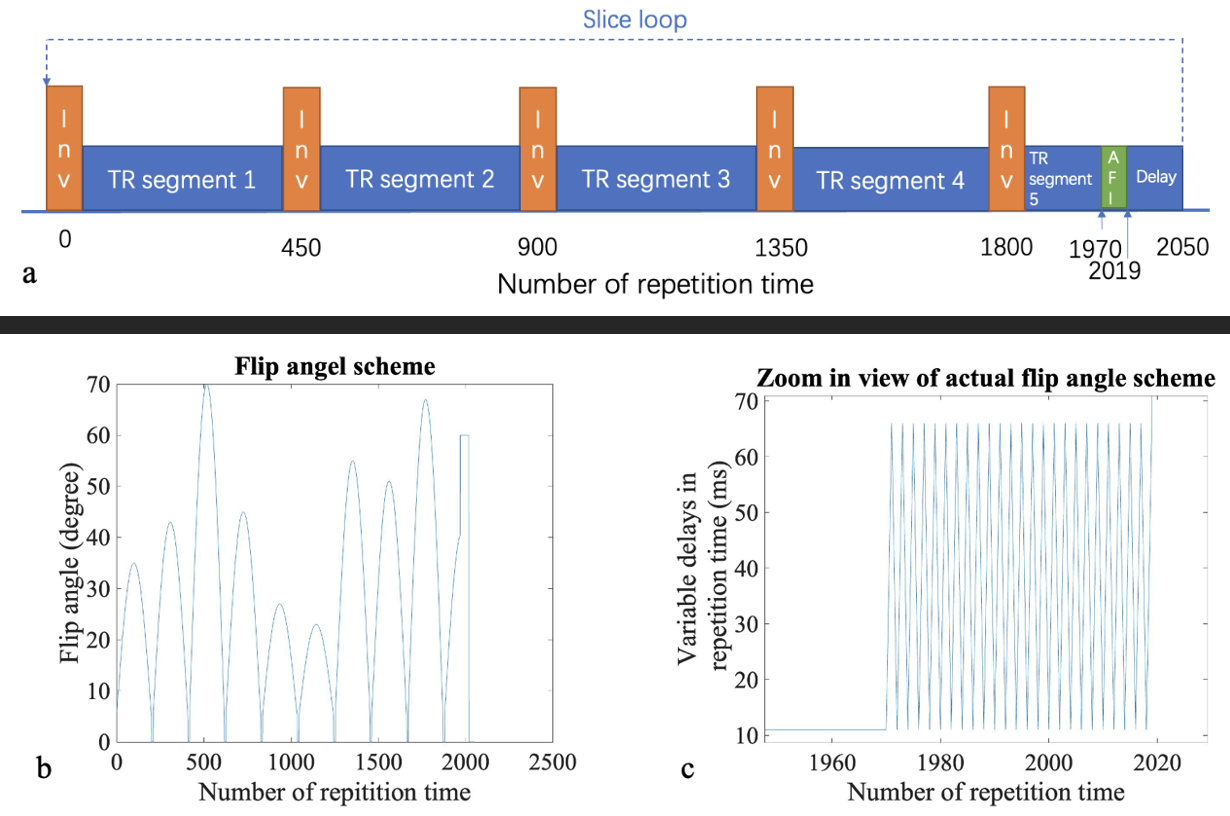
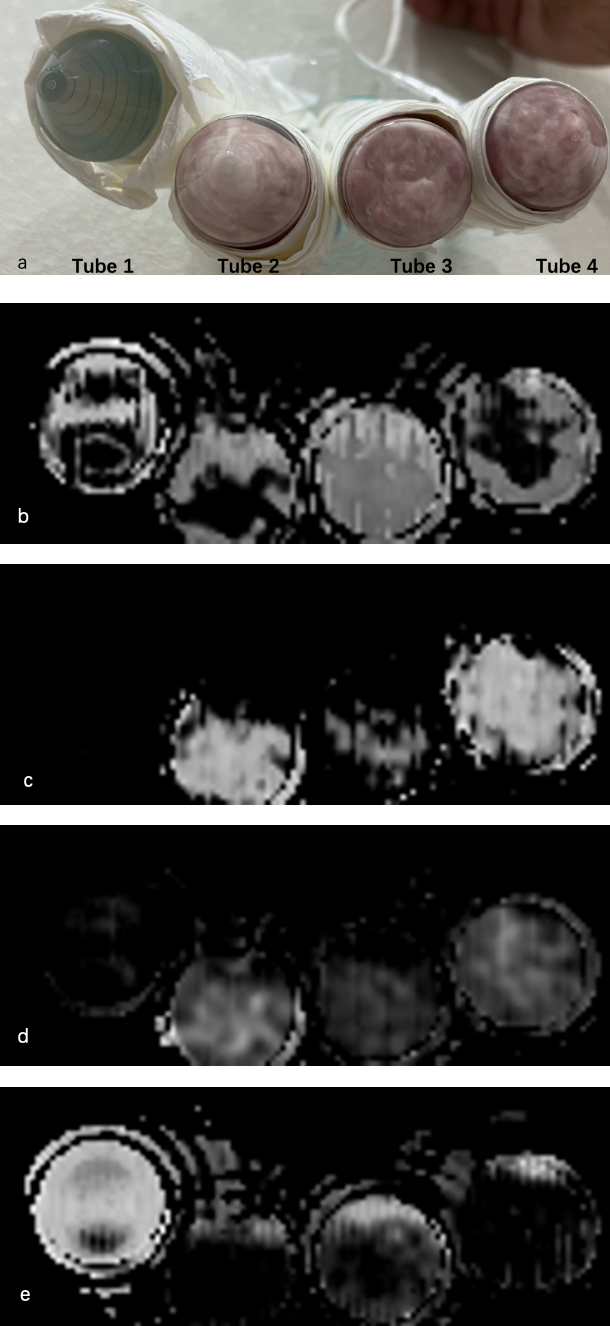
In this study, a phantom consisting of four 45 ml tubes was used. The tubes contained 0.9% saline and different ratios of white and gray matter. Tube 1 contained only saline, while tube 2 contained >80% white matter and <20% gray matter, tube 3 contained >80% gray matter and <20% white matter, tube 4 contained >70% white matter and <30% gray matter. The experimental setup is depicted in figure 2a. In vivo study was performed on two groups of participants: 16 multiple sclerosis patients and 17 healthy control volunteers (HC) recruited from May to November 2023.A 3T MRI (GE, SIGNA Premier) with a 48-channel brain coil was used. Clinical sequences included FLAIR and MPRAGE. For the mIR MRF, a multiple-inversion-recovery fast imaging with steady-state precession (FISP) sequence was used [7]. The inversion was achieved by a slice selective Shinnar-Le Roux pulse. Details were shown in figure 1. The total scan time for mIR MRF was five and half minutes per volunteer. The image reconstruction process used a non-uniform Fourier transform. For multiple compartment analysis, a non-negative least-square (NNLS) algorithm that included a reweighting iteration to update the joint distribution of T1/T2 across the slice/volume was used [8].
The sensitivity of MWF in detecting MS lesions that were calculated. A multiple linear regression model was applied to HC MWF, with gender and age as variables. The age- and gender-corrected MWF values were presented in a box plot indicating normal white matter in HC, NAWM, and WM lesions in patients. The t-test evaluated the statistical difference of MWF values. All analysis was conducted in MATLAB, with a P-value of less than 0.05 indicating statistical significance.
Result
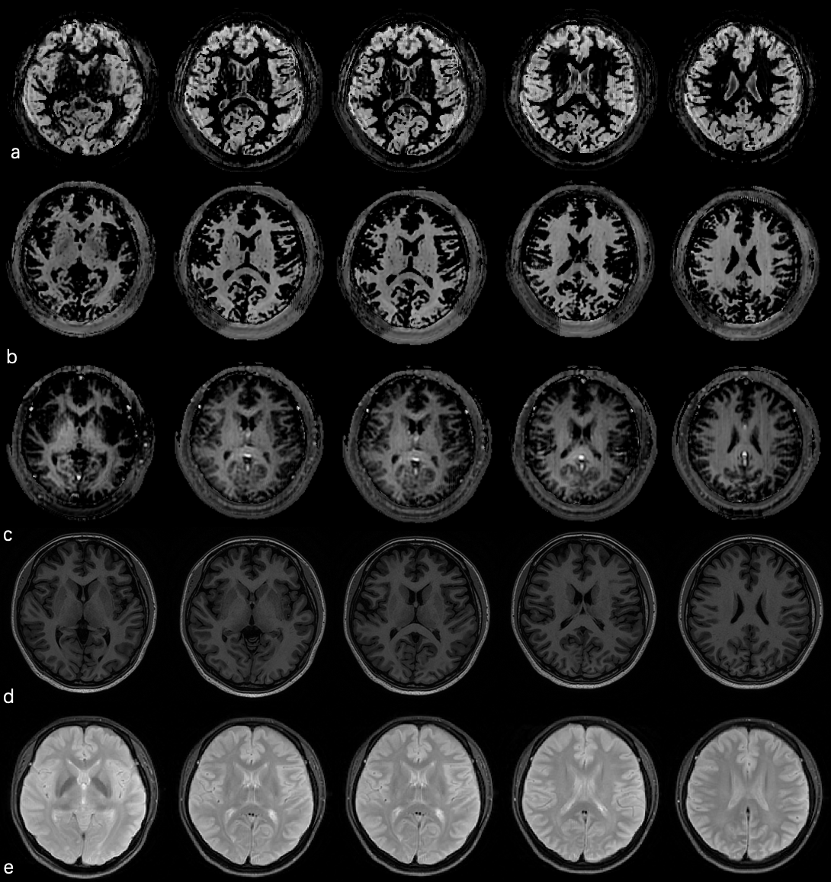
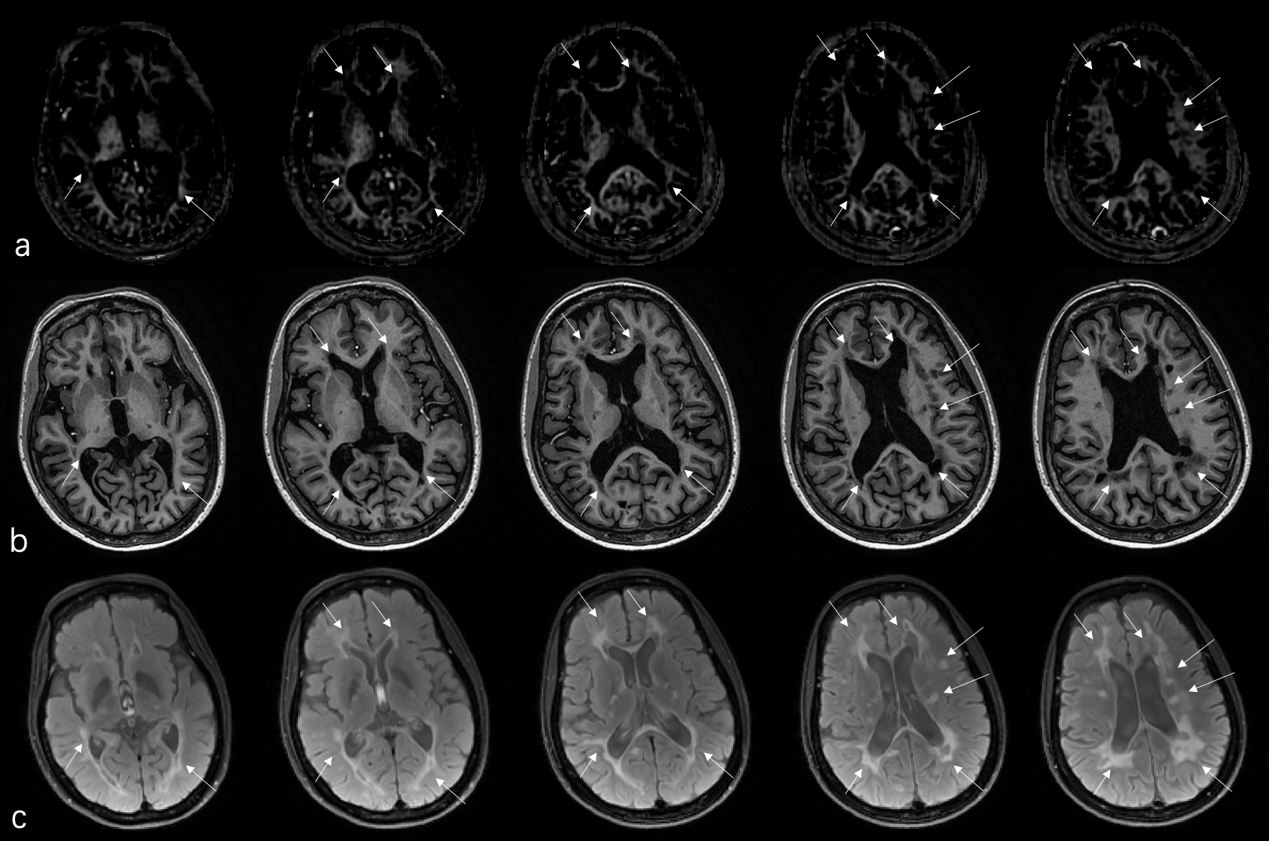
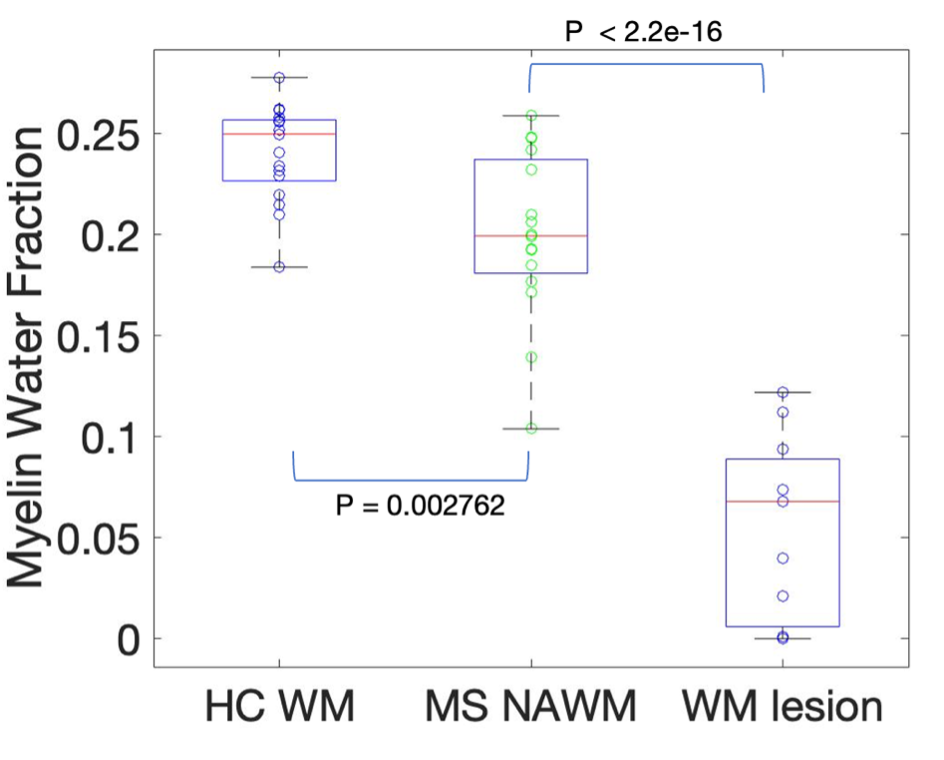
As depicted in Figure 2, the only tube that had a signal in the CSF map was the saline tube. The MWF varied in four tubes due to the different white matter concentrations. Figure 3 displays axial images of a healthy volunteer. The sensitivities of the MWF in detecting the FLAIR and MPRAGE lesions were 100%. Figure 4 displays axial FLAIR, MPRAGE, and MWF map of a MS patient.For the linear regression results in the HC group, gender and age showed insignificant correlations with MWF. The multiple linear regression model for correction was MWFcorrecti = MWFcorrecti + (0.008) *female + (-0.001) × age𝑖 . The MWFs in HC was 0.24 +/- 0.02. The MWF in NAWM and WM lesion of MS patients were 0.20 +/- 0.04 and 0.034 +/- 0.033, respectively. The boxplot of the MWF measurements of WM lesions, NAWM in HC, and WM in MS patients is shown in Figure 5.
Discussion
The phantom result showed that the MWF could be differentiated for tubes with varied myelin water concentrations. The average MWF in healthy controls was significantly higher than in normal-appearing white matter (NAWM) in MS patients, indicating the potential demyelination process in NAWM. The MWF was markedly decreased in white matter lesions compared to NAWM in MS patients. The MWF in NAWM depended on patients' MS stages and the disease severity, thereby having a relatively large diversity in the MS group. The 100% detectability of FLAIR and MPRAGE lesions indicated that the MWF was comparable to FLAIR and MPRAGE in identifying white matter lesions clinically. Meanwhile, the MWF provided insights into the demyelination process, which was more sensitive than MPRAGE for early active lesions and could differentiate inflammation and demyelination with 100% sensitivity compared to FLAIR.Conclusion
The MWF map could identify WM lesions well and provided additional insights into the demyelination.Acknowledgements
This work is supported by Hong Kong HMRF grant number 09201346.References
1. Popescu, B.F.G., I. Pirko, and C.F. Lucchinetti, Pathology of Multiple Sclerosis: Where Do We Stand? Continuum (Minneapolis, Minn.), 2013. 19(4, Multiple Sclerosis): p. 901-921.
2. Popescu, B.F.G. and C.F. Lucchinetti, Pathology of Demyelinating Diseases. Annual review of pathology, 2012. 7(1): p. 185-217.
3. MacKay, A.L. and C. Laule, Magnetic Resonance of Myelin Water: An in vivo Marker for Myelin. Brain plasticity (Amsterdam, Netherlands), 2016. 2(1): p. 71-91.
4. Laule, C., et al., Myelin water imaging of multiple sclerosis at 7 T: Correlations with histopathology. NeuroImage (Orlando, Fla.), 2008. 40(4): p. 1575-1580.
5. Laule, C., et al., Water content and myelin water fraction in multiple sclerosis - A T-2 relaxation study. Journal of neurology, 2004. 251(3): p. 284-293.
6. Du, Y.P., et al., Fast multislice mapping of the myelin water fraction using multicompartment analysis of T2 decay at 3T: a preliminary postmortem study. Magnetic resonance in medicine, 2007. 58(5): p. 865-870.
7. Cui, D., E.S. Hui, and P. Cao, A multi-inversion-recovery magnetic resonance fingerprinting for multi-compartment water mapping.Magnetic resonance imaging, 2021. 81: p. 82-87.
8. Nagtegaal, M.A., et al., Fast multi-component analysis using a joint sparsity constraint for MR fingerprinting. Magnetic resonance in medicine, 2020. 83(2): p. 521-534.
Figures