2940
To evaluate the degree of brain tissue damage in relapsing-remitting multiple sclerosis patients by using susceptibility weighted imaging1The First Affiliated Hospital of Harbin Medical University, Harbin, China, 2Philips Healthcare, Beijing, China
Synopsis
Keywords: Multiple Sclerosis, Nerves
Motivation: Multiple sclerosis (MS) is a leading cause of disability among young individuals. There is growing evidence showing that vascular and blood flow abnormalities may serve as potential sources of MS lesions.
Goal(s): Our goal was to establish the correlation between the deep medullary veins (DMVs) and the clinical indicators of brain tissue damage in MS.
Approach: Patients were imaged utilizing susceptibility weighted imaging (SWI) to assess the visibility and morphological changes of DMVs.
Results: Damage of DMVs had the significant value in reflecting the degree of brain tissue damage in MS.
Impact: Our demonstration of detectable damage in DMVs utilizing SWI provides a radiological marker for benefiting MS patients in need of assessment.
Introduction
Multiple sclerosis (MS) is an autoimmune-mediated neurodegenerative disease of the central nervous system, which could lead to physical disability and cognitive impairment1,2. Magnetic resonance imaging (MRI) is an increasingly powerful tool for identifying MS and monitoring disease activity3,4. Susceptibility weighted imaging (SWI) is a method that utilizes the intrinsic nature of local magnetic fields to enhance image contrast , which could provide the pathophysiological characteristics and clinical features in patients with MS. Therefore, the aim of this study is to use SWI for investigating the visibility and morphological changes of deep medullary veins (DMVs) in patients with relapsing-remitting multiple sclerosis (RR-MS) , and further explore its clinical application value in evaluating the degree of brain tissue damage.Methods
Clinically diagnosed according to McDonalds’ criteria RR-MS patients who underwent MRI examinations from March to September 2023 were recruited. MRI examinations were performed and analyzed on a 3.0 Tesla MR scanner (Ingenia Elition; Philips Healthcare, Best, the Netherlands) with a 32-channel phased-array head coil. Expanded Disability Status Scale (EDSS) was evaluated before MRI scanning. Main scanning parameters involved SWI, 3D T1WI, T2WI, 3D T2 FLAIR, etc. The procedure of post-processing are as follows: Firstly ,the DMVs were counted based on the minimum intensity projection of the SWI phase image5(Figure 1). The visual score of DMVs is based on brain region-specific continuous plane of phase map according to previous approach6(Figure 2). Secondly, the gray matter (GM), white matter (WM), and cerebrospinal fluid (CSF) were automatically segmented based on structural T1-weighted images using SPM12. In addition, images performed by 3D T2 FLAIR sequences were transmitted to the ISP workstation for offline post-processing, then the number and volume of lesions in the brain were semi-automatically delineated.For statistical calculation, normally distributed continuous variables were compared by Student’s t-test. Non-normally distributed continuous variables were verified by Mann-Whitney U test. Categorical variables were assessed by chi-square test. Spearman correlation analysis was performed to examine the correlation among these parameters. All data were calculated by SPSS 26.0 software. P< 0.05 was considered statistically significant.Result
20 RR-MS patients (35.38±1.68 years, 76% female) and 20 healthy volunteers (33.55±1.65 years, 45% female) were finally recruited. Compared with healthy volunteers, MS patients had lower venous visibility and higher DMVs score (all P < 0.05). The volume of GM , WM, BHF and cortical thickness in RR-MS patients were lower than those in healthy controls (P < 0.05) (Table 1, Figure 3). The DMVs visibility of 20 patients with RR-MS was negatively correlated with T2 lesions count(r=-0.470, P=0.032), positively correlated with the GM volume of left thalamus (r=0.601, P=0.005) and right thalamus (r=0.528, P=0.017)(Figure 4). The DMVs score was significantly positively correlated with T2 lesions count(r=0.690, P=0.001), T2 lesion volume (r=0.810, P<0.001), and EDSS score (r=0.669, P=0.001), but negatively correlated with the GM volume of left thalamus (r=-0.599, P=0.005) and right thalamus (r=-0.557, P=0.011) (Figure 4).Discussion
The DMVs are the parenchymal veins located within the white matter, eventually connecting the deep venous system. The distribution and morphology of MS lesions are related to the origin of perivenous inflammation7. We leveraged the excellent visibility of the venous vascular system on SWI to quantify and characterize the changes of DMVs, and associated them with established disease indicators. The results showed a decreased visibility of DMVs in the MS group, consistent with previous findings of Sinnecker and Ge et al. which were based on higher field strength8,9. The brain region-based DMVs score6was first applied to MS by using the three-dimensional information of the vein obtained through SWI. It provided a clearer depiction of the extent of DMVs disruption in MS and revealed a stronger correlation between the DMVs score and the degree of brain tissue damage. This may provide in vivo confirmation of the role in DMVs for the pathogenesis with MS. The analysis of various studies on MS veins showed that various materials including inflammation, vasculitis, abnormal blood flow, fibrin and collagen deposition lead to further reduction of blood flow and damage of perivascular medullary veins10. These factors will eventually lead to the loss of nerve cells and glial cells, accompanied by varying degrees of brain atrophy,culminating in permanent disability and cognitive impairment .Conclusions
Our results established a clear correlation between the visibility and morphological changes of DMVs and the clinical indicators of brain tissue damage in RRMS. These evidences provide the potential utility of SWI as a novel radiological marker for evaluating the severity of MS disease.Acknowledgements
No acknowledgement found.References
1. Compston, A, Coles, A. Multiplesclerosis. LANCET. 2008; 372 (9648): 1502-17. doi:10.1016/S0140-6736(08)61620-7
2. McGinley, MP, Goldschmidt, CH,Rae-Grant, AD. Diagnosis and Treatment of Multiple Sclerosis: A Review. JAMA-JAM MED ASSOC. 2021; 325 (8): 765-779. doi: 10.1001/jama.2020.26858
3. Kira, JI. Redefining use of MRIfor patients with multiple sclerosis. LANCET NEUROL. 2021; 20 (8): 591-592.doi: 10.1016/S1474-4422(21)00203-9
4.Enzinger,C., Barkhof, F., Ciccarelli, O. et al. Nonconventional MRI and microstructuralcerebral changes in multiple sclerosis. Nat RevNeurol11,676–686(2015). https://doi.org/10.1038/nrneurol.2015.194
5. Ao, DH, Zhang, DD, Zhai, FF, etal. Brain deep medullary veins on 3-T MRI in a population-based cohort. JCEREBR BLOOD F MET. 2020; 41 (3): 561-568. doi: 10.1177/0271678X20918467
6.ZhangRuiting,Zhou Ying,Yan Shenqiang,et al.A Brain Region-Based Deep Medullary VeinsVisual Score on Susceptibility Weighted Imaging.Frontiers in agingneuroscience.2017;9:269.doi:10.3389/fnagi.2017.00269
7.T Taoka, T, Fukusumi, A, Miyasaka,T, et al. Structure of the Medullary Veins of the Cerebral Hemisphere andRelated Disorders. RADIOGRAPHICS. 2017; 37 (1): 281-297. doi:10.1148/rg.2017160061
8. Sinnecker, T, Bozin, I, Dörr, J,et al. Periventricular venous density in multiple sclerosis is inverselyassociated with T2 lesion count: a 7 Tesla MRI study. MULT SCLER J. 2012; 19(3): 316-25. doi: 10.1177/1352458512451941
9. Ge, Y, Zohrabian, VM, Osa, EO,et al. Diminished visibility of cerebral venous vasculature in multiplesclerosis by susceptibility-weighted imaging at 3.0 Tesla. J MAGN RESONIMAGING. 2009; 29 (5): 1190-4. doi: 10.1002/jmri.21758
10. Haacke,EM, Ge, Y, Sethi, SK, et al. An Overview of Venous Abnormalities Related to theDevelopment of Lesions in Multiple Sclerosis. Front Neurol. 2021; 12 561458.doi: 10.3389/fneur.2021.561458
Figures
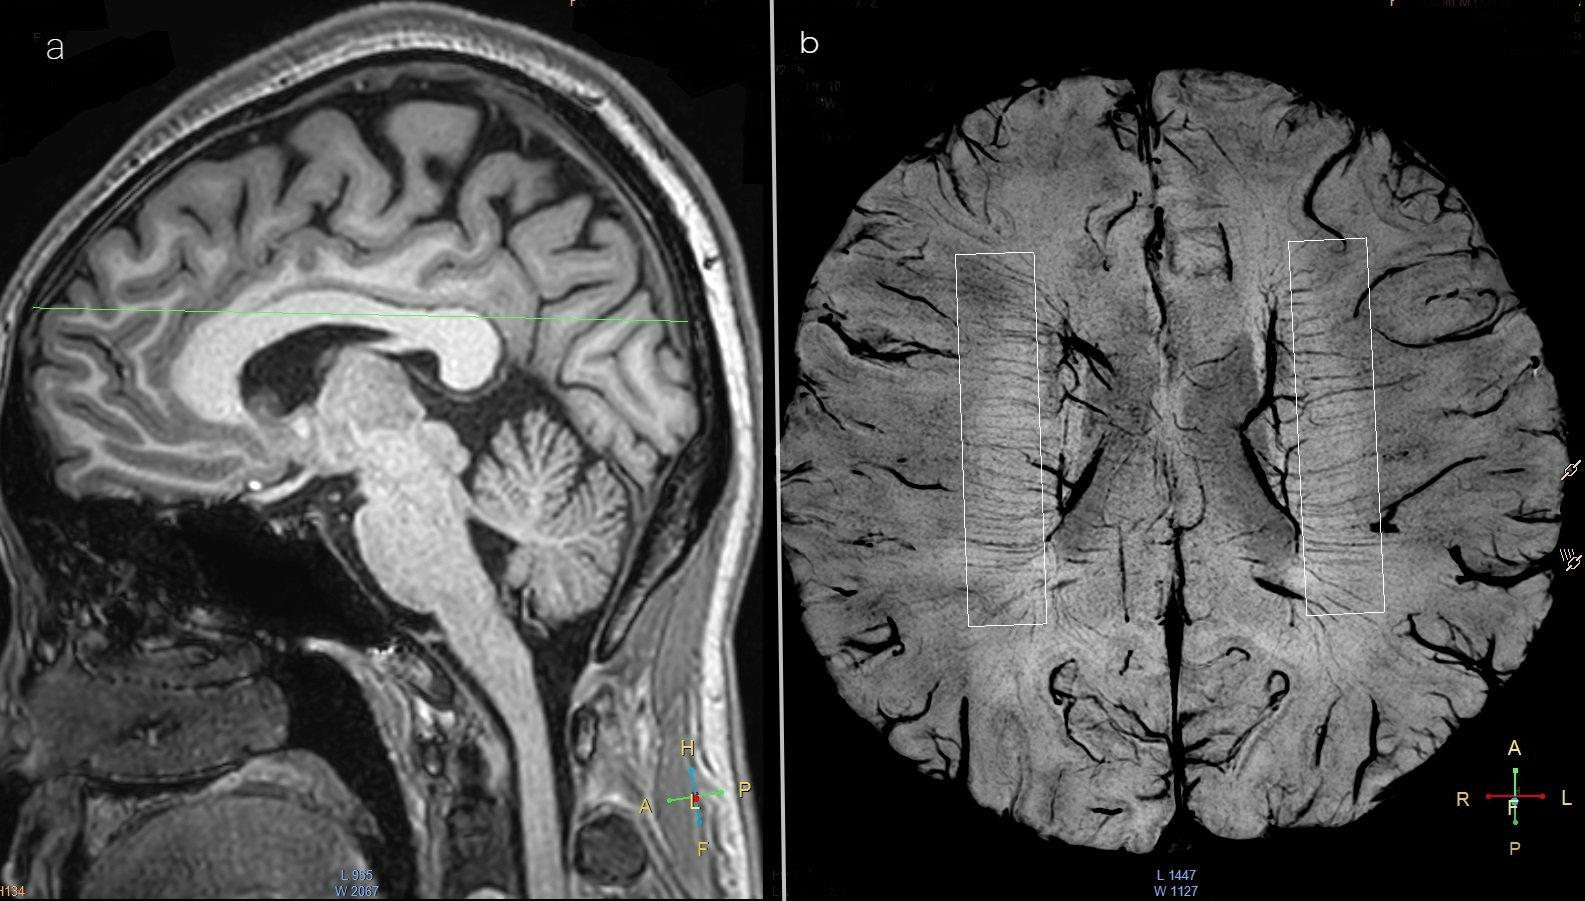
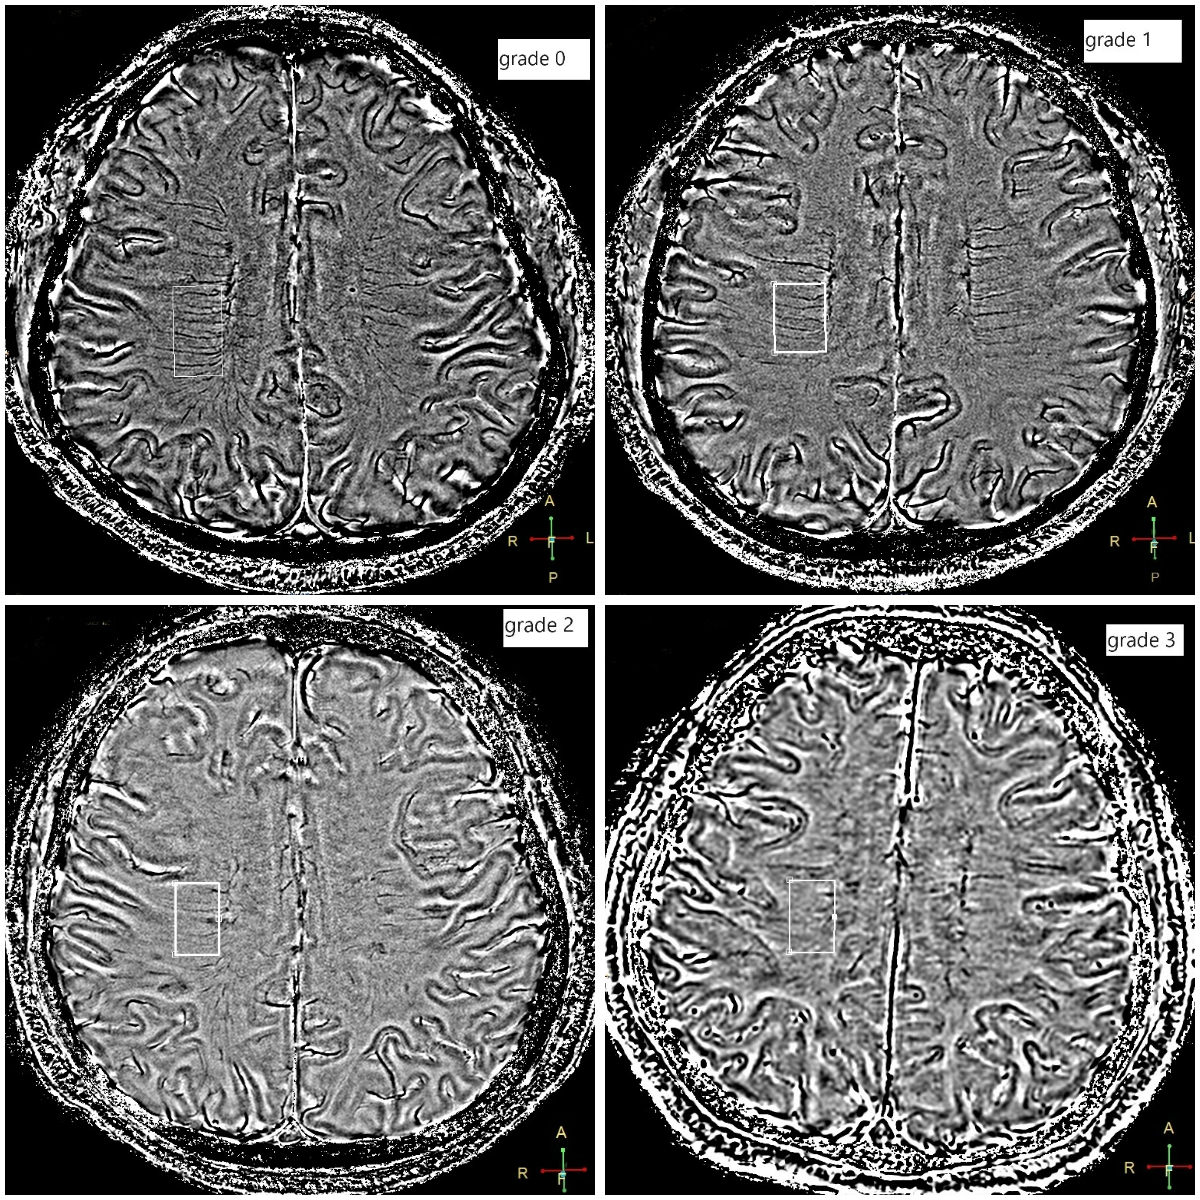
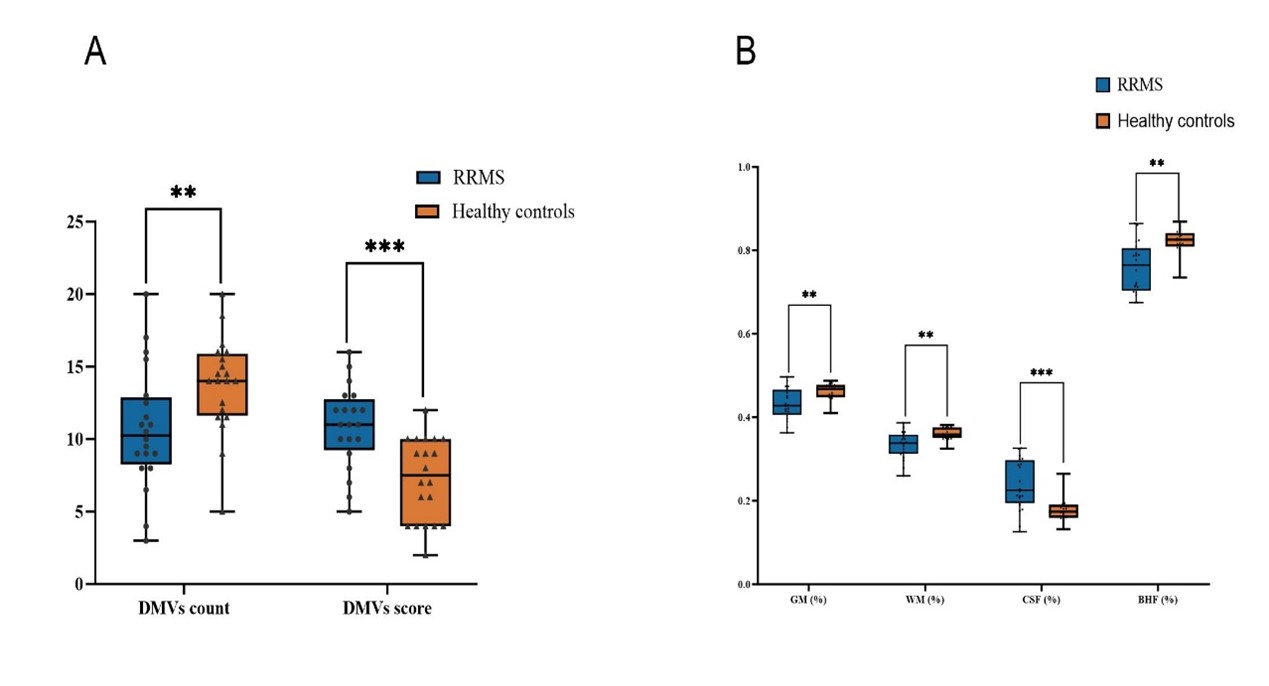
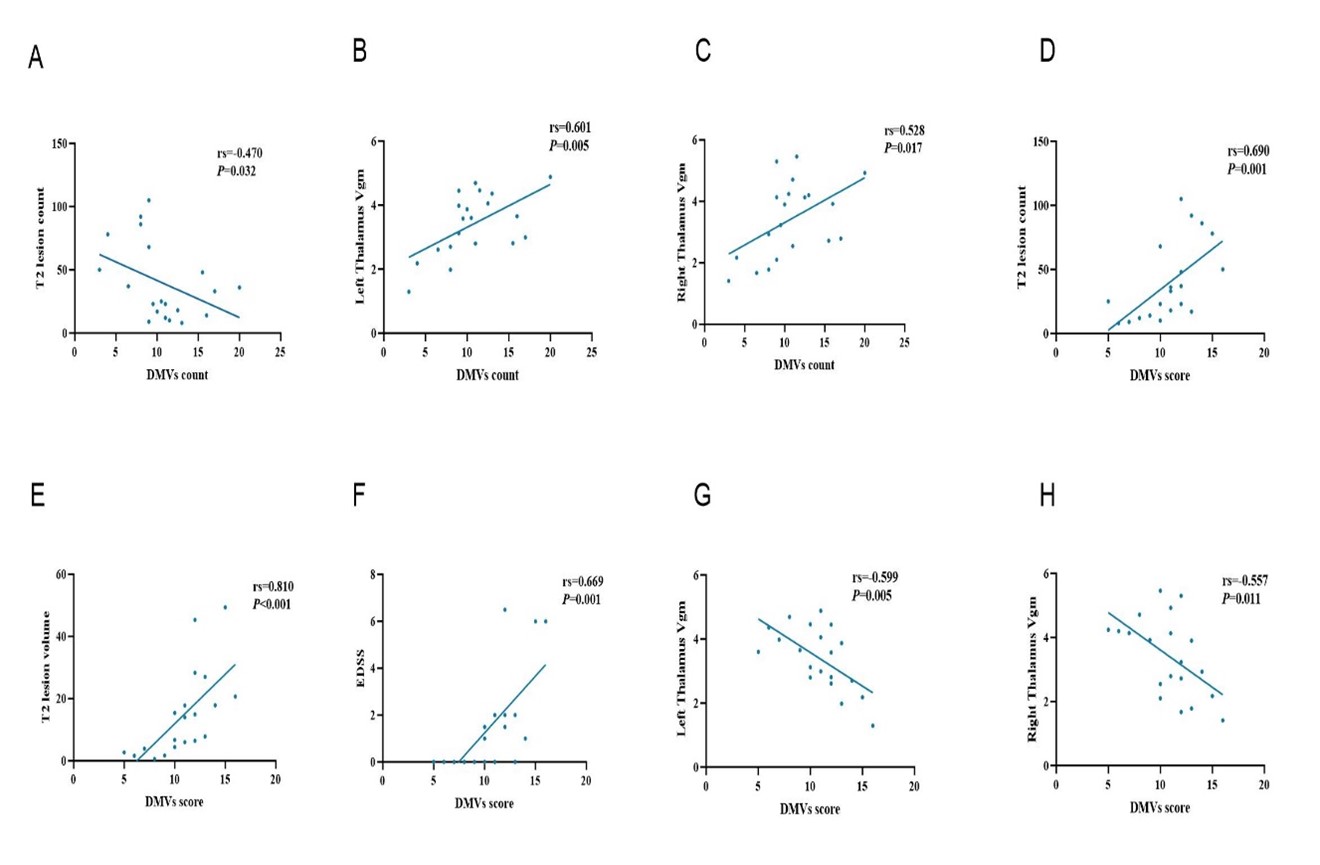
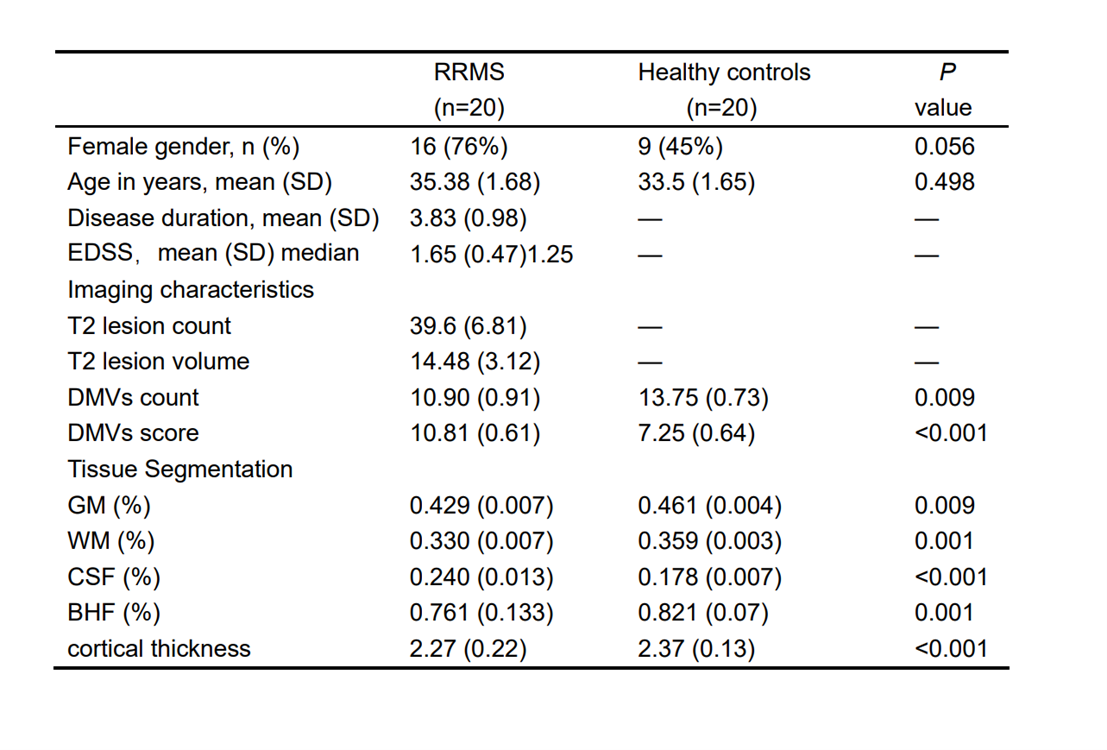
Table 1: Demographic, clinical, and MRI characteristics of RR-MS patients and healthy controls.Continuous variables are given as mean ( standard) deviation;Abbreviations: EDSS, Expanded Disability Status Scale; GM, gray matter; WM, white matter; CSF, cerebrospinal fluid; BHF, Brain parenchymal fraction; DMVs, Deep medullary veins;