2939
Subdivisional Iron Deposition and “Swallow Tail Sign” of Substantia Nigra in RRMS Patients by Quantitative Susceptibility Mapping1The First Affiliated Hospital of Chongqing Medical University, Chongqing, China
Synopsis
Keywords: Multiple Sclerosis, Multiple Sclerosis, Disease Duration; Substantia nigra; Iron; Swallow tail sign; Quantitative susceptibility mapping
Motivation: Regionally progressive iron deposition has not been indicated in the substantia nigra (SN), which is the main impaired region in relapsing-remitting multiple sclerosis (RRMS).
Goal(s): To study the iron accumulation in substantia nigra (SN) subdivisions and “swallow tail sign” in RRMS patients with different DDs.
Approach: Quantitative susceptibility mapping (QSM) values were measured in the anterior and posterior SN at different levels.
Results: QSM values of the SN were higher in RRMS patients with 5-10 years DDs than controls. There were significantly positive correlations between “swallow tail sign” scores and QSM values of the caudal pSN in the patients with long DDs.
Impact: This is a preliminary study providing objective evidence of the iron-related progression of SN subregions in RRMS patients with different DDs, and abnormal “swallow tail sign” may provide an additional imaging maker for MS patients.
Body of the Abstract
IntroductionMultiple sclerosis (MS) is a multifactorial disease of the central nervous system1,2. A growing number of studies demonstrate that increased iron deposition is closely related to the progression and prognosis of MS3,4. The brainstem is commonly involved in MS and is associated with poor prognosis of MS5. Furthermore, some studies reported iron deposition in the substantia nigra (SN) in MS6. The previous studies focused on the iron deposition in the SN as a whole in MS patients7, and little attention was paid to the difference in iron deposition in the subregions of the SN. There have been few reports of abnormal “swallow tail sign” of MS8, but it has not been further correlated with iron deposition in the SN. Regionally progressive iron deposition, including temporal and spatial distribution, has not been indicated in the SN, which is the central impaired region in MS. So, we aimed to retrospectively investigate the characteristics of iron deposition of the SN subdivisions in patients with relapsing-remitting MS (RRMS). We likewise hypothesized that the analysis of the abnormal “swallow tail sign” in the SN could contribute to an accurate diagnosis of MS.
Methods
We retrospectively investigated 53 consecutive RRMS patients (18 patients had disease durations (DDs) ≤ 5 years [Group Les], 17 patients had DDs of 5-10 years [Group Mid], and 18 patients had DDs >10 years [Group Mor]). All the patients underwent brain scans using a 3.0-T MR system, and QSM data was acquired. Firstly, the rostral and caudal SNs (rSN and cSN) were separated. The rostral and caudal levels were selected based on anatomic landmarks. The section showing the red nucleus (RN) with the largest radius was chosen for the rostral level. The section at the level inferior to the RN, where the RN was barely identified or no longer identified, was selected for the caudal level. Then, the anterior SN (aSN) and posterior SN (pSN) were separated along a line that split the whole SN ROIs in half. Through these two splits, each SN was divided into four subregions, which were rostral aSN, rostral pSN, caudal aSN, and caudal pSN (Figure 1). QSM values were measured in each subdivision of SN ROIs. Average values were calculated for each participant across the left and right hemispheres. If the Nigrosome-1 hyperintensity of the SN was visible in droplet, linear, or comma shapes, it was defined as a typical “swallowtail sign” and was scored as 0 (Fgiure 2). If the Nigrosome-1 hyperintensity was blurred or disappeared, it was an abnormal “swallow tail sign” and was scored as 1 (Figure 3).
Results
In the whole SN, QSM values were higher in RRMS subgroups than in healthy controls. At the level of the rostral SN, the QSM values of the rostral pSNs were significantly higher in Group Les than those in Group Con. The QSM values of the rostral pSN in Group Mid were higher than those in Group Con. The QSM values of the rostral aSN in Group Mid were significantly higher than those in Group Con. The QSM values of the rostral aSN and rostral pSN in Group Mor were higher than those in the control group. At the level of the caudal SN, only the QSM values in Group Mid were higher than those in Group Con and Group Les, respectively (Figure 4). The probability of “swallow tail signs” in the Group Con was lower than those both in the Group Mid (11/17,64.71%; P = 0.004) and in the Group More (12/18, 55.56%; P = 0.002).
Discussion
In this study, the mean QSM value of the whole SN in both Group Les and Group Mid was higher than that in Group Con, indicating that iron deposition in the SN in RRMS patients increased with the progression of the disease. This study also found that the QSM values of the SN in Group Mor did not increase with the prolonged disease duration but were lower than those in Group Mid. The author believes that partly because the factors affecting the QSM values of SN are not only the DDs but also the volume of SN, the use of drugs or not, etc9,10.
Conclusion
This is a preliminary study providing objective evidence of the iron-related progression of SN subregions in RRMS patients with different DDs, and abnormal “swallow tail sign” may provide an additional imaging maker for MS patients.
Acknowledgements
Thank Feiyue Yin and Yongmei Li's Help.References
1. Ricigliano VAG, Morena E, Colombi A, et al. Choroid plexus enlargement in inflammatory multiple sclerosis: 3.0-T MRI and translocator protein PET evaluation.Radiology. 2021;301:166-177
2. Zeng C, Du S, Han Y, et al. Optic radiations are thinner and show signs of iron deposition in patients with long-standing remitting-relapsing multiple sclerosis: an enhanced T2*-weighted angiography imaging study.Eur Radiol. 2018;28:4447-4454.
3. Dal-Bianco A, Grabner G, Kronnerwetter C, et al.Long-term evolution of multiple sclerosis iron rim lesions in 7 T MRI.Brain. 2021;144:833-847.
4. Dal-Bianco A, Grabner G, Kronnerwetter C, et al. A distinct hibiscus sabdariffa extract prevents iron neurotoxicity, a driver of multiple sclerosis pathology. Cells. 2022;11:440.
5. Carandini T, Mancini M, Bogdan I, et al. In vivo evidence of functional disconnection between brainstem monoaminergic nuclei and brain networks in multiple sclerosis. Mult Scler Relat Disord. 2021;56:103224.
6. Yarnykh VL, Krutenkova EP, Aitmagambetova G, et al.Iron-insensitive quantitative assessment of subcortical gray matter demyelination in multiple sclerosis using the macromolecular proton fraction.AJNR Am J Neuroradiol. 2018;39:618-625.
7. Blazejewska AI, Al-Radaideh AM, Wharton S, et al.Increase in the iron content of the substantia nigra and red nucleus in multiple sclerosis and clinically isolated syndrome: a 7 Tesla MRI study.J Magn Reson Imaging. 2015;41:1065-1070.
8. Weber CE, Ebert A, Platten M, et al. Susceptibility-weighted 3T MRI of the swallow tail sign in multiple sclerosis: a case-control study. J Neuroimaging. 2020;30:766-768.
9. Blazejewska AI, Al-Radaideh AM, Wharton S, et al. Increase in the iron content of the substantia nigra and red nucleus in multiple sclerosis and clinically isolated syndrome: a 7 Tesla MRI study. J Magn Reson Imaging. 2015;41:1065-1070.
10. Bergsland N, Zivadinov R, Schweser F, et al.Ventral posterior substantia nigra iron increases over 3 years in Parkinson's disease.Mov Disord. 2019;34:1006-1013.
Figures
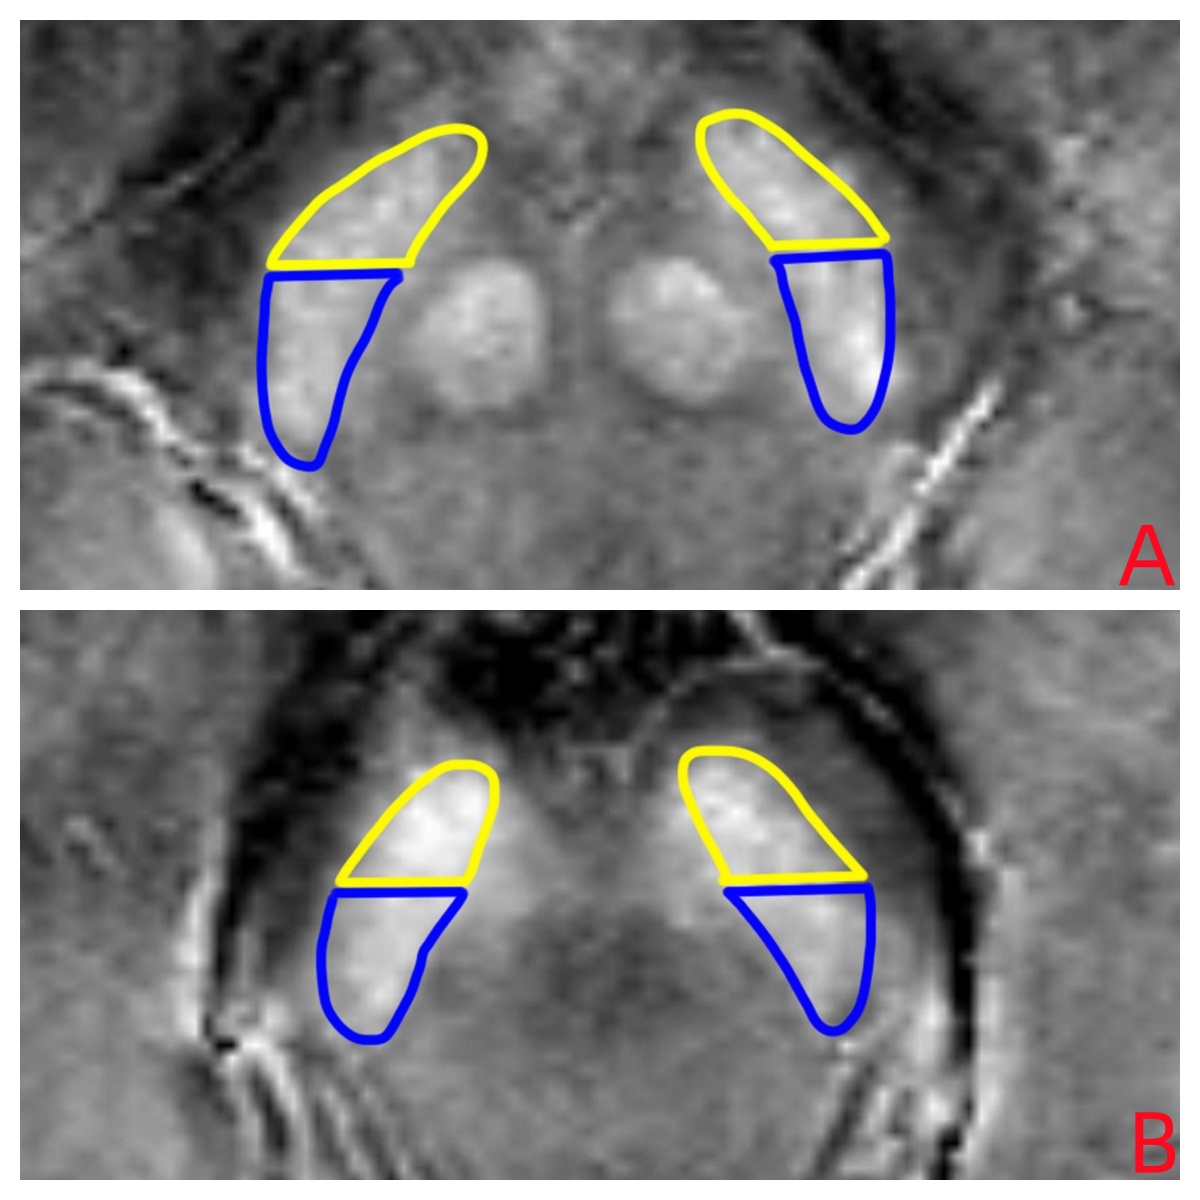
Figure 1: The section showing the red nucleus (RN) with the largest radius was selected for the rostral level (A), and the section at the level inferior to the RN was selected for the caudal level (B). The anterior SN (aSN) (yellow) and posterior SN (pSN) (blue) were separated along a line that splits the whole SN ROIs in half. Each SN was divided into rostral aSN, rostral pSN, caudal aSN, and caudal pSN.
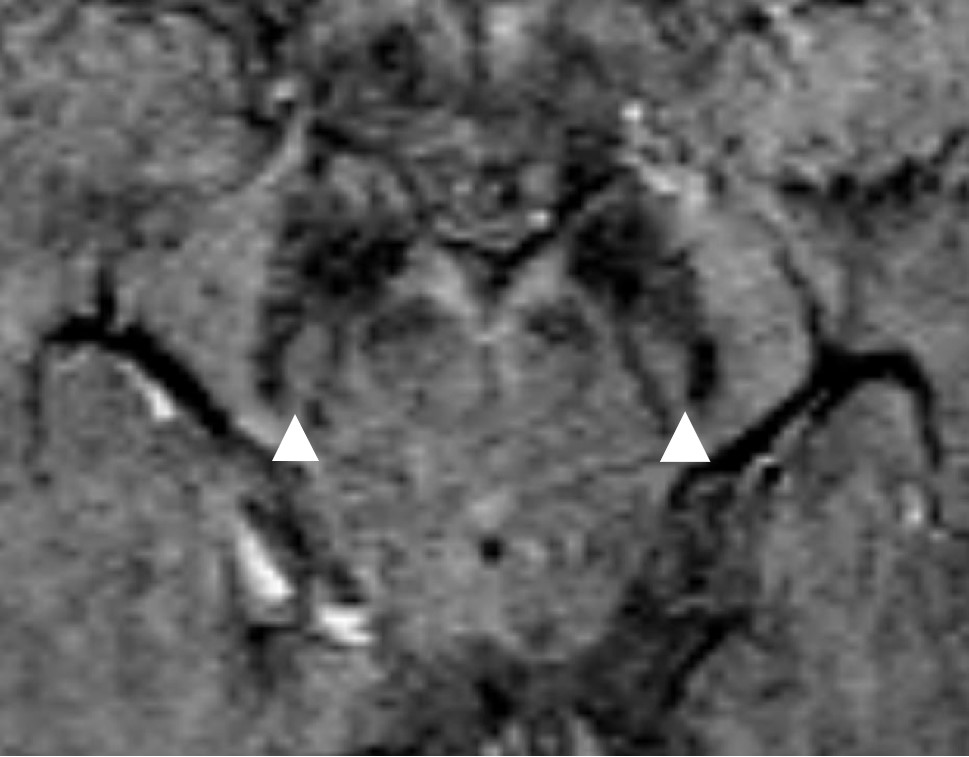
Figure 2: Normal and abnormal “swallow tail sign” on SWI. The normal nigrosome-1 in the posterior part of the bilateral SN showed tail wedge or “water drop” hyperintensity on SWI, and its appearance was like a swallow tail, and the score was 0.
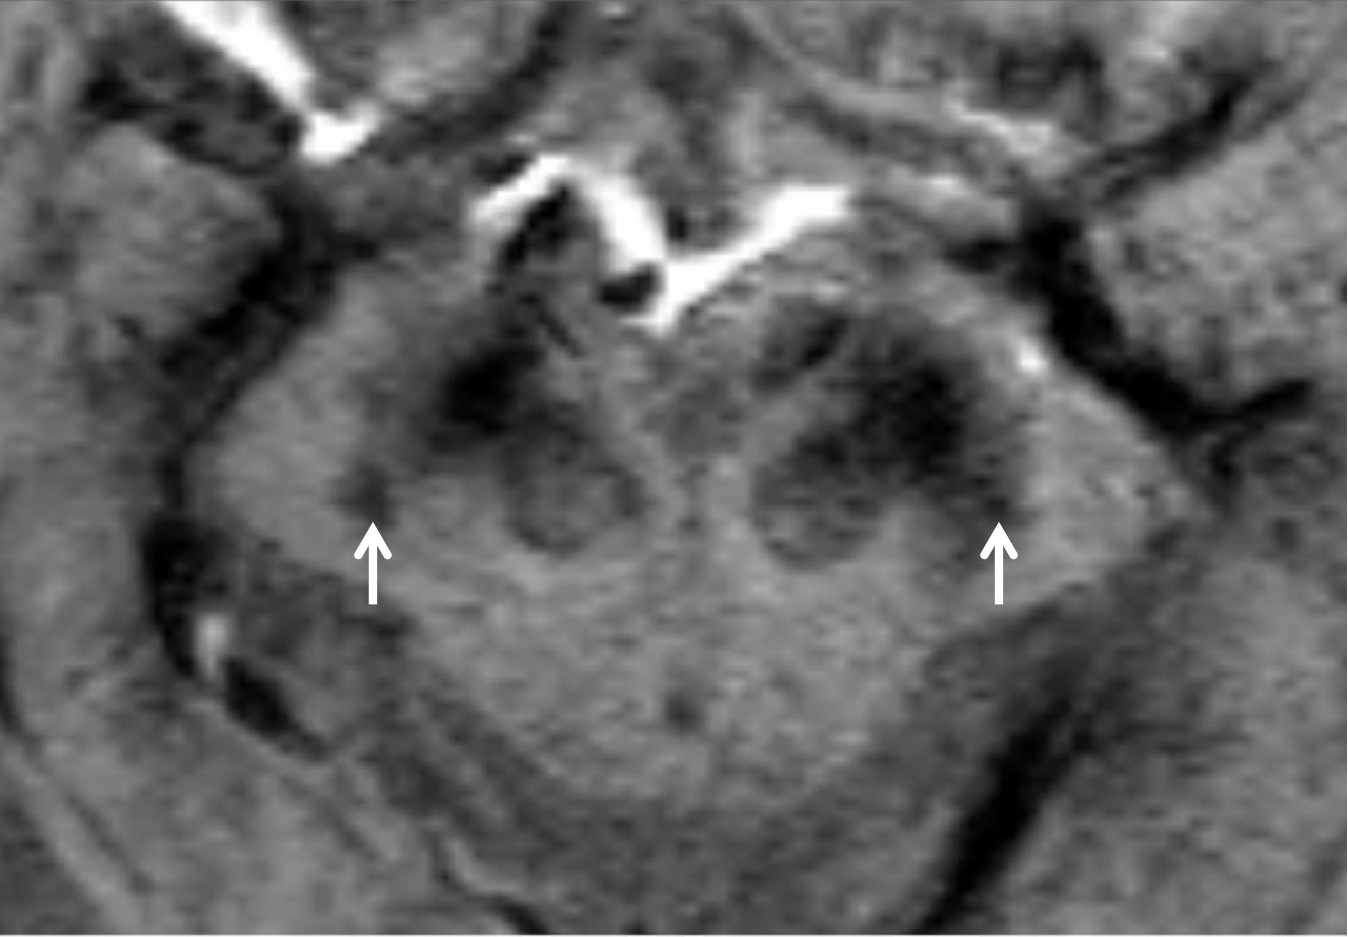
Fgirue 3: The nigrosome-1 hyperintensity was disappeared. It was an abnormal “swallow tail sign” and was scored as 1.
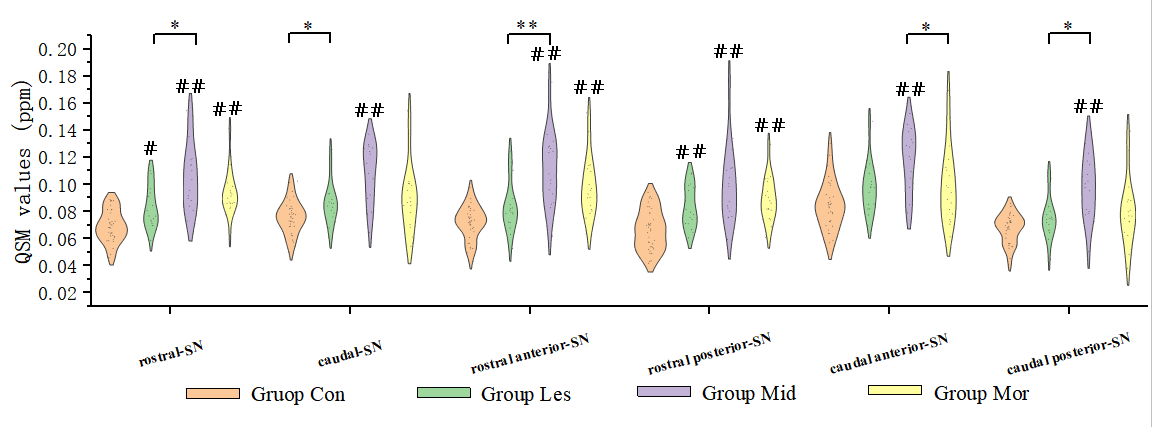
Figure 4: Intergroup differences in the bilateral QSM values in subregions of SN. # represents the comparisons between the MS groups and HC. #, ##, ### indicate P < 0.05, P < 0.01 and P < 0.001. While * represents those between MS subgroups. ** and * indicate P < 0.01 and P < 0.05, respectively, which are regarded as statistically significant.