2938
Strategized Replication: Exploring Inconsistencies in QSM-Based Studies of Brain Iron in Multiple Sclerosis1Buffalo Neuroimaging Analysis Center, Department of Neurology at the Jacobs School of Medicine and Biomedical Sciences, University at Buffalo, The State University of New York, Buffalo, NY, United States, 2Center for Biomedical Imaging, Clinical and Translational Science Institute, University at Buffalo, The State University of New York, Buffalo, NY, United States, 3Jacobs Multiple Sclerosis Center, Department of Neurology, Jacobs School of Medicine and Biomedical Sciences, University at Buffalo, The State University of New York, Buffalo, NY, United States
Synopsis
Keywords: Multiple Sclerosis, Quantitative Susceptibility mapping, Multiple sclerosis, QSM, thalamus, group differences, susceptibility, patients
Motivation: Contradicting evidence exists on thalamic iron alterations in multiple sclerosis, with most studies using susceptibility measurements reporting lower (susceptibility) iron but one study reporting higher.
Goal(s): To investigate if the study reporting higher thalamic susceptibility can be reproduced.
Approach: We matched demographics and clinical characteristics to the original study (higher susceptibility) and employed six QSM pipelines (two background field removal and three inversion algorithms).
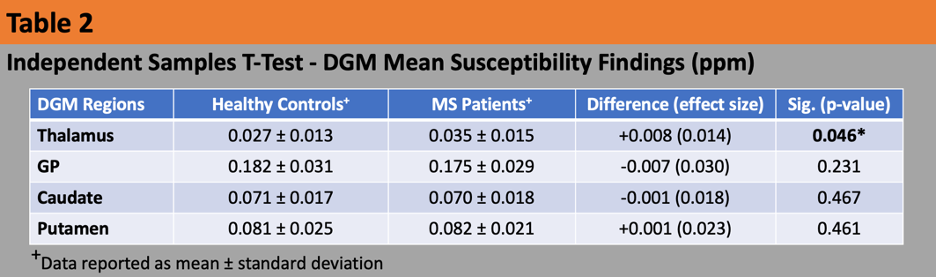
Results: Using the original study's pipeline, thalamic and putamen susceptibility was 8ppb (p=0.046) and 1ppb higher in patients, respectively. GP (-7 ppb) and caudate (-1 ppb) showed lower susceptibilities. Consistent group-differences with varying p-values were observed with each pipeline.
Impact: This study was able to attribute inconsistencies in observed thalamic (susceptibility) iron alterations to the clinical and demographic characteristics of the studied cohort and provided support for the notion that study outcomes are comparable between different QSM pipelines.
Introduction
Several studies have reported disturbed brain iron levels in people with multiple sclerosis (MS).1-3 Several of the most recent studies applied quantitative susceptibility mapping (QSM) as the most sensitive methods to assess brain iron alterations.4-8 The majority of these studies7,9,10 reported lower susceptibility in the thalamus of patients and higher susceptibility in the remaining deep gray matter (DGM). Only one cross-sectional study, performed by Rudko and colleagues at 7T,11 reported elevated susceptibility values in all DGM regions, inclusive of the thalamus.In the present study, we aimed to investigate if the findings by Rudko and colleagues could be reproduced at our site using a 3T MRI, a different pulse sequence, and a local subject cohort. We have consistently found decreased thalamic susceptibility in our local MS studies using QSM.5,7,8,10 Specifically, we investigated whether algorithmic choices of previous studies could explain differences in study outcomes.
Methods
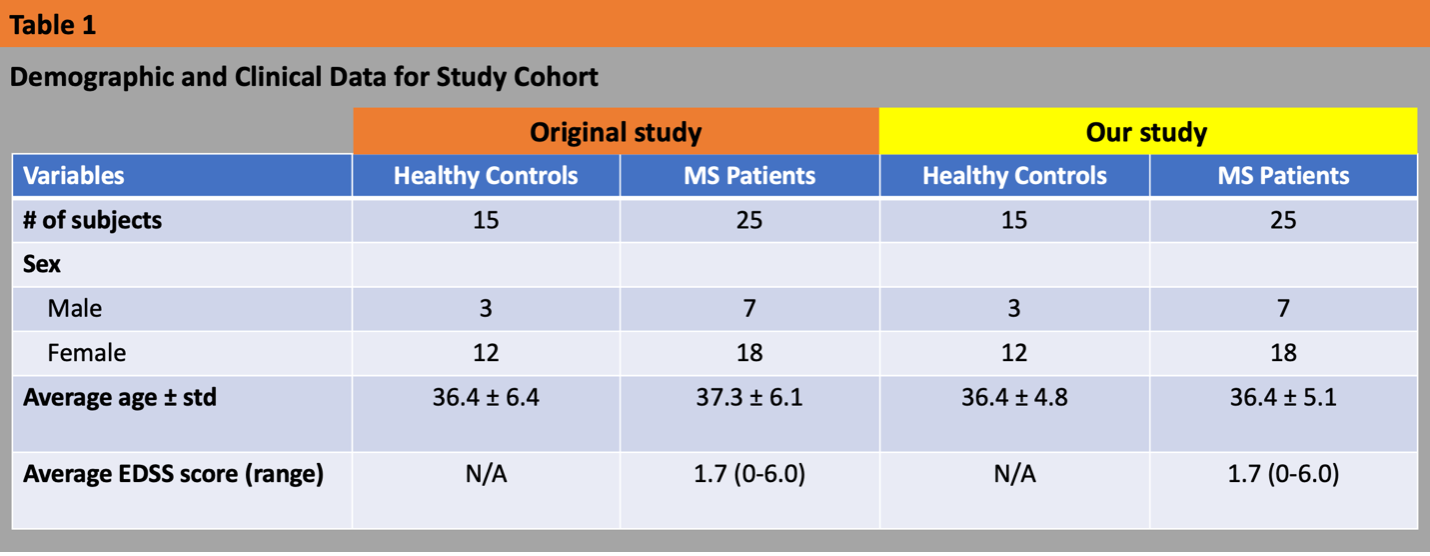
Subjects: Using existing data from IRB-approved studies database with consented participants, we assembled two cohorts that matched the clinical and demographic characteristics of the original study by Rudko., et al.11 (Table 1). Expanded Disability Status Scale (EDSS) was used by an MS neurologist to quantify clinical disability in MS patients.Scanning protocol: 3T MRI (GE Signa Excite HDx; multi-channel head-neck coil) using single-echo 3D GRE (0.5x0.5x2 mm3 resolution, 256x192x64 matrix, 256x192x128mm3, TE/TR=22ms/40ms, BW=13.9kHz, flip=12°) along with 3D T1-weighted images (IR-FSPGR, 1mm isotropic).
QSM reconstruction for replication: Magnetic susceptibility maps were reconstructed from raw k-space data using scalar-phase-matching13, gradient unwarping14, best-path unwrapping.15 Background field removal (BFR) and dipole inversion were performed using SHARP16 (7mm) and MEDI17 (λ=1000), respectively, in accordance with the original study.11
QSM reconstruction for comparative analysis: We applied HEIDI18 and TKD19 to the SHARP field maps. Additionally, we tested LBV20 as another BFR.
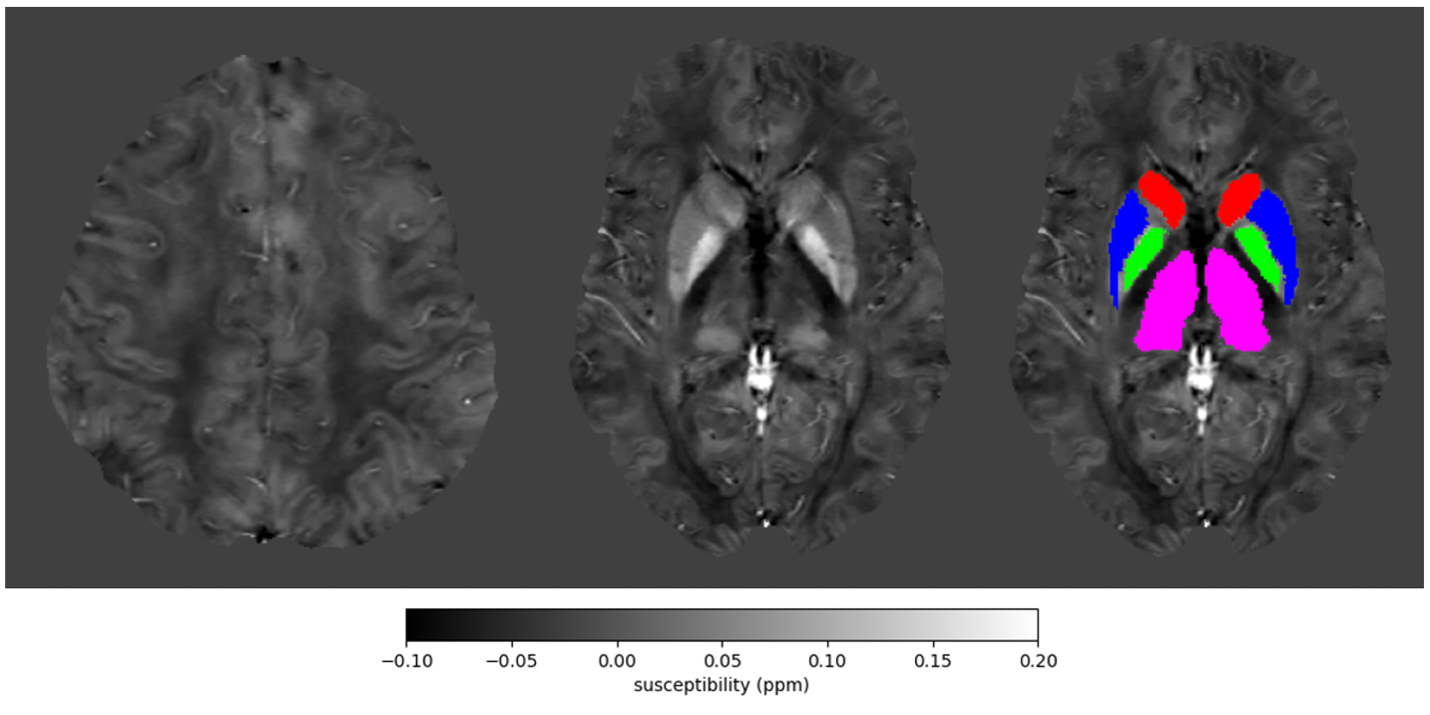
DGM analysis: We generated a study-specific bimodal QSM-T1w brain template.12 Subsequently, DGM and frontal deep white matter (FDWM) atlas labels were delineated and inverse-warped to subject’s QSM in native space (Fig. 1) using bimodal warp field computations (Python 3.0; ANTs). We calculated the average susceptibility values of each DGM label and referenced to the FDWM mean susceptibility, as per the original study.11
As for the secondary analysis, susceptibility findings were referenced to the whole brain due to its lower variation21,22 and consistent with previous studies showing lower thalamus susceptibility in patients.
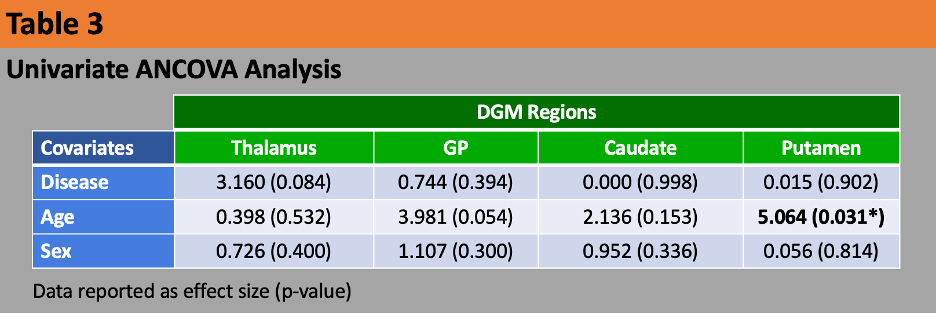
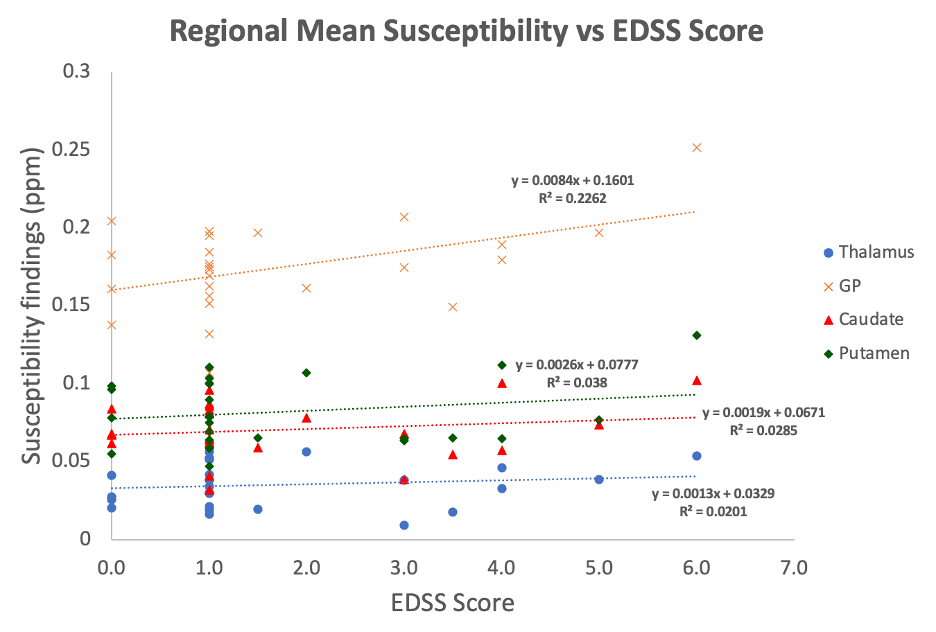
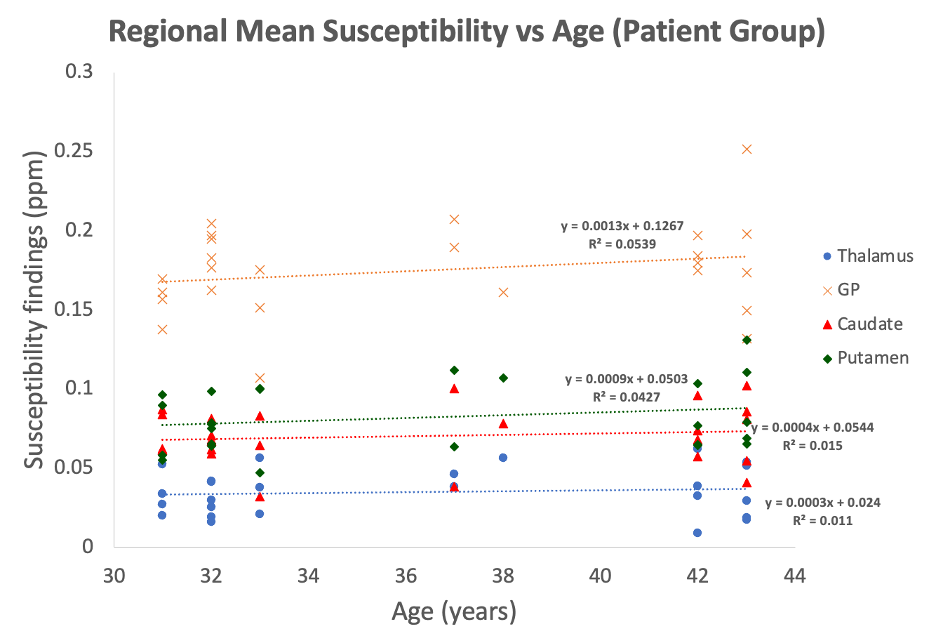
Statistical analysis: For each tested pipeline, we conducted normality checks, following which, group-differences [similar to original study] with effect sizes (cohen’s d) were studied using independent samples T-tests (Tab. 2), and univariate ANCOVA with sex and age as covariates (Tab. 3). Primary analysis focused on the thalamus, with secondary assessments of other subcortical regions. Susceptibility values were correlated with EDSS (Fig. 2) [similar to original study] and age (Fig. 3) in patients.
Results
Only the thalamus displayed significant group differences (Tab. 2), with an 8 ppb greater susceptibility in patients (p=0.046). Putamen exhibited 1 ppb greater susceptibility in patients, while the GP (-7 ppb) and caudate (-1 ppb) showed lower susceptibilities (all n.s.).Putamen susceptibility significantly correlated with age (Tab. 3; g=5.064, p=0.031). No other ANCOVA findings reached significance.
Fig. 2 and 3 illustrate positive correlations between mean susceptibility and EDSS scores, and age, respectively, for each region, although, none reached significance.
With all tested QSM pipelines, all DGM regions demonstrated group differences consistent with our above-mentioned findings from utilizing the original study pipeline (SHARP+MEDI).
Discussion
Our study successfully reproduced the increased thalamus susceptibility finding as reported by Rudko et al. Group differences were maintained even when BFR and dipole inversion algorithms used by Rudko et al. were replaced by other algorithms, implying that the inconsistency with other studies is indeed due to the demographic and clinical characteristics of the cohort and not due to specifics of the data acquisition or the processing pipeline used, as suggested by recent studies.22,24Although thalamic findings were replicated, our data did not reach significance in other DGM regions. A comparison of between subject variation in QSM values for individual regions of interest showed substantially higher variation in our data, which may be explained by the lower field strength, the lower number of GRE echoes, and a different DGM segmentation technique.
Overall, our confirmation of Rudko’s findings in a cohort with relatively young age and low EDSS, provides further support for the early-rise (in early stages of disease) late-decline (declines later) hypothesis5,12 of thalamic iron.
Conclusion
Replication of Rudko’s findings of increased thalamic susceptibility provide critical support for the robustness of study outcomes obtained with QSM as well as for the early-rise late-decline hypothesis of thalamic iron.Acknowledgements
We are grateful to Drs. David Rudko and Ravi Menon for their advice on the methodological details of their study. Research reported in this publication was supported by the National Institute of Neurological Disorders And Stroke of the National Institutes of Health under Award Number R01NS114227 and the National Center for Advancing Translational Sciences of the National Institutes of Health under Award Number UL1TR001412. The content is solely the responsibility of the authors and does not necessarily represent the official views of the National Institutes of Health.References
[1] Filippi, M., Bruck, W., Chard, D., Fazekas, F., Geurts, J. J. G., Enzinger, C., Lassmann, H. (2019). Association between pathological and MRI findings in multiple sclerosis. Lancet Neurology, 18, 198–210.
[2] Hagemeier, J., Geurts, J. J. G., & Zivadinov, R. (2012). Brain iron accumulation in aging and neurodegenerative disorders. Expert Review of Neurotherapeutics, 12, 1467–1480.
[3] Zecca, L., Youdim, M. B. H., Riederer, P., Connor, J. R., & Crichton, R. R. (2004). Iron, brain ageing and neurodegenerative disorders. Nature Reviews. Neuroscience, 5, 863–873.
[4] Burgetova, A., Dusek, P., Vaneckova, M., Horakova, D., Langkammer, C., Krasensky, J., Seidl, Z. (2017). Thalamic iron differentiates primary‐progressive and relapsing‐remitting multiple sclerosis. American Journal of Neuroradiology, 38, 1079–1086.
[5] Hagemeier, J., Zivadinov, R., Dwyer, M. G., Polak, P., Bergsland, N., Weinstock‐Guttman, B., Schweser, F. (2018). Changes of deep gray matter magnetic susceptibility over 2 years in multiple sclerosis and healthy control brain. NeuroImage: Clinical, 18, 1007–1016.
[6] Langkammer, C., Liu, T., Khalil, M., Enzinger, C., Jehna, M., Fuchs, S., Ropele, S. (2013). Quantitative susceptibility mapping in multiple sclerosis. Radiology, 267, 551–559.
[7] Schweser, F., Raffaini Duarte Martins, A. L., Hagemeier, J., Lin, F., Hanspach, J., Weinstock‐Guttman, B., Zivadinov, R. (2018). Mapping of thalamic magnetic susceptibility in multiple sclerosis indicates decreasing iron with disease duration: A proposed mechanistic relationship between inflammation and oligodendrocyte vitality. NeuroImage, 167, 438–452.
[8] Zivadinov, R., Tavazzi, E., Bergsland, N., Hagemeier, J., Lin, F., Dwyer, M. G., Schweser, F. (2018). Brain iron at quantitative MRI is associated with disability in multiple sclerosis. Radiology, 289, 487–496.
[9] Khalil, M., Langkammer, C., Pichler, A., Pinter, D., Gattringer, T., Bachmaier, G., Fazekas, F. (2015). Dynamics of brain iron levels in multiple sclerosis: A longitudinal 3T MRI study. Neurology, 84, 2396–2402.
[10] Schweser F, Hagemeier J, Dwyer MG, Bergsland N, Hametner S, Weinstock-Guttman B, Zivadinov R. Decreasing brain iron in multiple sclerosis: The difference between concentration and content in iron MRI. Hum Brain Mapp. 2021 Apr 1;42(5):1463-1474. doi: 10.1002/hbm.25306. Epub 2020 Dec 30. PMID: 33378095; PMCID: PMC7927296.
[11] Rudko DA, Solovey I, Gati JS, Kremenchutzky M, Menon RS. Multiple sclerosis: improved identification of disease-relevant changes in gray and white matter by using susceptibility-based MR imaging. Radiology. 2014 Sep;272(3):851-64. doi: 10.1148/radiol.14132475. Epub 2014 May 14. PMID: 24828000.
[12] Al-Radaideh AM, Wharton SJ, Lim SY, Tench CR, Morgan PS, Bowtell RW, Constantinescu CS, Gowland PA. Increased iron accumulation occurs in the earliest stages of demyelinating disease: an ultra-high field susceptibility mapping study in Clinically Isolated Syndrome. Mult Scler. 2013 Jun;19(7):896-903. doi: 10.1177/1352458512465135. Epub 2012 Nov 8. PMID: 23139386.
[13] Robinson SD, Bredies K, Khabipova D, Dymerska B, Marques JP, Schweser F. An illustrated comparison of processing methods for MR phase imaging and QSM: combining array coil signals and phase unwrapping. NMR Biomed. 2017 Apr;30(4):e3601. doi: 10.1002/nbm.3601. Epub 2016 Sep 13. PMID: 27619999; PMCID: PMC5348291.
[14] Polak, P., Zivadinov, R., Ferdinand Schweser, F. Gradient Unwarping for Phase Imaging Reconstruction. DOI:10.13140/2.1.1857.7603. ISMRM 2014
[15] Hussein S. Abdul-Rahman, Munther A. Gdeisat, David R. Burton, Michael J. Lalor, Francis Lilley, and Christopher J. Moore, "Fast and robust three-dimensional best path phase unwrapping algorithm," Appl. Opt. 46, 6623-6635 (2007)
[16] Schweser F, Deistung A, Lehr BW, Reichenbach JR. Quantitative imaging of intrinsic magnetic tissue properties using MRI signal phase: an approach to in vivo brain iron metabolism? Neuroimage. 2011 Feb 14;54(4):2789-807. doi: 10.1016/j.neuroimage.2010.10.070. Epub 2010 Oct 30. PMID: 21040794.
[17] Liu T, Xu W, Spincemaille P, Avestimehr AS, Wang Y. Accuracy of the morphology enabled dipole inversion (MEDI) algorithm for quantitative susceptibility mapping in MRI. IEEE Trans Med Imaging. 2012 Mar;31(3):816-24. doi: 10.1109/TMI.2011.2182523. Epub 2012 Jan 4. PMID: 22231170; PMCID: PMC3613569.
[18] Schweser F, Sommer K, Deistung A, Reichenbach JR. Quantitative susceptibility mapping for investigating subtle susceptibility variations in the human brain. Neuroimage. 2012 Sep;62(3):2083-100. doi: 10.1016/j.neuroimage.2012.05.067. Epub 2012 Jun 1. PMID: 22659482.
[19] Wharton, S., Schäfer, A., Bowtell, R., 2010. Susceptibility mapping in the human brain using threshold-based k-space division. Magnetic resonance in medicine 63, 1292–1304.
[20] Zhou D, Liu T, Spincemaille P, Wang Y. Background field removal by solving the Laplacian boundary value problem. NMR Biomed. 2014 Mar;27(3):312-9. doi: 10.1002/nbm.3064. Epub 2014 Jan 7. PMID: 24395595.
[21] QSM Challenge 2.0 Organization Committee; Bilgic B, Langkammer C, Marques JP, Meineke J, Milovic C, Schweser F. QSM reconstruction challenge 2.0: Design and report of results. Magn Reson Med. 2021 Sep;86(3):1241-1255. doi: 10.1002/mrm.28754. Epub 2021 Mar 30. PMID: 33783037.
[22] Salman, F. Ramesh, A., Prayer, M., Adegbemigun, A., Jochmann, T., Bergsland, N., Dwyer, M. G., Jakimovski, D., Zivadinov, R., Schweser, F. Decoding Deep Gray Matter Susceptibility: Variance from the reference region, not dipole inversion artifacts, dominates reproducibility. ISMRM 2024.
[23] Patenaude, B., Smith, S.M., Kennedy, D., and Jenkinson M. A Bayesian Model of Shape and Appearance for Subcortical Brain NeuroImage, 56(3):907-922, 2011.
[24] Salman, F. Ramesh, A., Jochmann, T., Prayer, M., Bergsland, N., Dwyer, M. G., Jakimovski, D., Zivadinov, R., Schweser, F. Decoding Sensitivity of Quantitative Susceptibility Mapping: Influence of Background Field Removal and Inversion Algorithms. ISMRM 2024
Figures