2937
Quantitative T2* Ferumoxytol MRI to Evaluate Activated Innate Immunity in Progressive Multiple Sclerosis1UCAIR, Department of Radiology and Imaging Sciences, University of Utah, Salt Lake City, UT, United States, 2Department of Neurology, University of Utah, Salt Lake City, UT, United States
Synopsis
Keywords: Multiple Sclerosis, Contrast Agent, USPIO
Motivation: Multiple sclerosis (MS) progression involves inflammation, microglia, and macrophage activation, contributing to axonal damage.
Goal(s): This study investigates the utility of ferumoxytol-enhanced MRI for evaluating activated microglia and macrophages in progressive MS.
Approach: . Nine secondary progressive MS patients underwent baseline and post-ferumoxytol 3T MRI scans, with T2* and ΔT2* maps computed to quantify ferumoxytol retention in lesions.
Results: We successfully quantified ferumoxytol levels in ΔT2*-enhanced MS lesions in four subjects. In relapsing MS, newly formed active lesions typically contain a substantial number of macrophages, while chronic-active lesions in progressive MS predominantly exhibit microglia and macrophages in the perilesional area
Impact: These findings suggest ferumoxytol-enhanced MRI's potential for assessing microglia and macrophage activity in progressive MS, aiding accurate diagnoses and treatment. Clinicians could gain a valuable tool for monitoring disease progression, improving patient management and outcomes.
PURPOSE
Multiple sclerosis (MS) is a central nervous system (CNS) disorder characterized by inflammation, demyelination, and axonal loss(1). Conventional MRI typically reveals multifocal white matter lesions but lacks the ability to specifically indicate the progression of MS(2). Ongoing inflammation, often attributed to activated microglia and macrophages, is thought to contribute to axonal loss(3). While Gd-DTPA is used to detect BBB leakage associated with inflammation, it does not directly visualize the inflammation itself(4). MS involves periods of relapses and progression, with axonal loss being a critical component of the progressive phase. Recent studies explore the potential of ultrasmall superparamagnetic iron oxide (USPIO) particles, such as ferumoxytol, as an MRI biomarker for assessing activated microglia and macrophages in progressive MS(5). This offers a more precise indicator of ongoing axonal and neuronal damage. While previous studies focused on patients with active relapsing-remitting (RR) MS, the use of USPIO in the progressive forms of MS has yet to be investigated(6). This research aims to explore ferumoxytol uptake(7) by using quantitative MRI to evaluate activated microglia and macrophages in progressive MS, providing a more accurate reflection of the ongoing loss of central nervous system axons and neurons.METHODS
This study was approved by the institutional review board and signed consent was obtained. In all participants, MRI scans of the brain were performed before and 96 h after ferumoxytol (Feraheme, Covis Pharma, Waltham, Massachusetts, USA) infusion. Participant criteria included nine adults aged 35 to 65 years who met the McDonald Criteria for progressive MS and were able to walk at least 20 meters without rest. MRI scans were performed using a 3T MRI scanner with 20-channel head coils. Each participant underwent two separate scans: one before (baseline) and another 96 hours following the administration of ferumoxytol (delayed). Following the baseline scan, participants received a 4 mg/kg dose of ferumoxytol via 30-minute infusion and were then observed for 30 minutes to monitor for any potential infusion reaction. Participants returned for their delayed MRI as outlined in the study protocol described in Table 1. Imaging Analysis: Two sets of 3D multi-echo (ME) GRE images, acquired from two separate MRI scans, were initially co-registered before computing T2* maps. The co-registered T2* maps were calculated using non-linear fitting of TE (echo time) and the corresponding contrast images(8). ΔT2* maps were derived by subtracting the baseline and delayed T2* maps, respectively. These T2* and ΔT2* maps were generated using Python scripts and the ANTs registration tool(9). Lesions with retained ferumoxytol were identified in the ΔT2* maps and saved using ITK-SNAP software(10). The ΔT2* derived regions of interest (ROIs) were subsequently co-registered with their corresponding T2* maps and 3D T2 FLAIR images. The retained ferumoxytol contrast was estimated from fitting of ΔT2* and C using the Eq(1) 1/ΔT2* = 1/T2o* + r2*•C(11).RESULTS
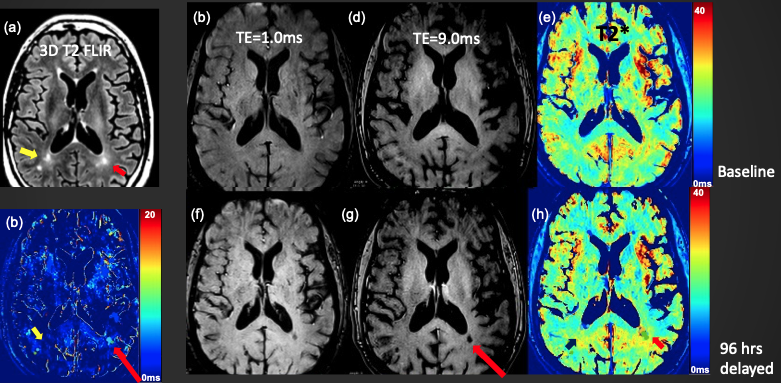
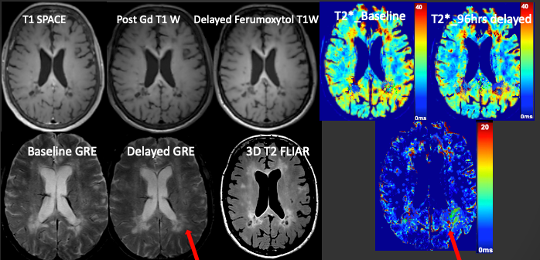
Figure 1 shows ferumoxytol retention in progressive MS brain of a 61-year-old male subject with clinically worsening progressive MS over the preceding 2 years. 3D T2 FLAIR images show the multifocal MS lesions. Comparing short TE to long TE images, we observed the T2* enhanced MS lesion at the long TE image at post-ferumoxytol (red arrow in (g)). The measurement of T2* on the same MS lesion was decreased from 28ms to 18ms (h), while no T2* changes on the MS lesion indicated by the yellow arrow on DT2* map (b). Using Eq(1), the concentration of ferumoxytol retained was measured as 0.364mM. Figure 2 shows ferumoxytol retention in a 59-yesr-old female with SPMS. 3D FLAIR images depict multifocal MS lesions. No Gd-T1 enhancement areas were observed. However, ferumoxytol enhancement was evident in the delayed GRE image. A retention concentration of 0.564mM was determined from DT2*. Table 1 provides a summary of the results from the nine patient ferumoxytol MRI study.DISCUSSION
These preliminary findings highlight the variability in ΔT2* values observed among progressive MS lesions, potentially indicating ferumoxytol retention within acctivated microglia and macrophages. We successfully quantified ferumoxytol levels in ΔT2*-enhanced MS lesions in four subjects. In relapsing MS, newly formed active lesions typically contain a substantial number of macrophages, while chronic-active lesions in progressive MS predominantly exhibit microglia and macrophages in the perilesional area(12). Notably, we did not observe any post-contrast enhancement in any of the subjects. In our future research, we aim to broaden our subject pool to include a larger number of individuals with progressive MS and compare these findings with those from subjects with chronic MS who exhibit stable neurological function.CONCLUSION
Ferumoxytol MRI shows potential for improved monitoring of disease progression in progressive MS lesions.Acknowledgements
Supported by Utah CTSI pilot award (NCATS UL1TR002538), with ferumoxytol provided by Covis Pharma US.References
1. Noseworthy JH, Lucchinetti C, Rodriguez M, Weinshenker BG: Multiple sclerosis. N Engl J Med 2000; 343:938–52.
2. Bakshi R, Hutton GJ, Miller JR, Radue EW: The use of magnetic resonance imaging in the diagnosis and long-term management of multiple sclerosis. Neurology 2004; 63:S3–S11.
3. Correale J, Gaitán MI, Ysrraelit MC, Fiol MP: Progressive multiple sclerosis: from pathogenic mechanisms to treatment. Brain 2017; 140:527–546.
4. Thorpe JW, Kidd D, Moseley IF, et al.: Serial gadolinium-enhanced MRI of the brain and spinal cord in early relapsing-remitting multiple sclerosis. Neurology 1996; 46:373–378.
5. Kirschbaum K, Sonner JK, Zeller MW, et al.: In vivo nanoparticle imaging of innate immune cells can serve as a marker of disease severity in a model of multiple sclerosis.
6. Dousset KV, Brochet B, Deloire MSA, Lagoarde L, Barroso B, Caille J-M, Petry KG: MR Imaging of Relapsing Multiple Sclerosis Patients Using Ultra-Small-Particle Iron Oxide and Compared with Gadolinium. Am J Neuroradiol 2006; 27:1000.
7. Vellinga MM, Oude Engberink RD, Seewann A, et al.: Pluriformity of inflammation in multiple sclerosis shown by ultra-small iron oxide particle enhancement. Brain 2008; 131.
8. O’Connor JPB, Robinson SP, Waterton JC: Imaging tumour hypoxia with oxygen-enhanced MRI and BOLD MRI. British Journal of Radiology 2019.
9. Avants BB, Tustison N, Johnson H: Advanced Normalization Tools (ANTS) Release 2.x. 2014.
10. ITK-SNAP Home [http://www.itksnap.org/pmwiki/pmwiki.php]
11. Knobloch G, Colgan T, Wiens CN, et al.: Relaxivity of Ferumoxytol at 1.5 T and 3.0 T. Invest Radiol 2018; 53:257–263.
12. Kamma E, Lasisi W, Libner C, Ng HS, Plemel JR: Central nervous system macrophages in progressive multiple sclerosis: relationship to neurodegeneration and therapeutics. J Neuroinflammation 2022.
Figures