2936
Towards precise quantification of chronic active MS lesions using submillimeter isotropic QSM with 3D-EPI at 3T1Department of Neurology, Cedars-Sinai Medical Center, Los Angeles, CA, United States, 2Biomedical Imaging Research Institute, Cedars-Sinai Medical Center, Los Angeles, CA, United States, 3Siemens Healthcare Pty Ltd, Brisbane, Australia, 4Siemens Medical Solutions, Los Angeles, CA, United States, 5Department of Imaging, Cedars-Sinai Medical Center, Los Angeles, CA, United States
Synopsis
Keywords: Multiple Sclerosis, Multiple Sclerosis
Motivation: Quantitative susceptibility mapping (QSM) enables in vivo detection of chronic active brain lesions in Multiple Sclerosis (MS) due the presence of iron-laden lesion borders also called Paramagnetic Rim Lesions (PRL).
Goal(s): To evaluate the feasibility of generating submillimeter isotropic resolution QSM using 3D-EPI for precise quantification of PRL in MS patients.
Approach: Separate masks for the lesion rim and lesion core were generated.
Results: Submillimeter resolution reduces the partial volume averaging effect and enables measurement of the lesion rim in PRL+ lesions, which exhibit susceptibility values 3 times that of the lesion core.
Impact: This study demonstrates the feasibility of submillimeter isotropic quantitative susceptibility mapping to precisely quantify the magnetic susceptibility properties of MS lesions.
Introduction
A prominent pathological feature of chronic active brain lesions in Multiple Sclerosis (MS) is the presence of iron-laden microglia/macrophages at the lesion borders.1-3 Quantitative susceptibility mapping (QSM) enables in vivo detection of these chronic active lesions with an iron rim, also called Paramagnetic Rim Lesions (PRL).4-6 However, standard Gradient-Recalled-Echo (GRE) conventionally used for QSM data acquisitions are limited to anisotropic voxel dimensions and millimeter scale slice thickness (~2-4 mm) to achieve clinically feasible scan times. As a result, partial volume averaging is affecting the magnetic susceptibility measurements done on PRL. More specifically, separating the magnetic susceptibility contributions due to iron accumulation in the lesion rim from the myelin loss in lesion core is particularly challenging and may prevent an accurate monitoring of PRL. 7, 8 To address this issue, we propose the use of a 3-dimensional multi-shot echo-planar-imaging (3D-EPI) sequence which enables whole brain imaging at submillimeter isotropic resolution in a few minutes.9 The purpose of this study is to demonstrate the feasibility of performing submillimeter isotropic resolution QSM using 3D-EPI for improving the quantification of PRL in MS patients.Methods
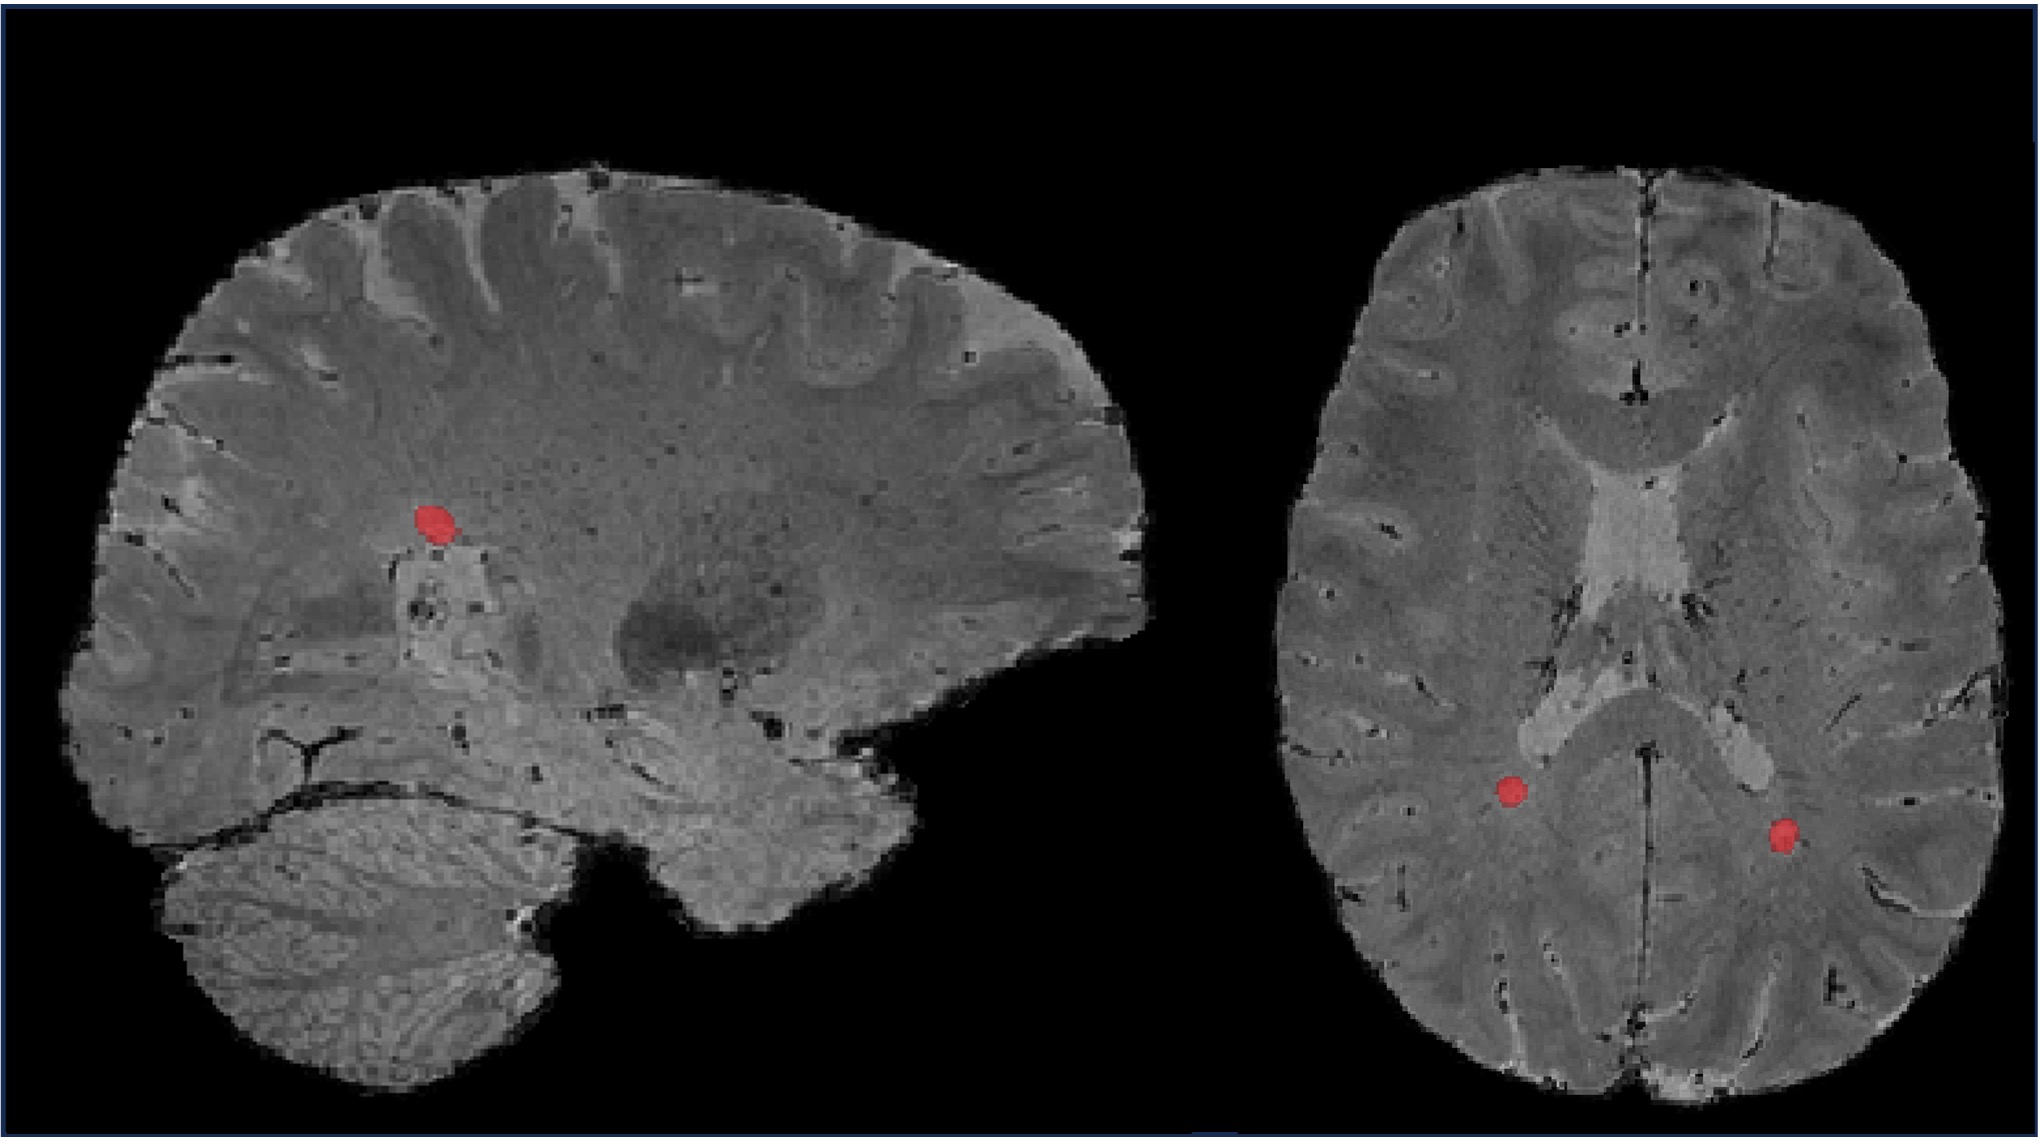
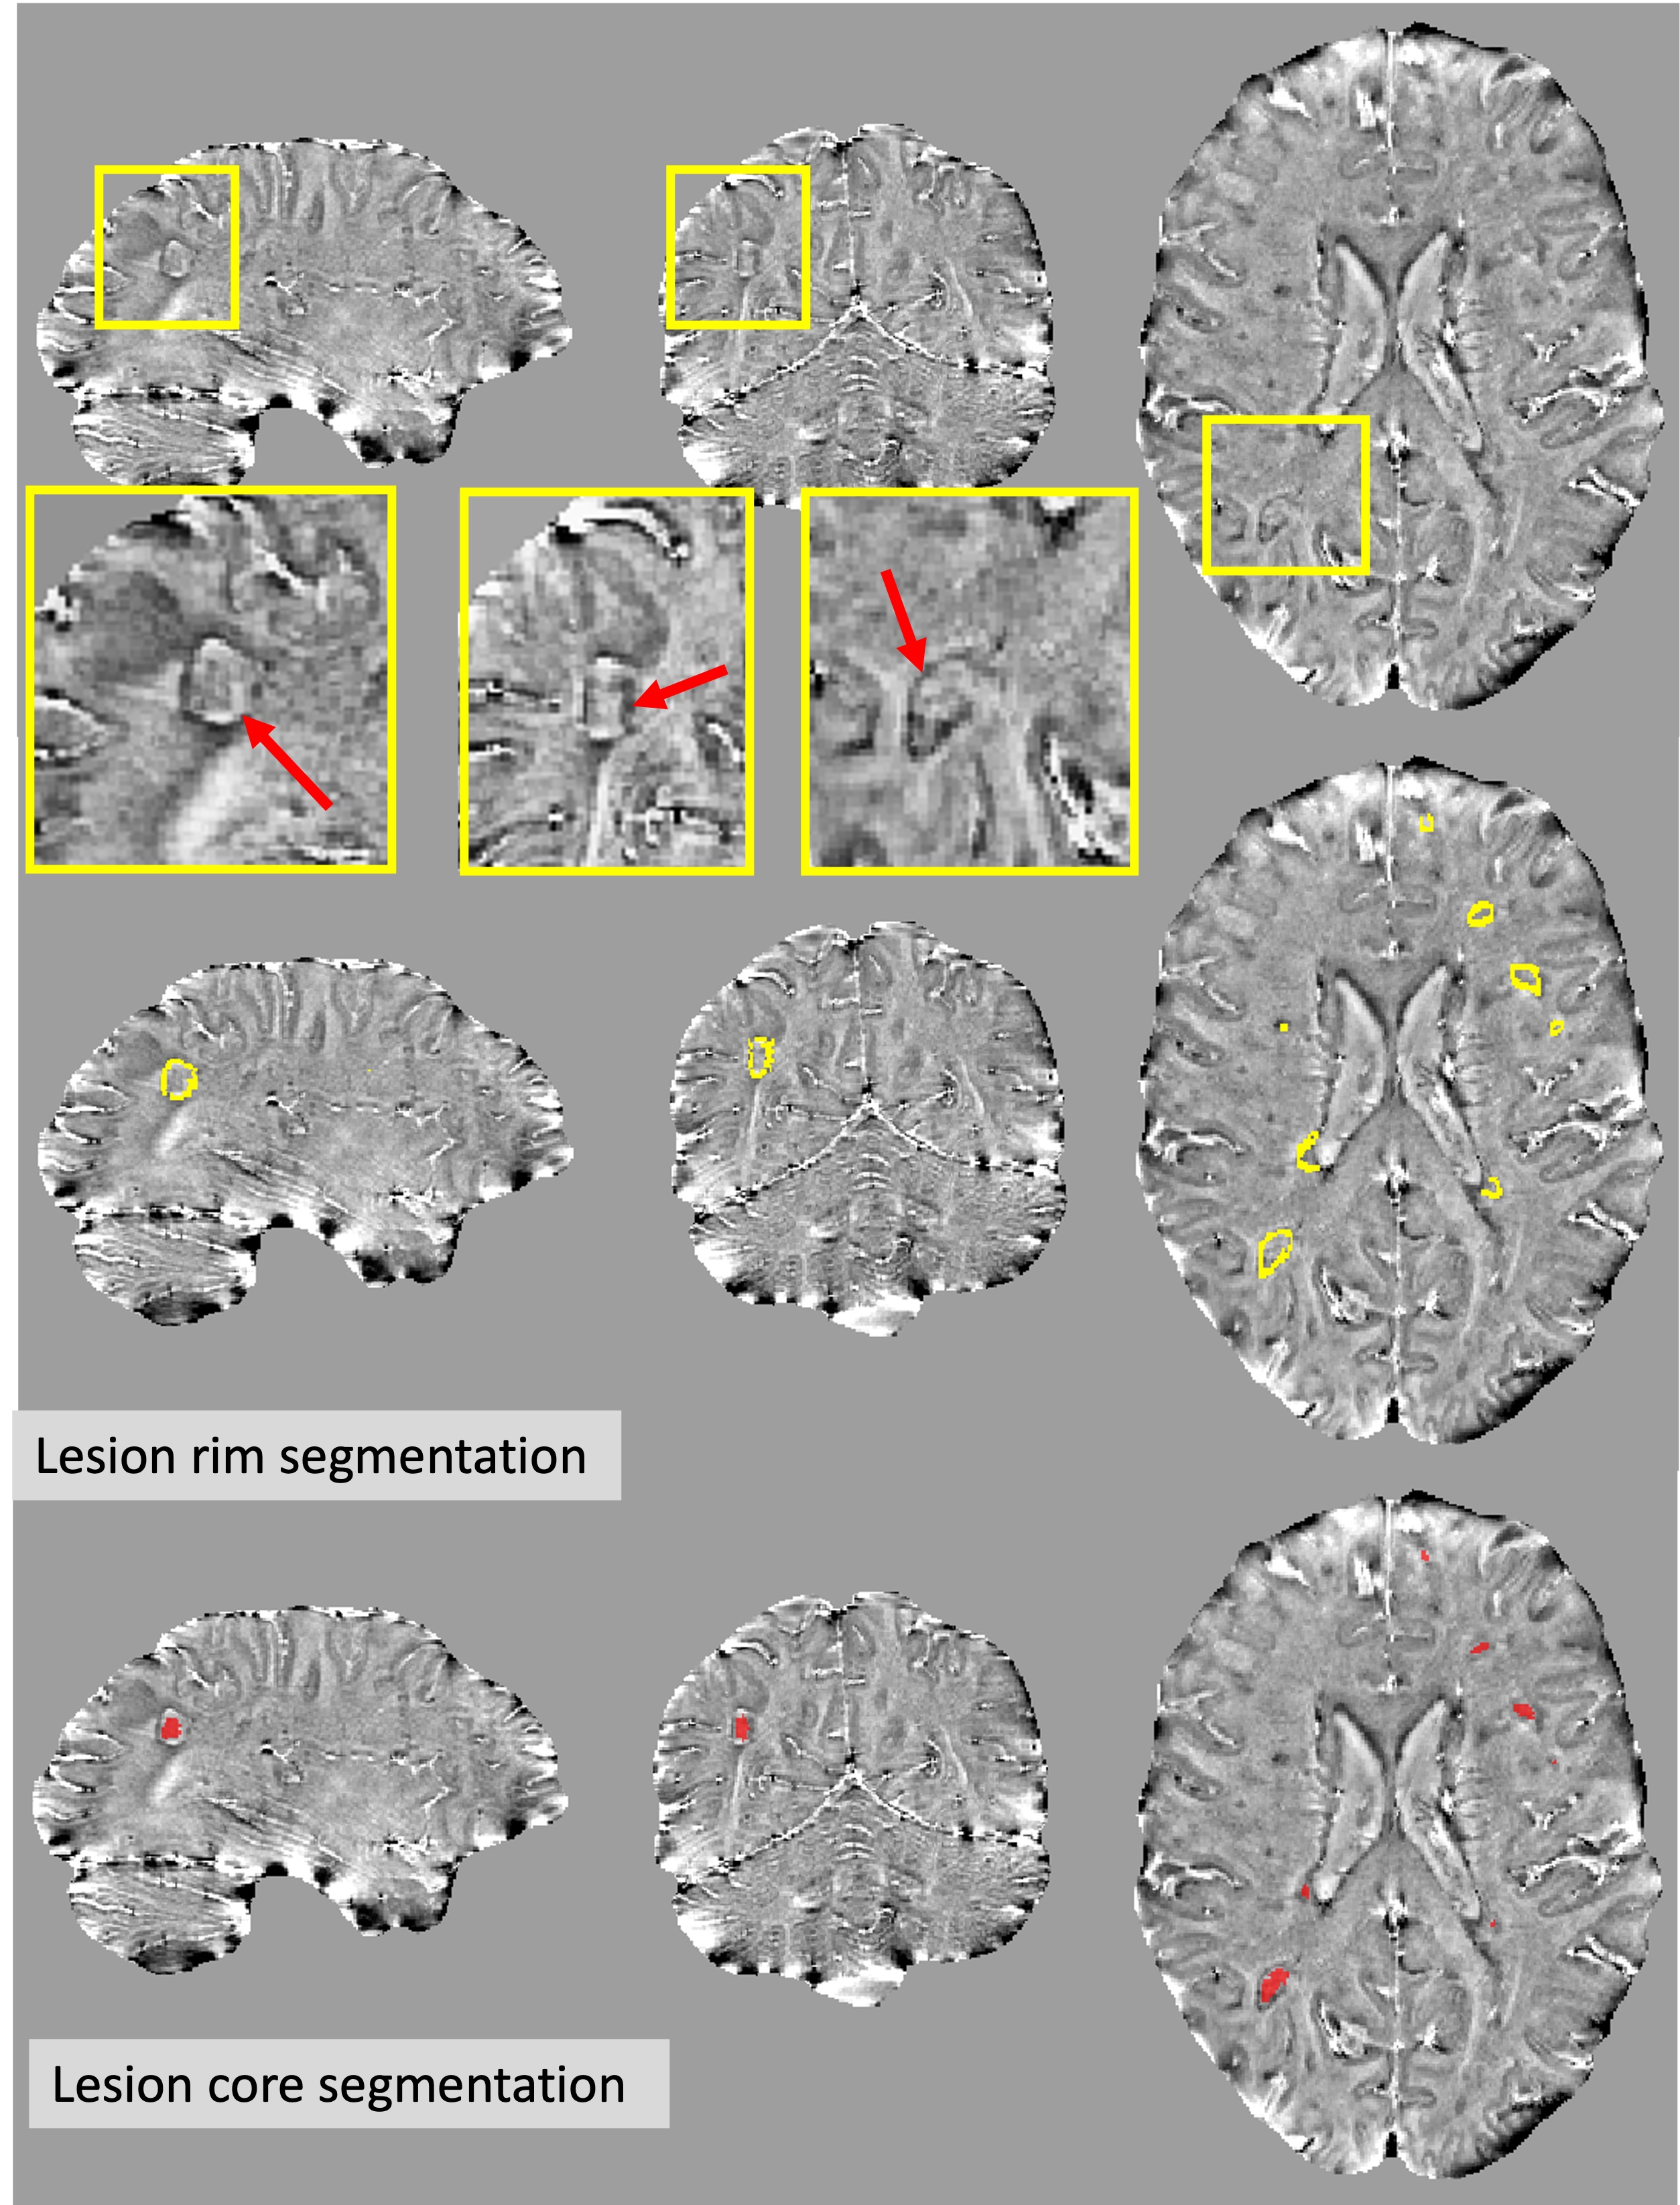
Twenty MS patients were scanned at Cedars-Sinai Medical Center using a 3T MRI scanner (MAGNETOM-Skyra, Siemens Healthcare, Erlangen, Germany) with a 20‐channel receiver head coil under an IRB-approved protocol (MS-ReBS). Data were acquired using a research 3D-EPI sequence on the entire brain using the following parameters: 650 μm isotropic resolution, TE/TR=35/64 ms, flip angle=15° and EPI-factor=15, with a scan time=5:51 minutes. QSM reconstruction was subsequently performed using the Total Generalized Variation (TGV) based algorithm.5 To normalize the susceptibility measures, the average susceptibility value of the ventricular cerebrospinal fluid was subtracted from the reconstructed QSM maps. Additionally, T1-MPRAGE, and T2-FLAIR images (1mm isotropic) were rigidly aligned to the subjects’ 3D-EPI images using ANts tool box.10 Tissue segmentation (white matter, deep grey nuclei) was performed on the registered T1-MPRAGE images using Freesurfer.11 Automated lesion segmentation was performed on registered T2-FLAIR and registered T1-MPRAGE using MIMoSA12 (Figure-1). Binary masks for PRL positive (PRL+) lesions (n=35) were drawn manually on the Laplacian filtered 3D-EPI phase images, and separate masks for the lesion rim and lesion core were generated (Figure-2). Finally, the PRL negative lesion (PRL-) masks were generated by subtracting the PRL+ lesion mask from the automated MIMoSA lesion mask.Results
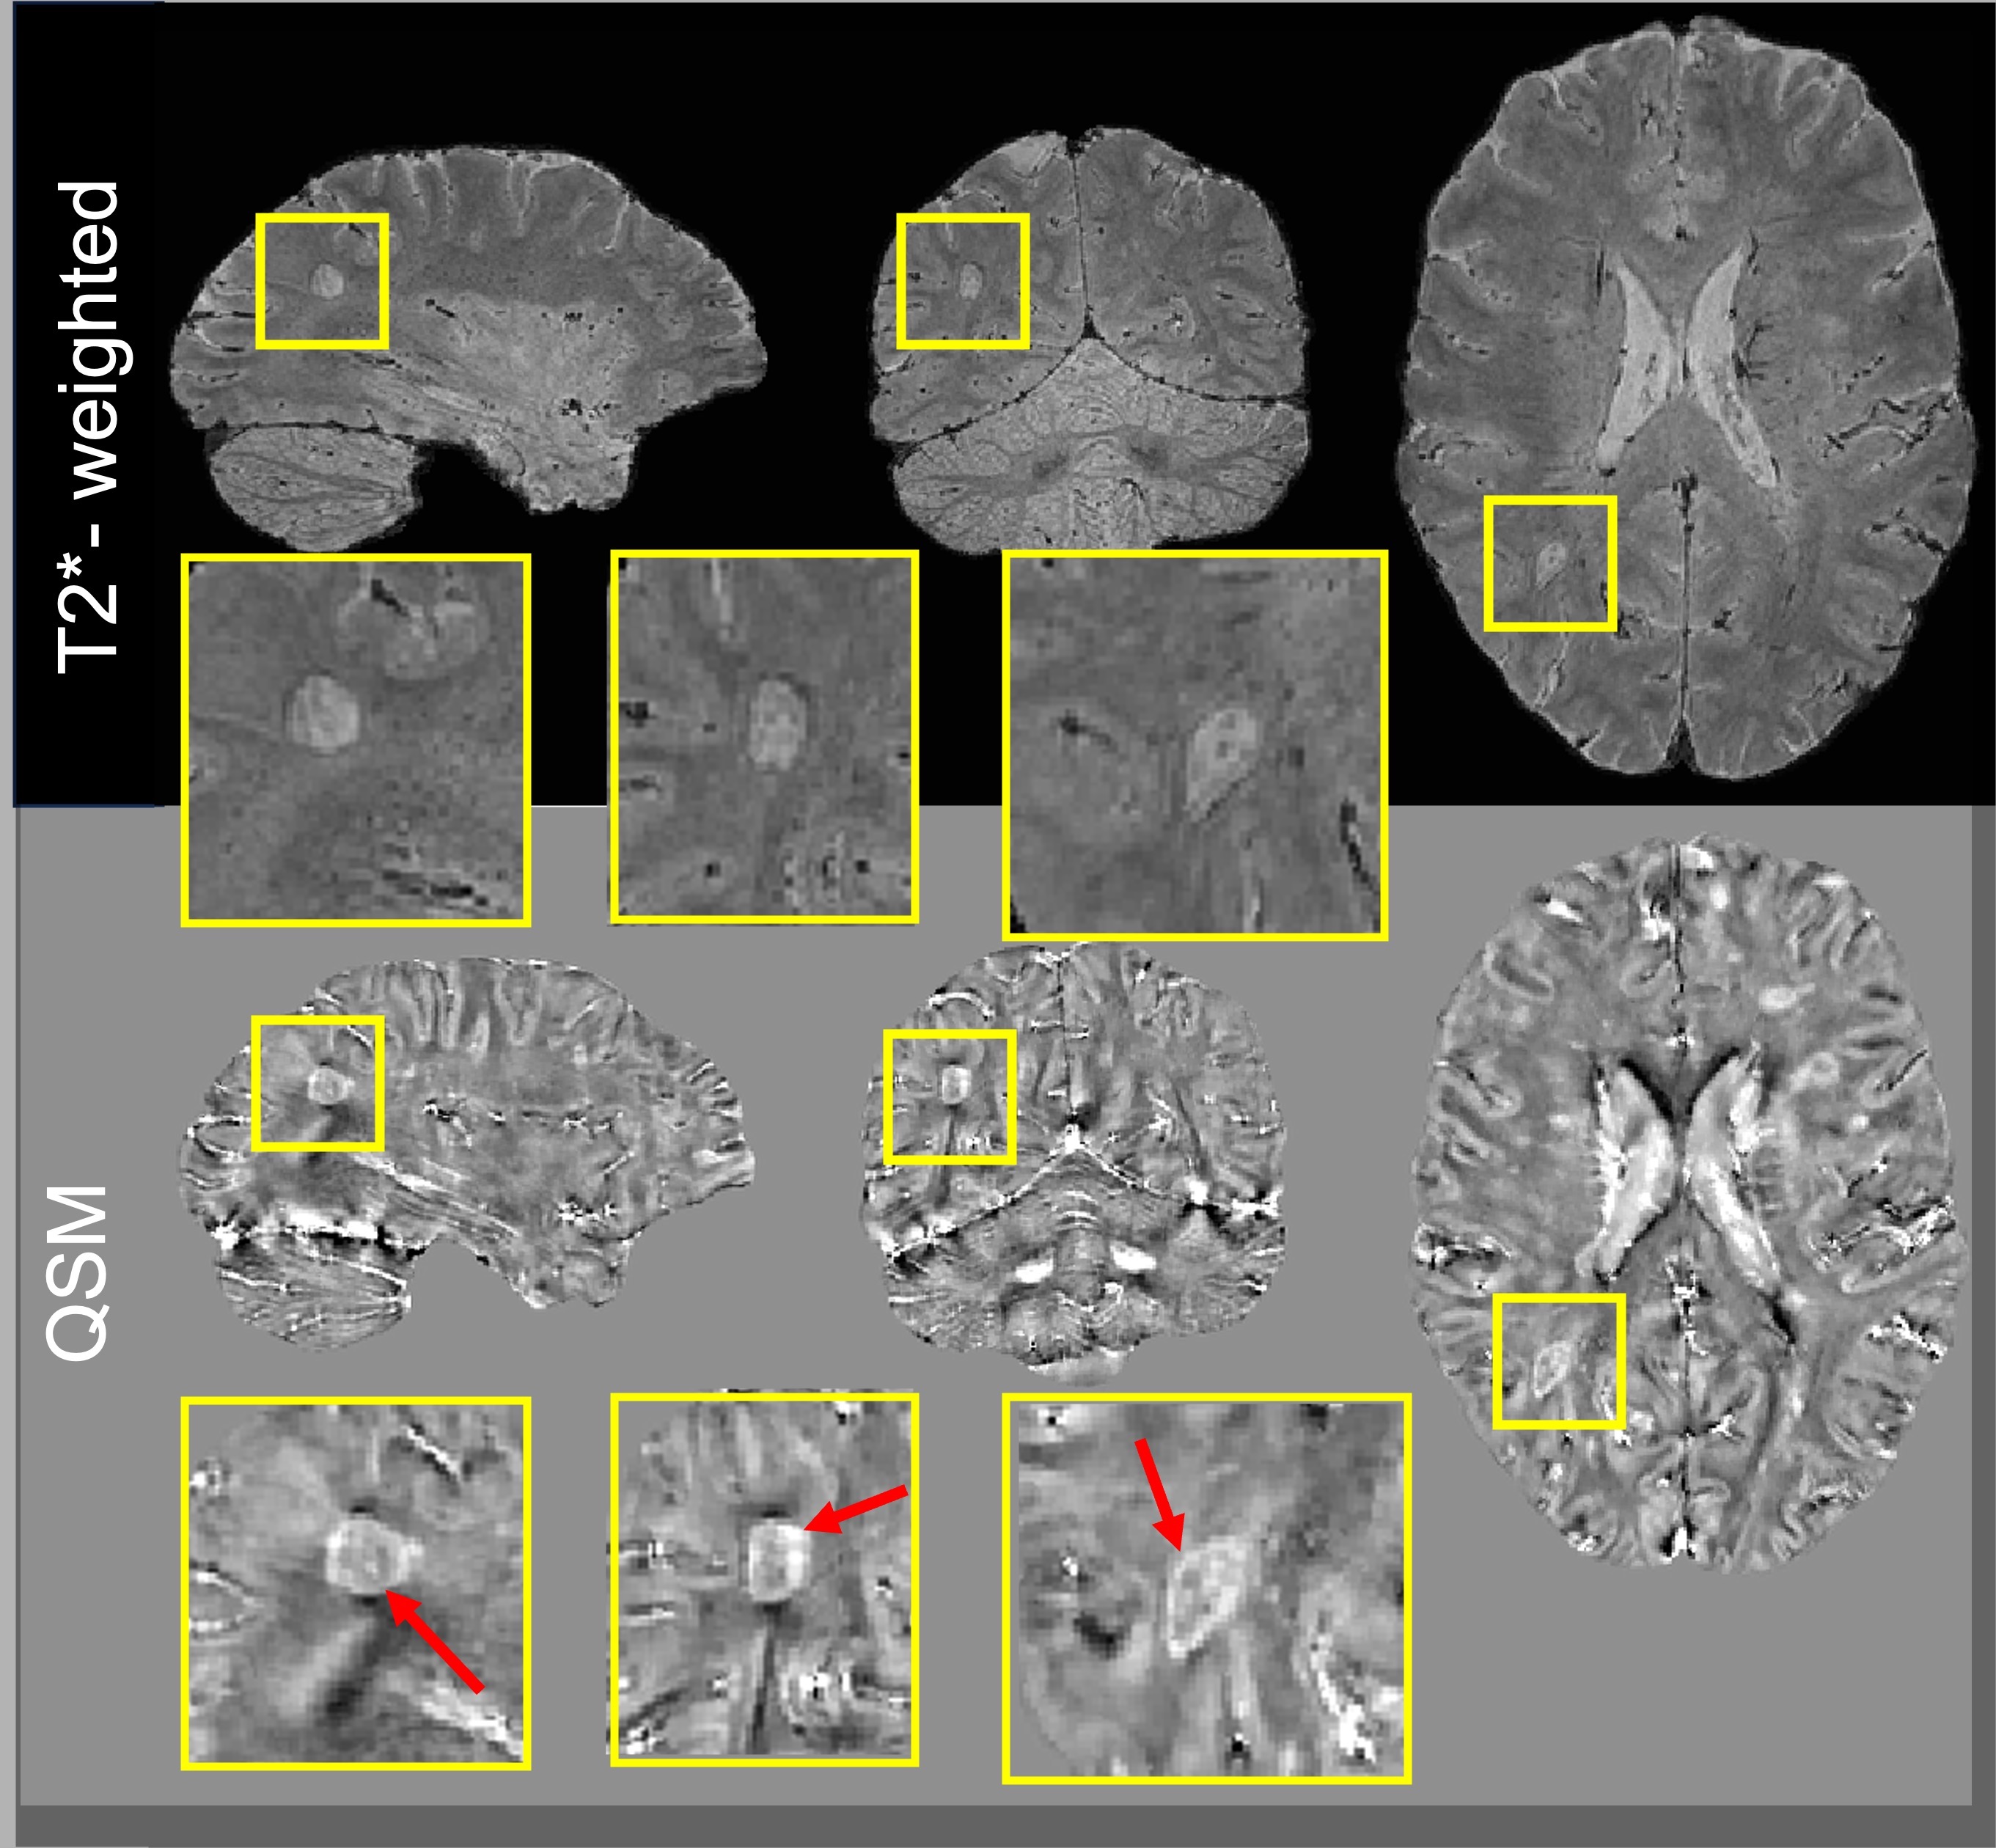
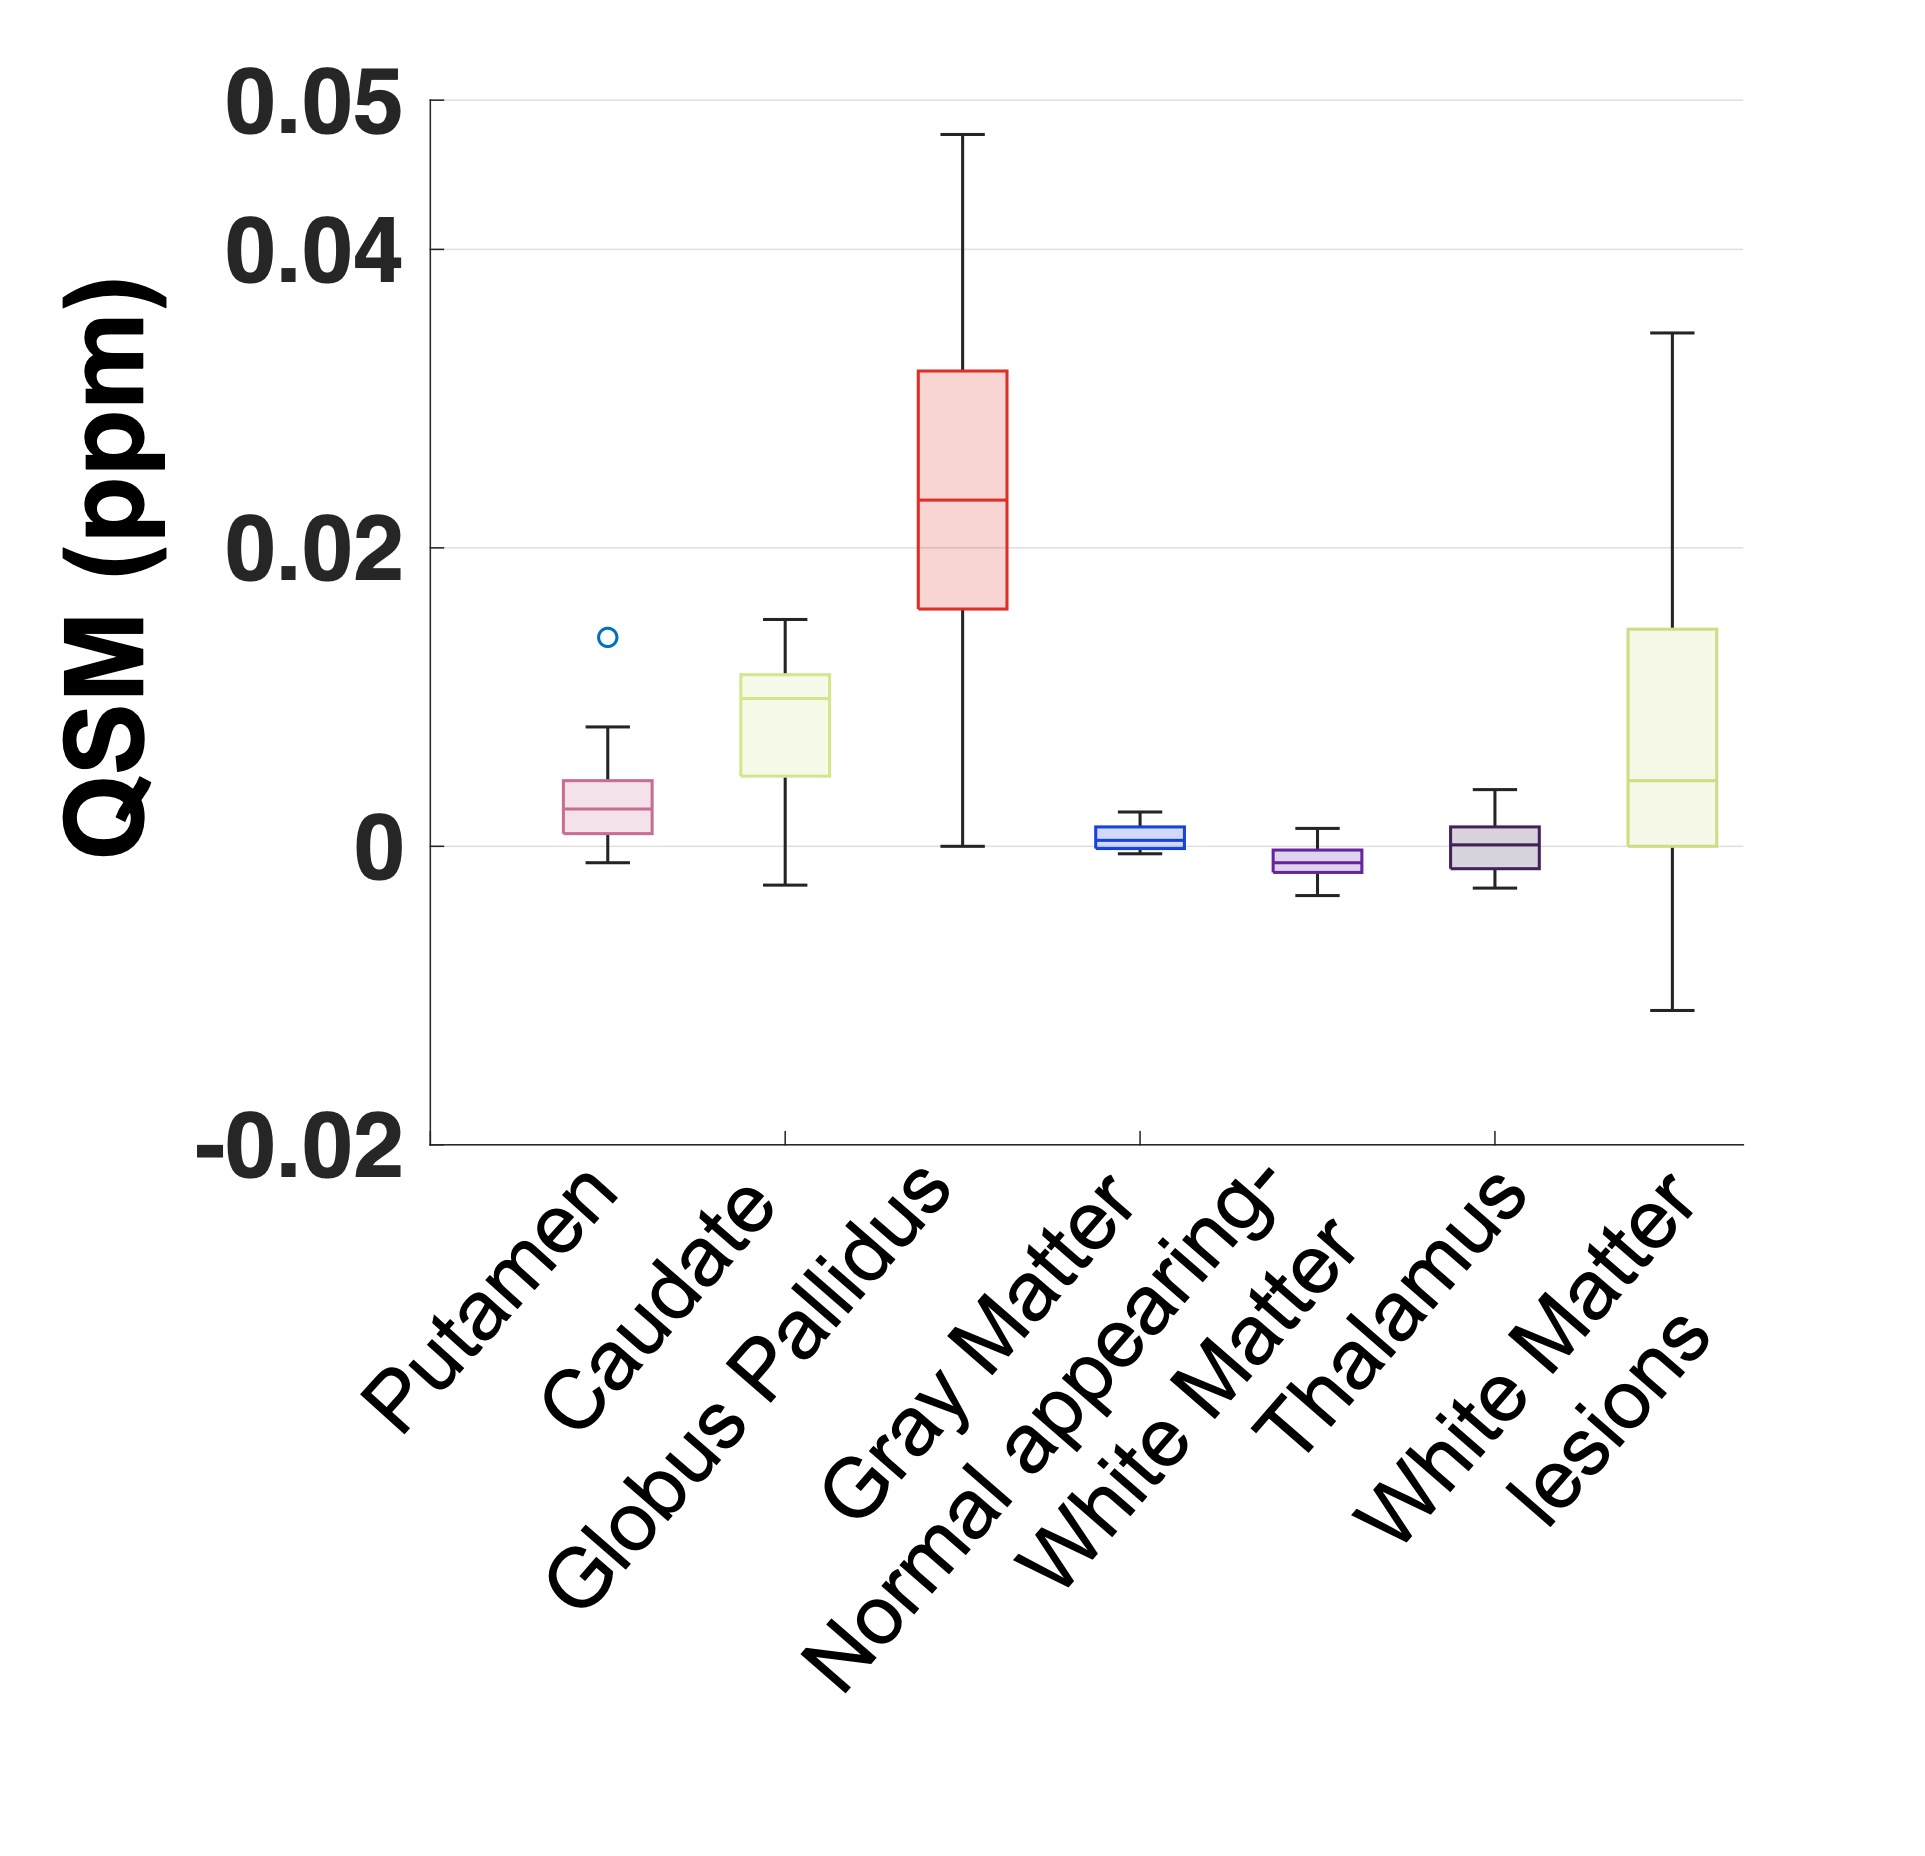
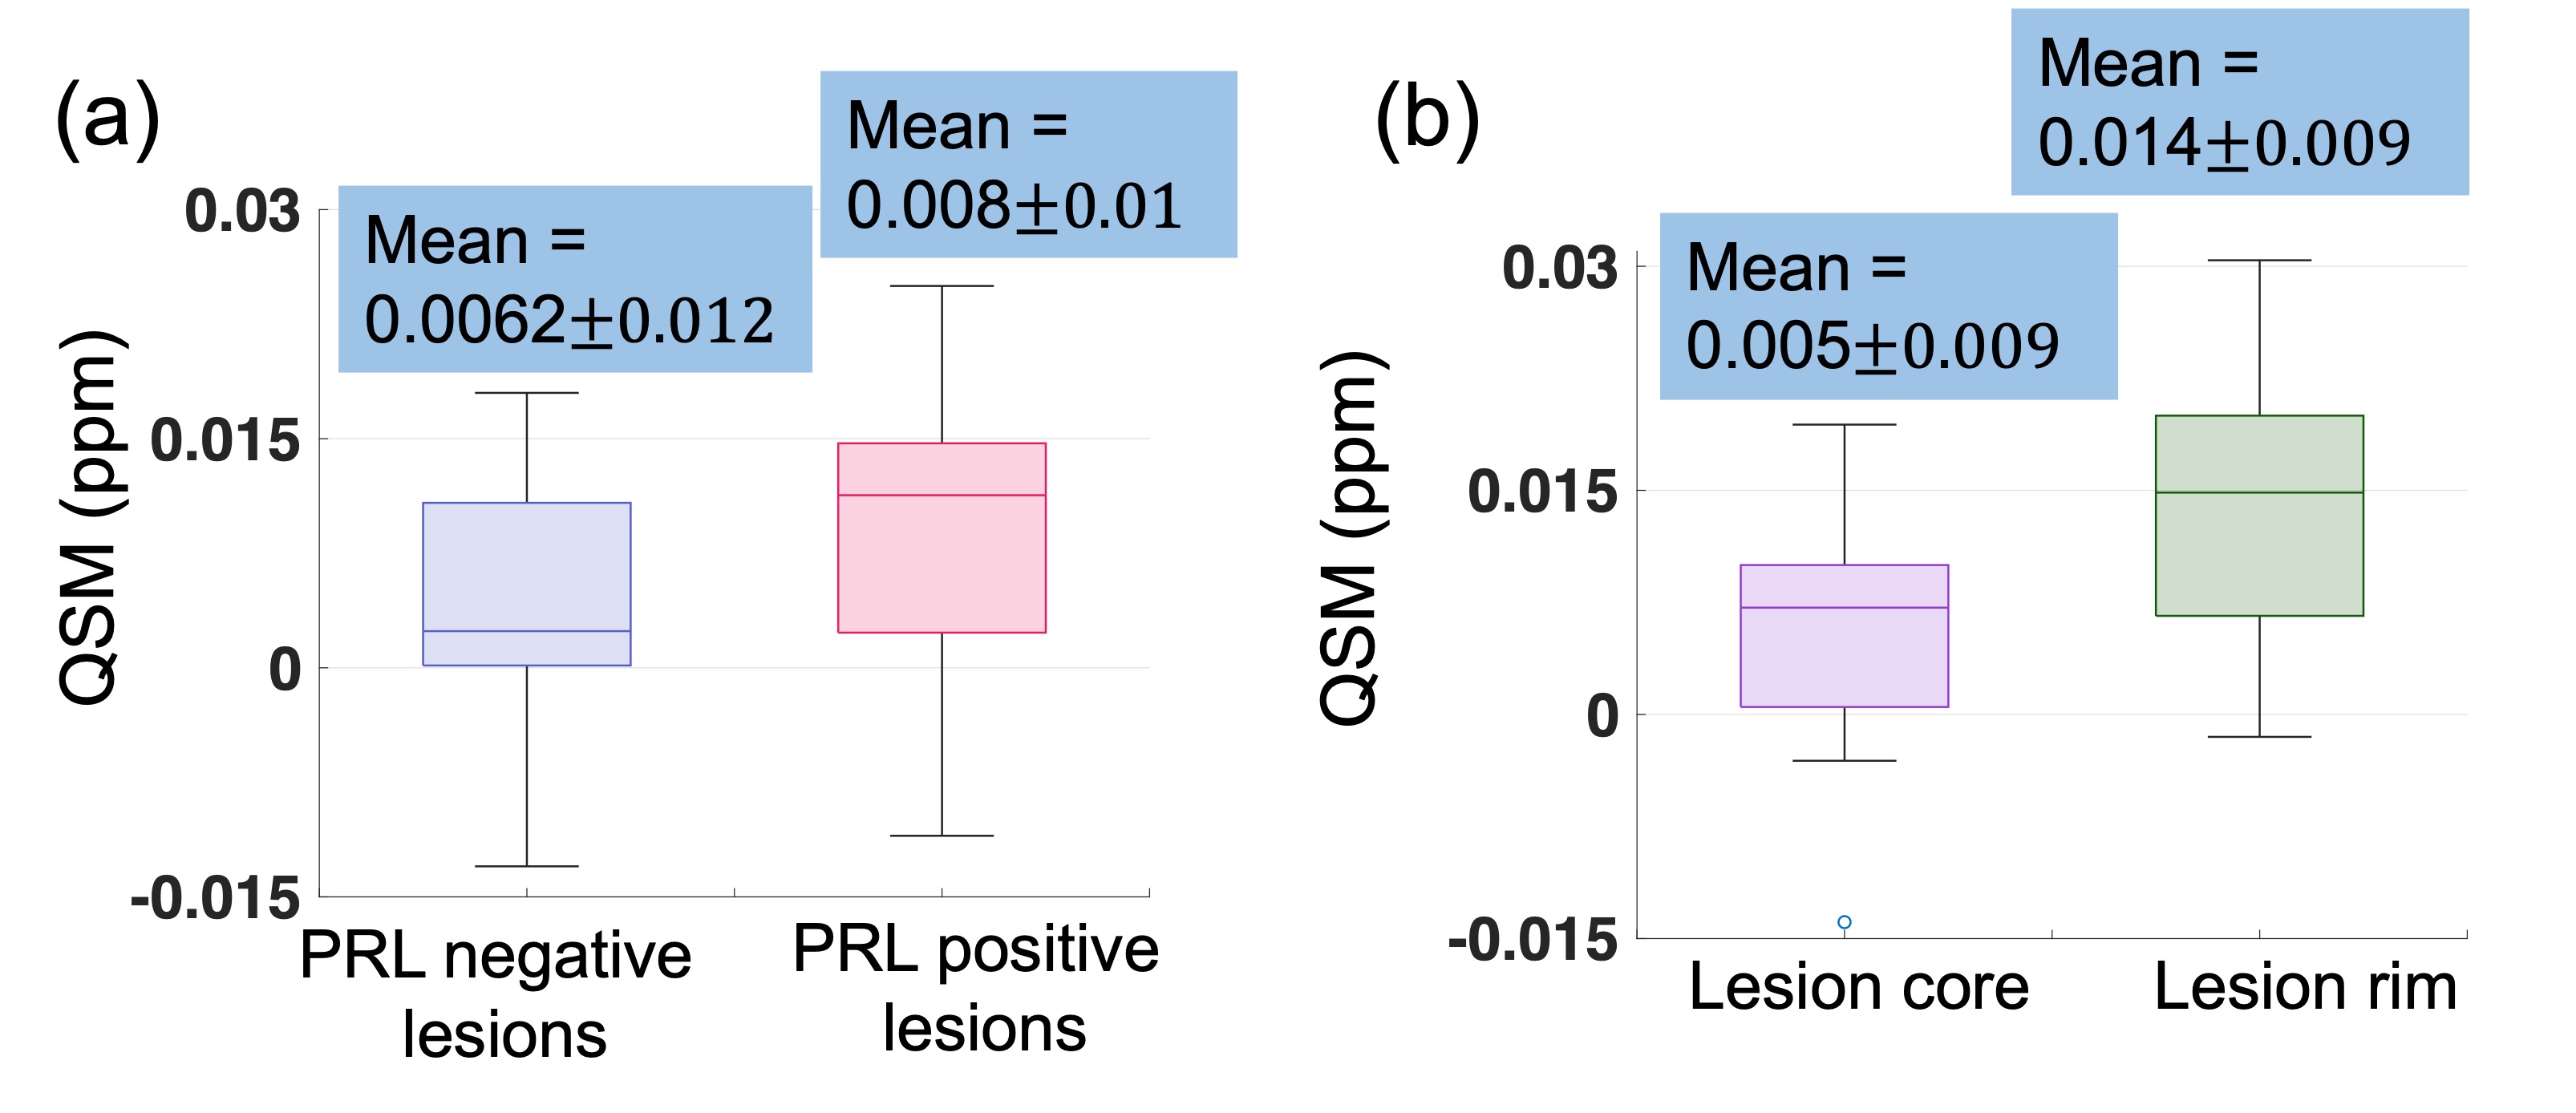
Submillimeter (650 μm) isotropic magnetic susceptibility maps were reconstructed from 3D-EPI data acquired at 3T and enabled clear visualization of the PRL in all imaging planes (Figure 3). Quantitively, deep grey nuclei structures and brain lesions had higher (paramagnetic) susceptibility values as compared to the lower (diamagnetic) susceptibility values of the normal appearing white matter (Figure 4). PRL+ lesions had on average 30% higher susceptibility values than PRL- lesions (mean QSMPRL+ = 0.008 ppm vs mean QSMPRL- = 0.006 ppm, p<0.66) (Figure 5a). In PRL+ lesions, the lesion rim had susceptibility values on average 3 times that of the lesion core (mean QSMrim=0.014 ppm vs mean QSMcore=0.005 ppm, p<0.03) (Figure 5b).Discussions
The use of the 3D-EPI sequence at 3T allows to compute submillimeter isotropic resolution QSM of the whole brain. This enables the precise delineation of the rim from the core in PRL, thus reducing partial volume averaging effects. The measure of high positive (paramagnetic) susceptibility values in the lesion rim is consistent with previous histopathological studies describing the presence of iron-rich ferritin within the microglia/macrophages accumulating at the edge of chronic active lesions. Additionally, the increase in susceptibility values measured inside the lesion core (positive) as compared to those of the normal appearing white matter (negative) is supported by the loss of (diamagnetic) myelin known to occur inside chronic active lesions, thus resulting in a relative increase in the tissue susceptibility.8, 13 Moreover, the presence of (paramagnetic) veins inside these lesions may also contribute to the relative positive susceptibility values measured inside these demyelinated lesions. Note that the QSM values reported in this study are lower than reported by previous QSM studies in MS. Given the known dependency of QSM as a function of the voxel dimensions,14 this discrepancy could be explained by the use of a voxel volume (~0.27 mm3) that is between 4 to 10 times smaller than previous studies based on standard GRE acquisitions (~1-3 mm3).Conclusions
In this study, we demonstrated the feasibility of performing submillimeter isotropic QSM reconstruction using 3D-EPI. This approach allows precise delineation of the lesion rim and lesion core in PRL thus reducing partial volume averaging and improving quantification of the susceptibility properties of chronic active lesions.Acknowledgements
We acknowledge the National MS Society (NMSS) RG-2110-38526, National Institutes of Neurological Disorder and Stroke (NINDS) 1U01NS116776-01, and Department of Defense, and Erwin Rautenberg Foundation for research support.References
1. Absinta M, Sati P, Fechner A, Schindler MK, Nair G, Reich DS. Identification of chronic active multiple sclerosis lesions on 3T MRI. American Journal of Neuroradiology. 2018;39(7):1233-8.
2. Bagnato F, Hametner S, Yao B, van Gelderen P, Merkle H, Cantor FK, Lassmann H, Duyn JH. Tracking iron in multiple sclerosis: a combined imaging and histopathological study at 7 Tesla. Brain. 2011;134(12):3602-15.
3. Gillen KM, Mubarak M, Nguyen TD, Pitt D. Significance and in vivo detection of iron-laden microglia in white matter multiple sclerosis lesions. Frontiers in immunology. 2018;9:255.
4. Wang Y, Liu T. Quantitative susceptibility mapping (QSM): decoding MRI data for a tissue magnetic biomarker. Magnetic resonance in medicine. 2015;73(1):82-101.
5. Langkammer C, Bredies K, Poser BA, Barth M, Reishofer G, Fan AP, Bilgic B, Fazekas F, Mainero C, Ropele S. Fast quantitative susceptibility mapping using 3D EPI and total generalized variation. Neuroimage. 2015;111:622-30.
6. Liu J, Liu T, de Rochefort L, Ledoux J, Khalidov I, Chen W, Tsiouris AJ, Wisnieff C, Spincemaille P, Prince MR. Morphology enabled dipole inversion for quantitative susceptibility mapping using structural consistency between the magnitude image and the susceptibility map. Neuroimage. 2012;59(3):2560-8.
7. Langkammer C, Liu T, Khalil M, Enzinger C, Jehna M, Fuchs S, Fazekas F, Wang Y, Ropele S. Quantitative susceptibility mapping in multiple sclerosis. Radiology. 2013;267(2):551-9.
8. Wiggermann V, Hametner S, Hernández‐Torres E, Kames C, Endmayr V, Kasprian G, Höftberger R, Li DK, Traboulsee A, Rauscher A. Susceptibility‐sensitive MRI of multiple sclerosis lesions and the impact of normal‐appearing white matter changes. NMR in Biomedicine. 2017;30(8):e3727.
9. Sati P, Patil S, Inati S, Wang W-T, Derbyshire JA, Krueger G, Reich DS, Butman JA. Rapid MR susceptibility imaging of the brain using segmented 3D echo-planar imaging (3D EPI) and its clinical applications. Magnetom Flash. 2017;68:26-32.
10. Avants BB, Tustison NJ, Stauffer M, Song G, Wu B, Gee JC. The Insight ToolKit image registration framework. Frontiers in neuroinformatics. 2014;8:44.
11. Fischl B. FreeSurfer. Neuroimage. 2012;62(2):774-81.
12. Valcarcel AM, Linn KA, Vandekar SN, Satterthwaite TD, Muschelli J, Calabresi PA, Pham DL, Martin ML, Shinohara RT. MIMoSA: an automated method for intermodal segmentation analysis of multiple sclerosis brain lesions. Journal of Neuroimaging. 2018;28(4):389-98.
13. Walsh AJ, Lebel RM, Eissa A, Blevins G, Catz I, Lu J-Q, Resch L, Johnson ES, Emery DJ, Warren KG. Multiple sclerosis: validation of MR imaging for quantification and detection of iron. Radiology. 2013;267(2):531-42.
14. Karsa A, Punwani S, Shmueli K. The effect of low resolution and coverage on the accuracy of susceptibility mapping. Magnetic resonance in medicine. 2019;81(3):1833-48.
Figures