2935
Microstructure-Informed Susceptibility Source Separation (MI-SSS) for Improved Estimation of Neural Myelin and Iron Content1Electrical and Computer Engineering, Cornell University, Ithaca, NY, United States, 2Department of Radiology, Weill Cornell Medicine, New York, NY, United States, 3Department of Neurology, Weill Cornell Medicine, New York, NY, United States, 4Biomedical Engineering, Cornell University, Ithaca, NY, United States
Synopsis
Keywords: Multiple Sclerosis, Susceptibility
Motivation: Current approaches to identify diamagnetic and paramagnetic susceptibility sources in the brain suffer from confounding effects caused by microstructure or pathological changes such as edema.
Goal(s): The aim of this study is to present the microstructure-informed framework developed for the improved estimation of diamagnetic and paramagnetic sources free from confounding effects of fiber orientations and edema.
Approach: We employ the biophysical modeling-based generation of gradient-echo signals and stochastic matching pursuit for the parameter estimation via a pre-computed dictionary.
Results: The results show that MI-SSS is robust against the fiber orientation dependent field effects and increased tissue water.
Impact: This study introduces MI-SSS as an improved susceptibility source separation technique. The aim is to map diamagnetic and paramagnetic source distributions inside the brain free from the confounding effects of fiber orientation and water content changes such as in edema.
Introduction
Quantitative Susceptibility Mapping (QSM) is an emerging MRI modality for noninvasive quantification of susceptibility sources inside the body such as myelin and iron from the phase of the multi gradient echo (mGRE) data1. The recently developed susceptibility source separation (SSS) method exploits the additive contribution of susceptibility sources to the magnitude decay in addition to the canceling contributions to susceptibility2. It allows constructing separate paramagnetic ($$$\chi^+$$$) and diamagnetic ($$$\chi^-$$$) susceptibility maps. However, the original method requires R2′ maps which necessitates a separate measurement of R2. By assuming a linear relation between R2 and R2*, an R2 measurement can be avoided3-5. Although this requires only mGRE data, contributions to R2 unrelated to susceptibility, such as edema, lead to increased errors. Moreover, both R2′ and R2* based SSS methods suffer from fiber orientation-dependent fields of myelin sheaths and corresponding magnitude decays6,7. In this study, we try to overcome these drawbacks by detailed biophysical modeling of the brain tissue microstructure and propose Microstructure-Informed Susceptibility Source Separation (MI-SSS).Methods
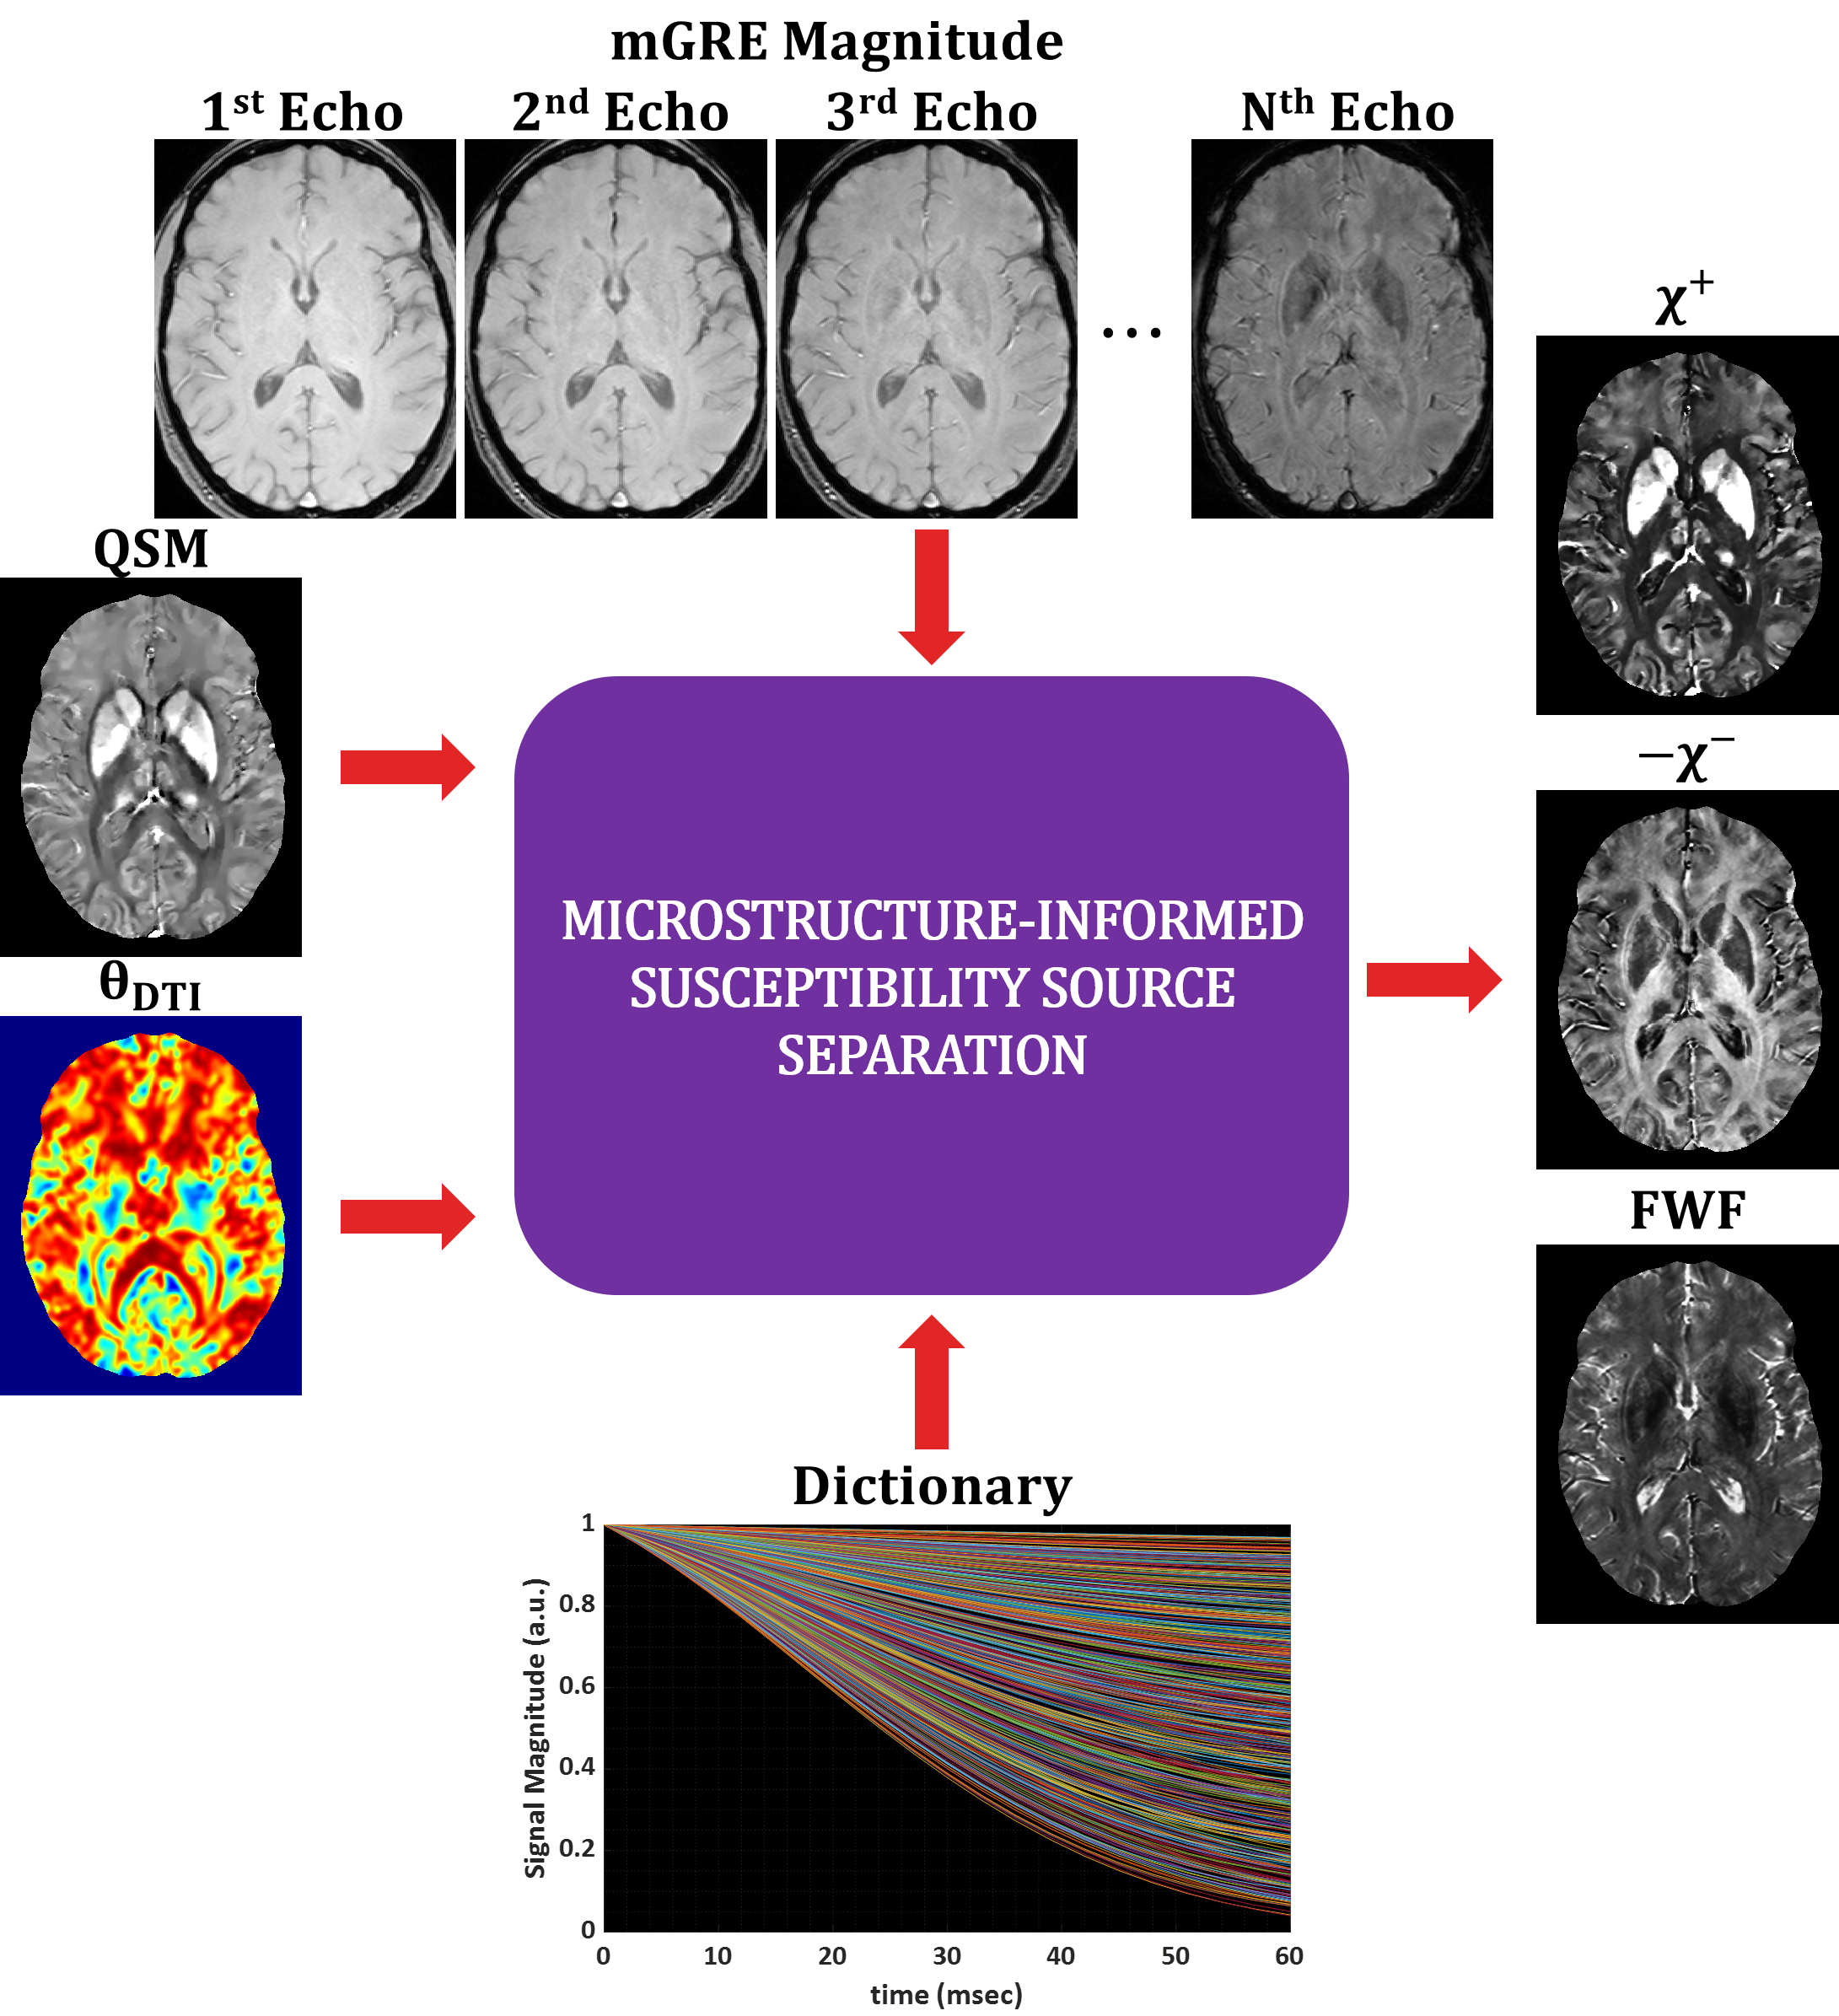
The previously proposed Microstructure-Informed Myelin Mapping (MIMM)8 is a method developed to quantify brain myelin content through biophysical modeling of realistic white matter consisting of hollow cylindrical diamagnetic myelin and isotropic iron. MIMM utilizes stochastic matching pursuit in a pre-computed dictionary to map myelin and iron content. MI-SSS is an extension of MIMM which incorporates an additional water pool to account for the free water effects. A visual summary of MI-SSS is demonstrated in Figure 1. Here, MI-SSS is employed to calculate $$$\chi^+$$$, $$$\chi^-$$$, and free water fraction (FWF) distributions in 12 MS patients from mGRE magnitude, QSM, and diffusion tensor imaging (DTI)-derived fiber orientation map ( $$$\theta_{DTI}$$$).Each subject was scanned with structural T2FLAIR, mGRE for QSM and SSS, FAST-T2 for R2 and MWF mapping9, FAST-T1 for T1 mapping10, and DTI for mapping. Acquisition details for mGRE can be found in3 while they are given for FAST-T2 and FAST-T1 in10. DTI SE-EPI data was acquired with 30 diffusion encoding directions, b = 1000 s/mm2, TR = 10000 ms, TE= 84 ms, voxel size = 1.9×1.9×2.5 mm3. The dependence of each estimated parameter on fiber orientation was visualized by binning voxel values across patients into 19 bins of 5 degrees.
Results and Discussion
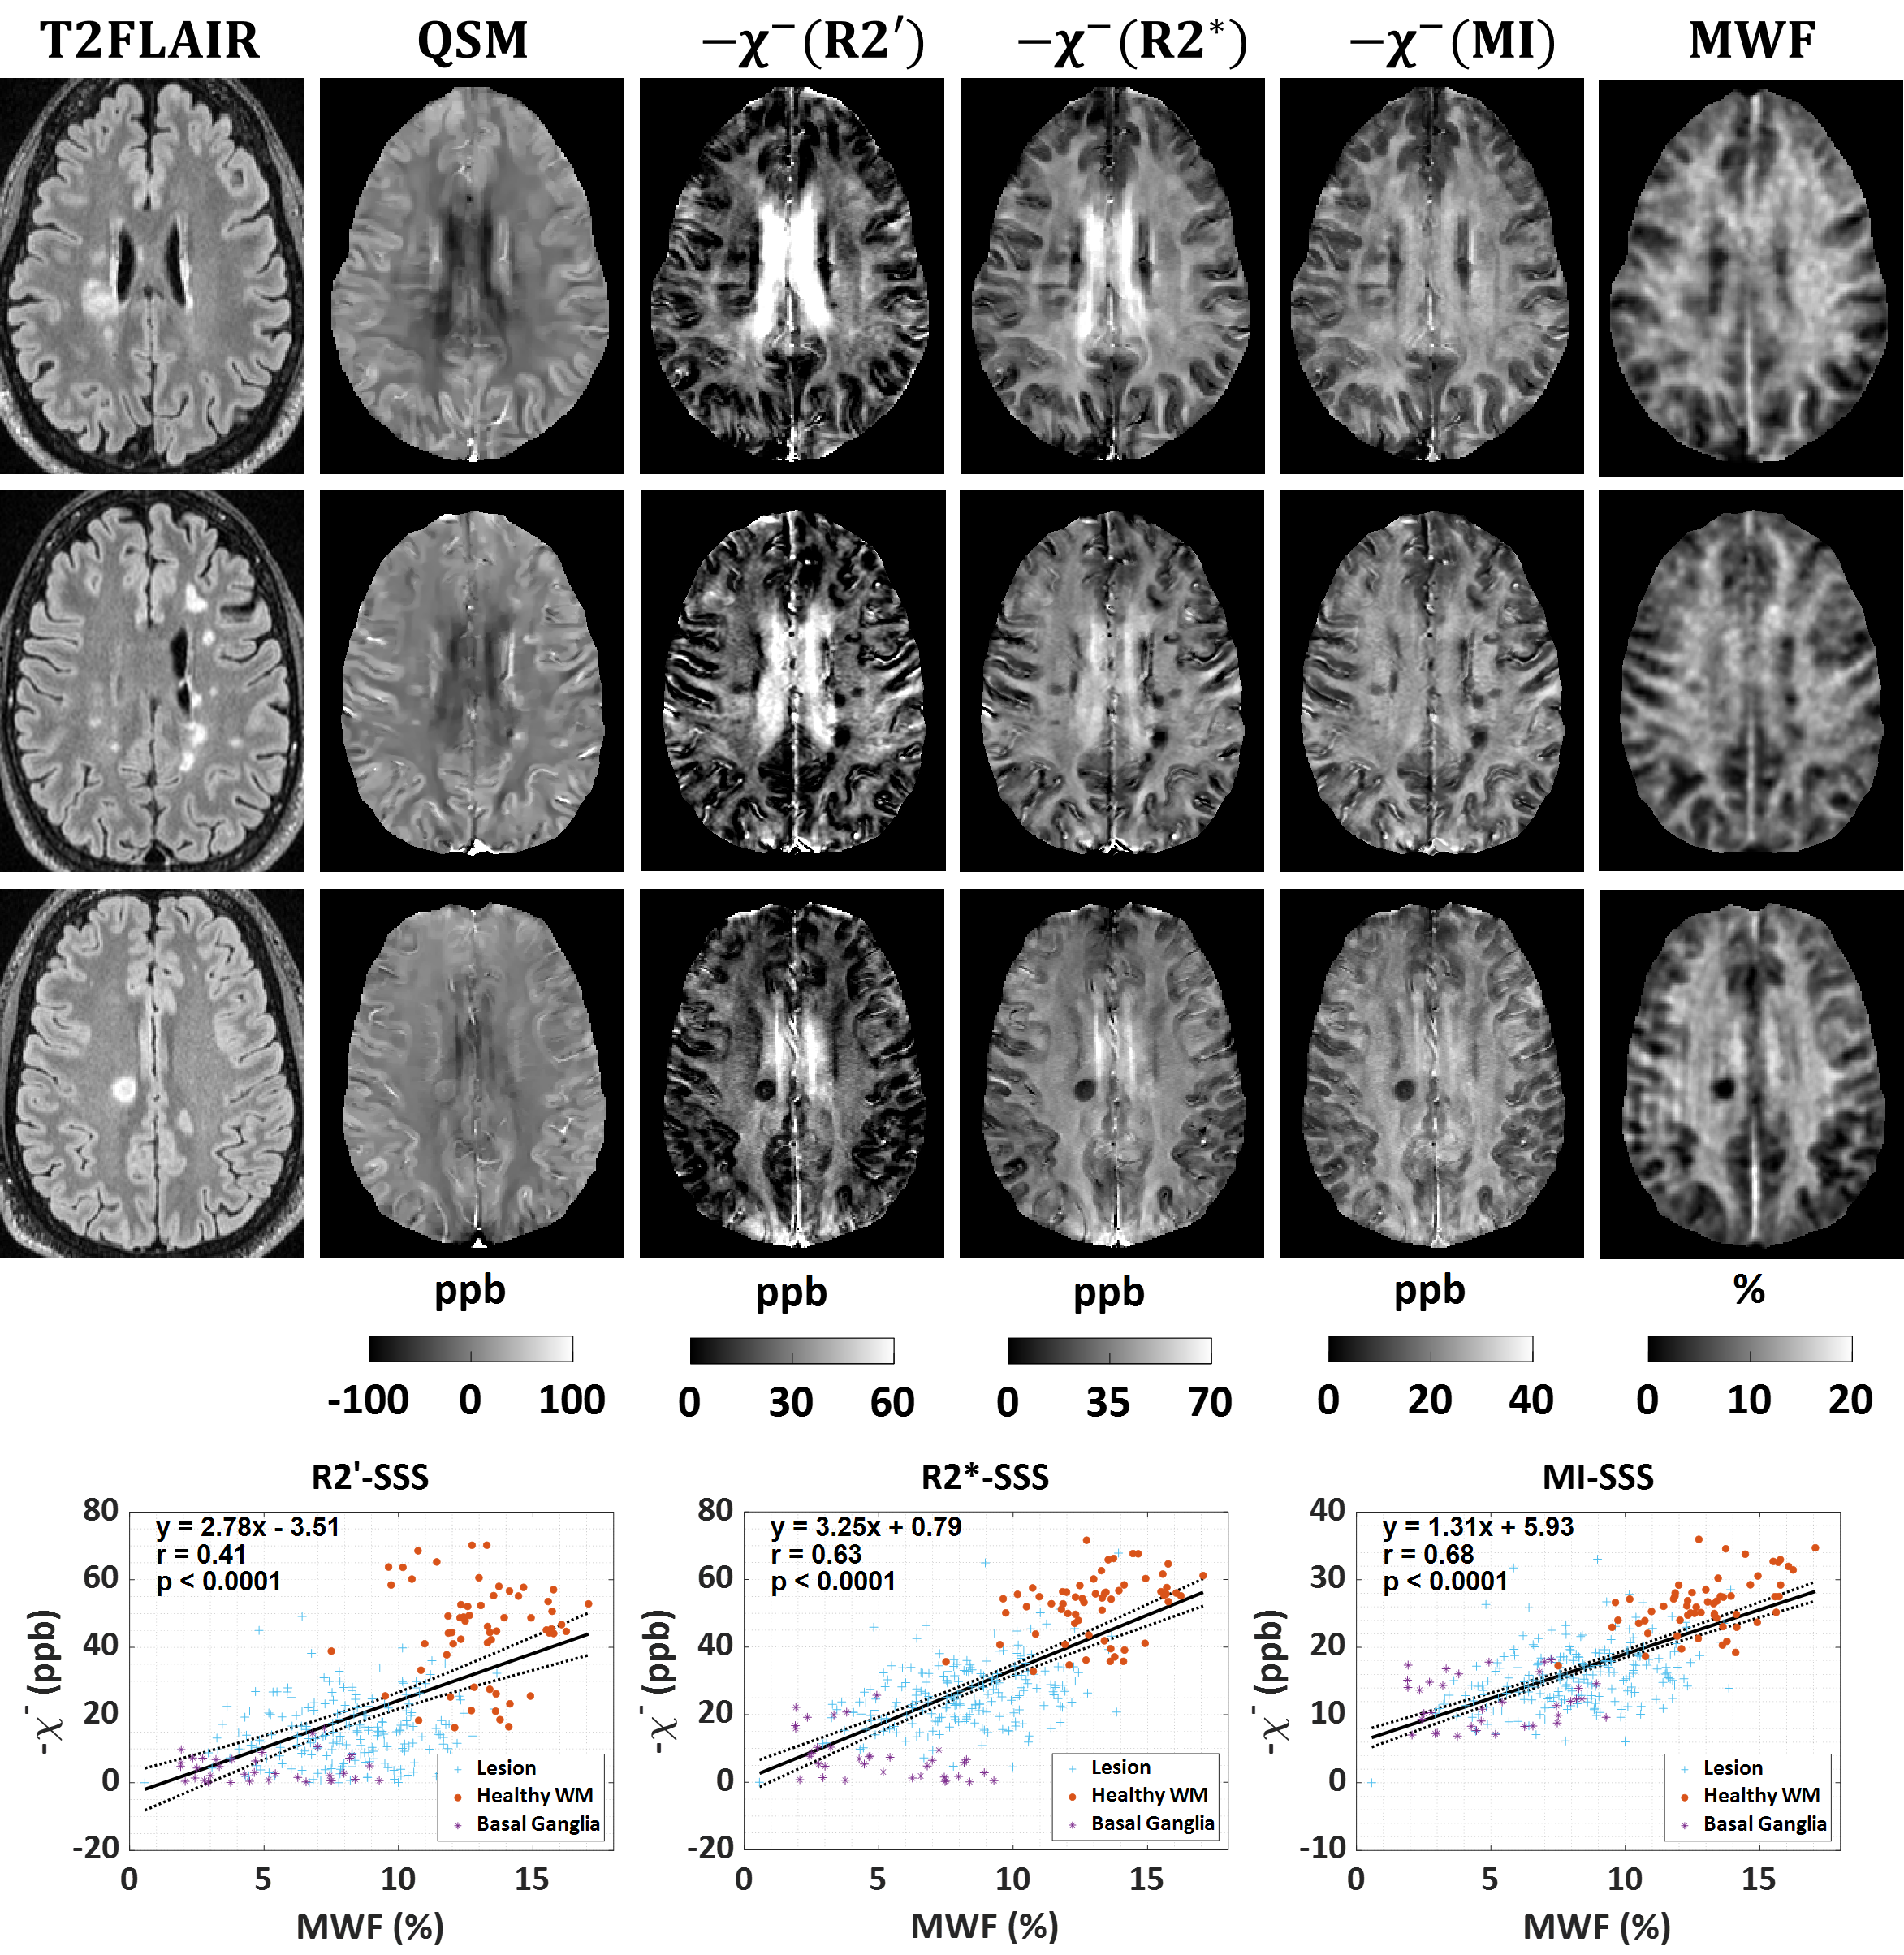
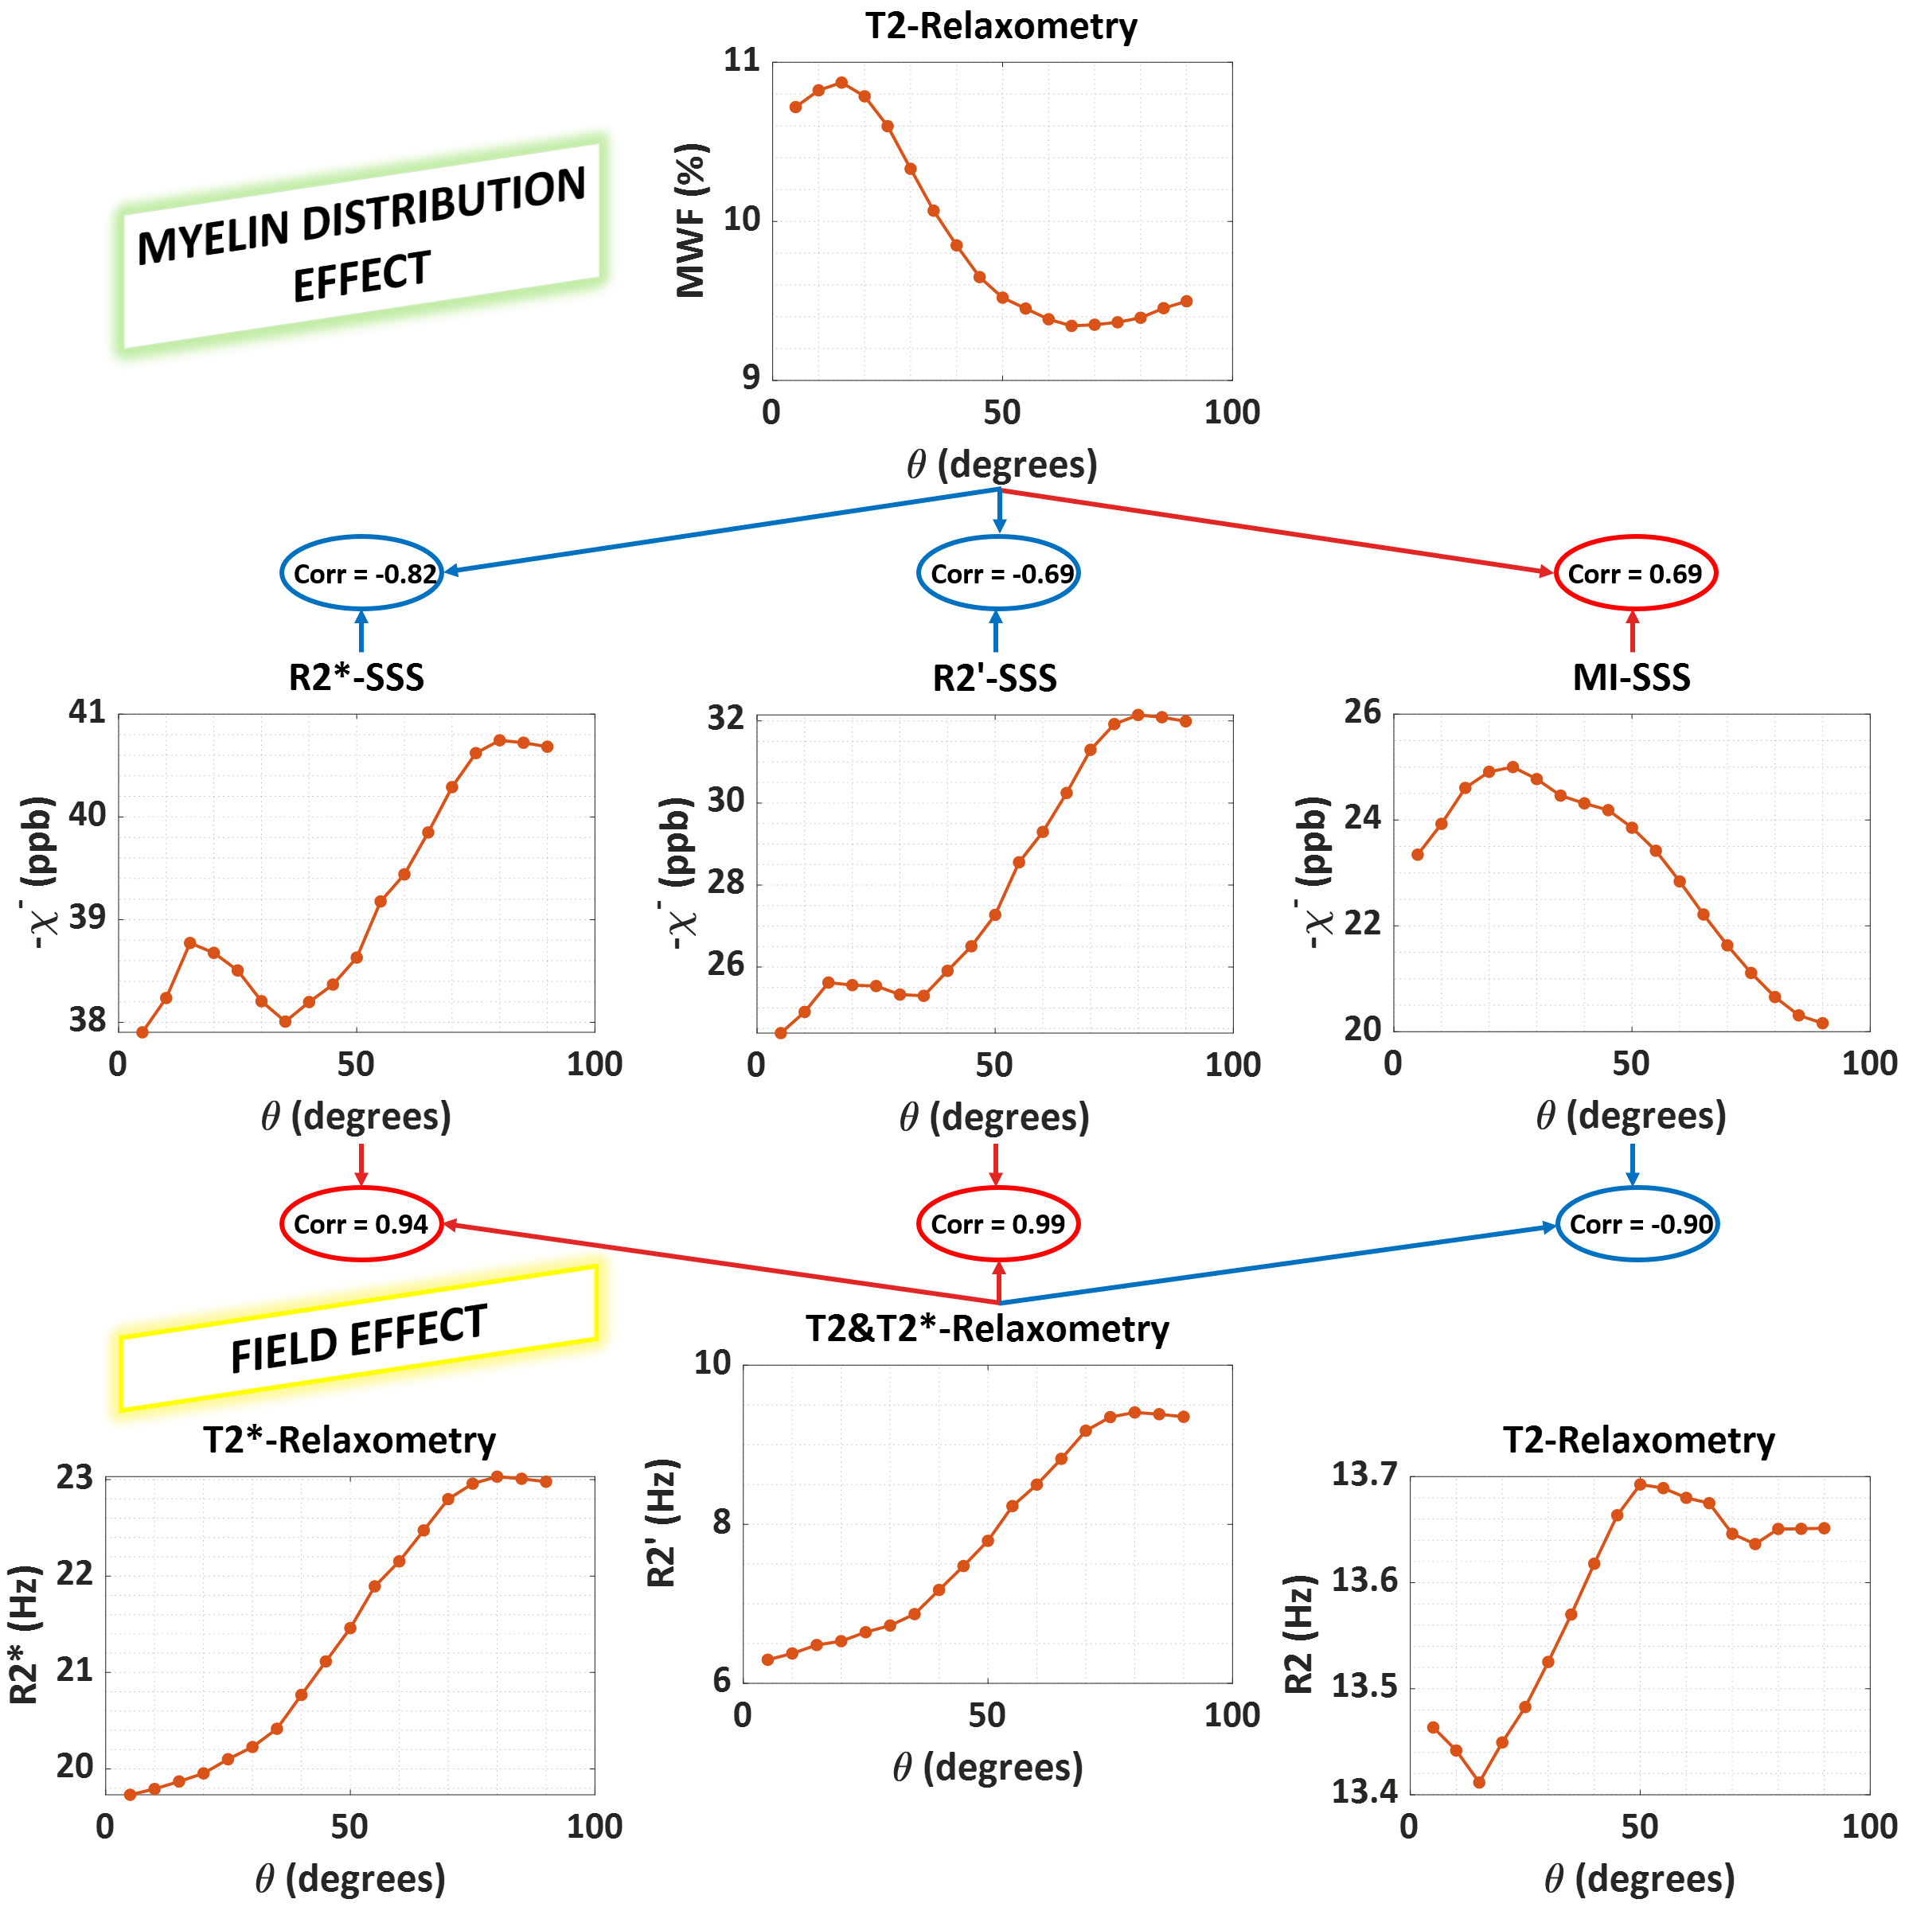
Figure 2 demonstrates example $$$\chi^-$$$ maps from 3 MS patients in addition to T2FLAIR images, QSM, and myelin water fraction (MWF) maps. All 3 SSS techniques successfully visualize the demyelination in lesions. However, due to fiber orientation-dependent field effects, the $$$\chi^-$$$ in the corpus callosum is clearly overestimated in R2′-SSS and R2*-SSS. MI-SSS successfully addresses this issue and presents a more uniform distribution similar to reference MWF maps. All methods show a significant correlation with MWF where MI-SSS presents the highest correlation.In Figure 3, the analysis regarding the orientation dependence of each SSS technique is investigated and it is shown that R2′ and R2*-SSS have very strong correlations with the orientation dependence of R2′ caused by field effects whereas MI-SSS orientation dependence mainly comes from myelin distribution11,12. This shows that MI-SSS is a more reliable source of myelin content in major fiber tracts with highly organized fibers.
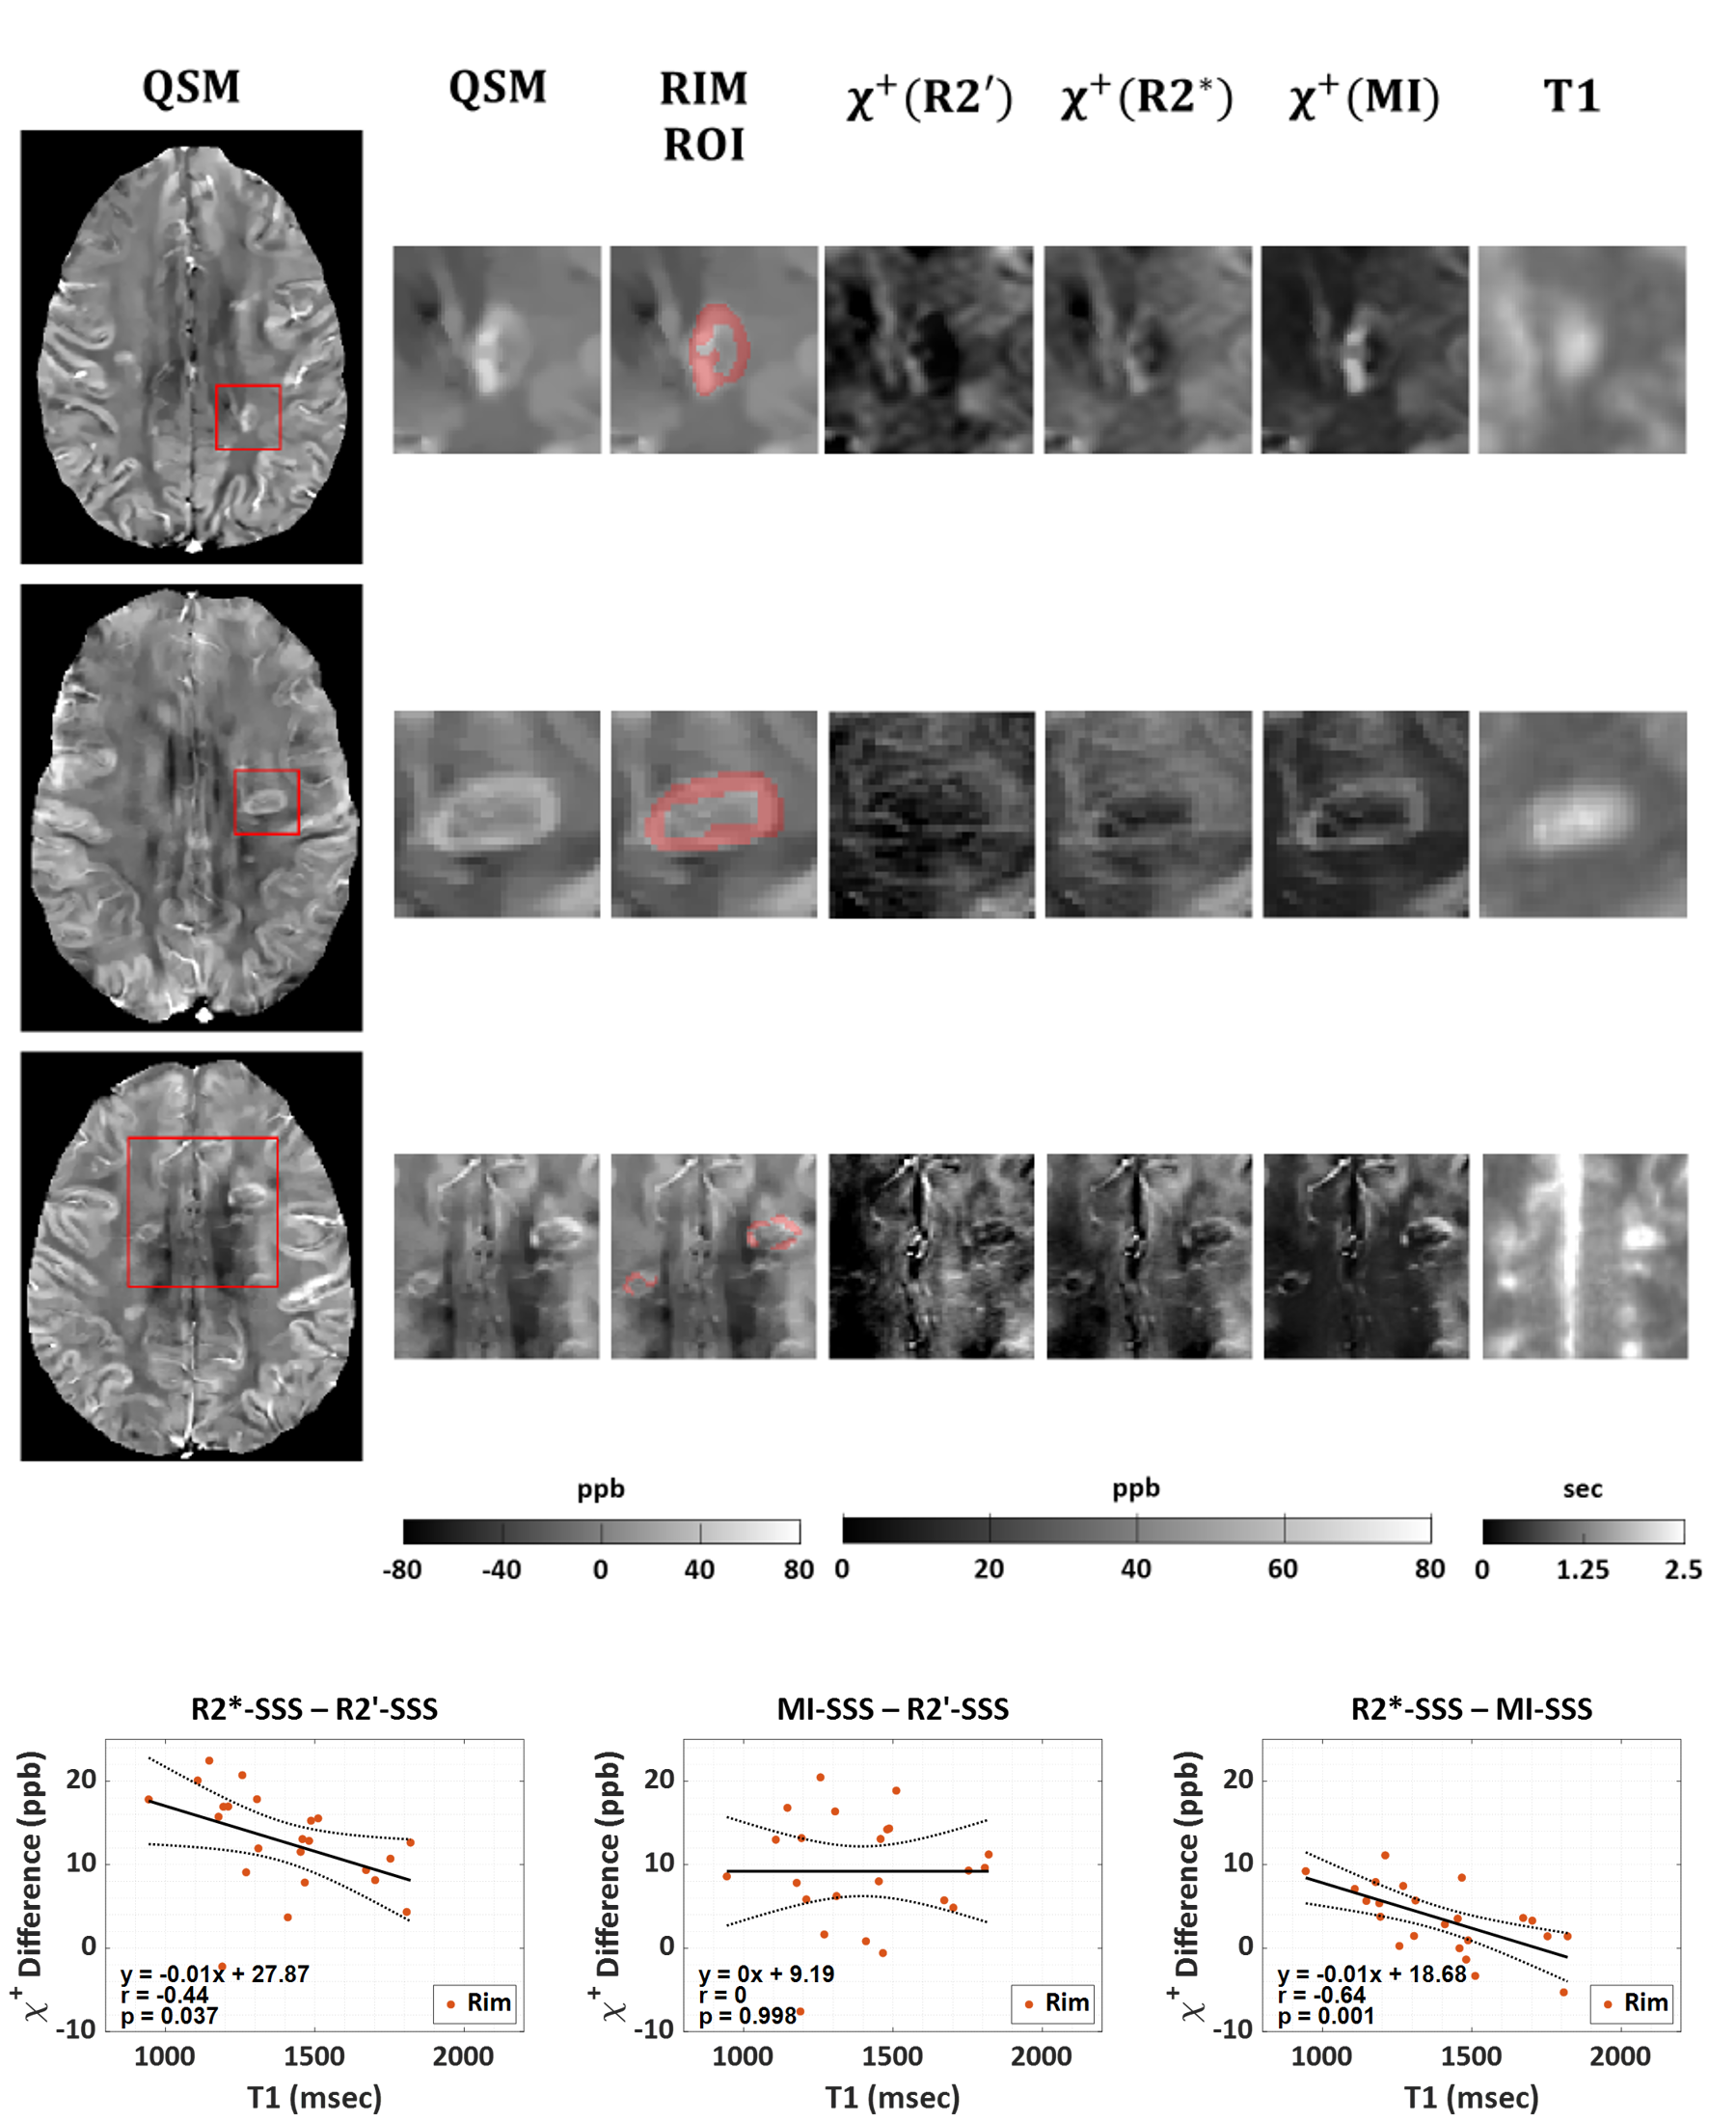
Figure 4 presents iron quantification via SSS with $$$\chi^+$$$ maps at paramagnetic rim lesions (PRL). Paramagnetic rims are composed mainly of iron-laden activated microglial and macrophage cells13. However, acute MS lesions may also develop edema which in return will increase T2-relaxation time and cause R2* to decrease. R2*-SSS interprets a decrease in R2* as a decrease in the total susceptibility content and underestimates both $$$|\chi^+|$$$ and $$$|\chi^-|$$$. MI-SSS presents a better depiction of paramagnetic rims in Figure 4 and the correlation between the differences between the SSS methods and T1 as a total water biomarker14 shows the sensitivity of R2*-SSS to water changes.
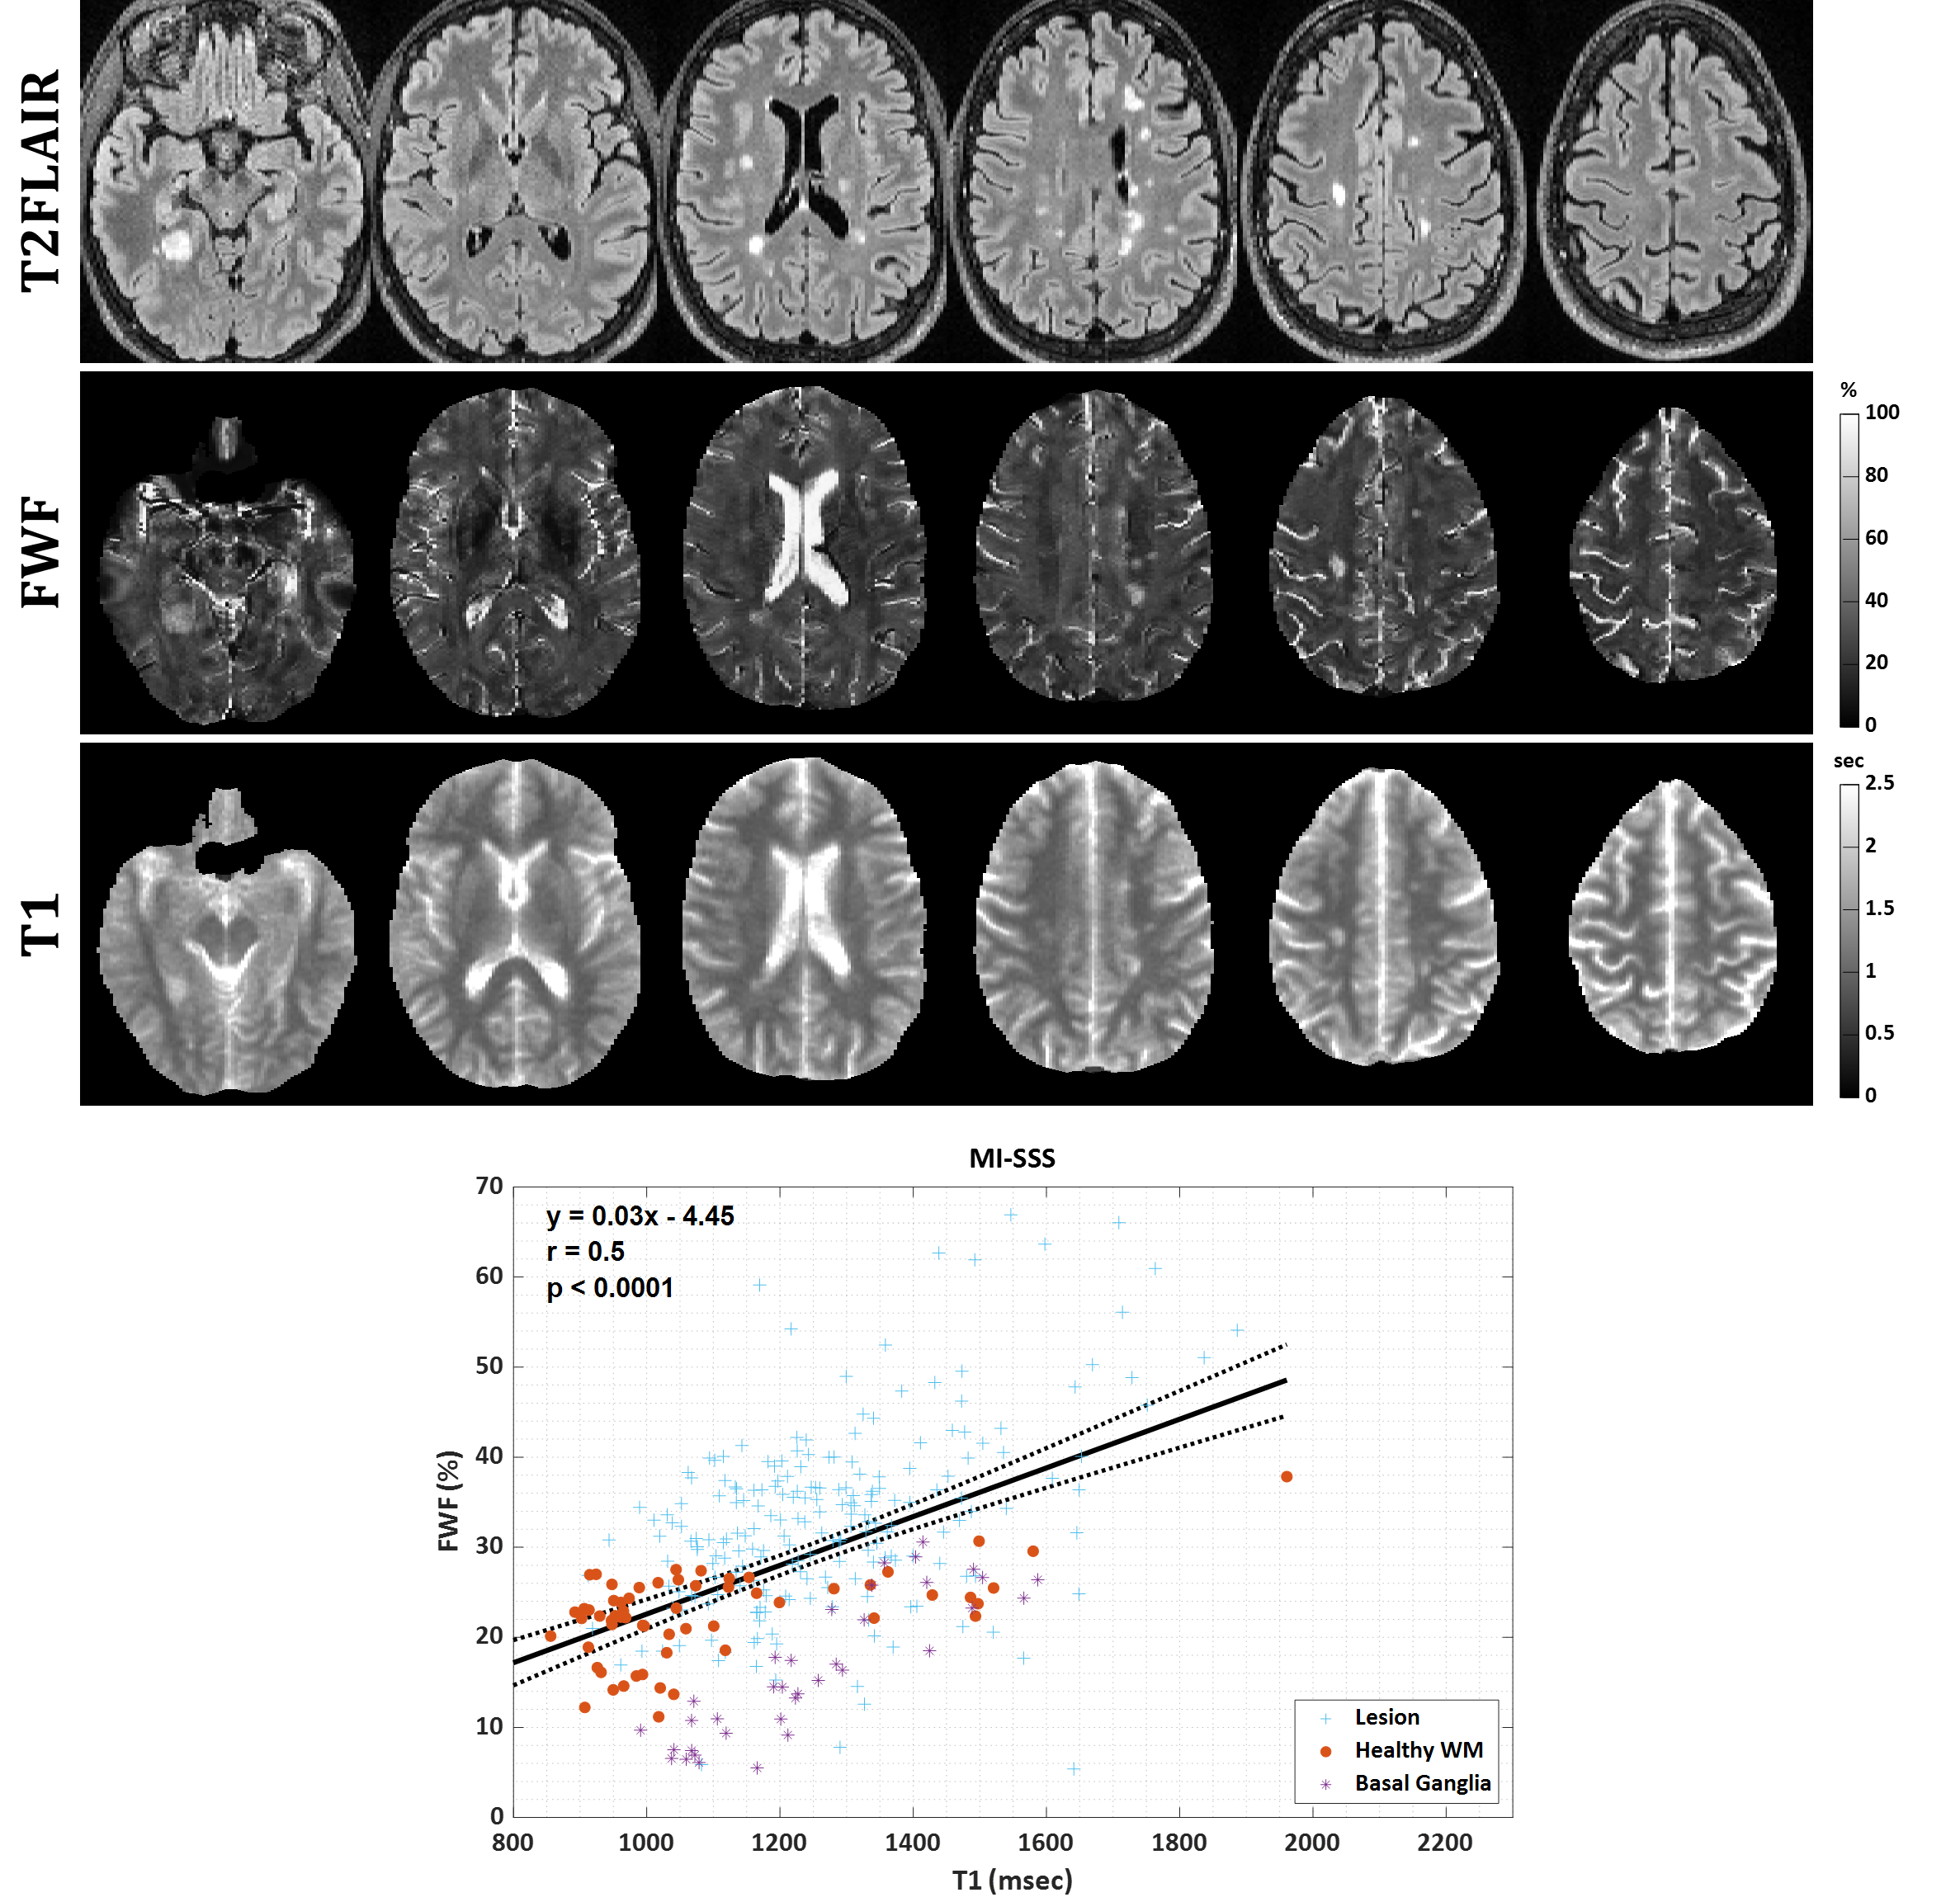
Figure 5 shows T2FLAIR images, T1, and FWF maps from a single subject in multiple slices. Also, the correlation between FWF and T1 is also provided to demonstrate the sensitivity of FWF to brain water content. Although the correlation is mediocre since FWF measures free water and T1 measures total water, significant correlation supports the MI-SSS’ capability to detect water changes and account for it.
Conclusion
MI-SSS provides improved estimation of neural paramagnetic and diamagnetic sources by addressing issues of fiber orientation dependent decay rates and underestimation due to edematous tissues.Acknowledgements
This work was supported in part by research grants from the NIH: R01NS105144, R01NS090464, R01NS095562, S10OD021782, R01HL151686, and National MS Society: RG-1602-07671.References
1. Wang Y, Liu T. Quantitative susceptibility mapping (QSM): decoding MRI data for a tissue magnetic biomarker. Magnetic resonance in medicine 2015;73(1):82-101.
2. Shin HG, Lee J, Yun YH, Yoo SH, Jang J, Oh SH, Nam Y, Jung S, Kim S, Fukunaga M, Kim W, Choi HJ. χ-separation: Magnetic susceptibility source separation toward iron and myelin mapping in the brain. Neuroimage 2021;240:118371.
3. Dimov AV, Nguyen TD, Gillen KM, Marcille M, Spincemaille P, Pitt D, Gauthier SA, Wang Y. Susceptibility source separation from gradient echo data using magnitude decay modeling. J Neuroimaging 2022;32(5):852-859.
4. Dimov AV, Gillen KM, Nguyen TD, Kang J, Sharma R, Pitt D, Gauthier SA, Wang Y. Magnetic Susceptibility Source Separation Solely from Gradient Echo Data: Histological Validation. Tomography 2022;8(3):1544-1551.
5. Chen J, Gong NJ, Chaim KT, Otaduy MCG, Liu C. Decompose quantitative susceptibility mapping (QSM) to sub-voxel diamagnetic and paramagnetic components based on gradient-echo MRI data. Neuroimage 2021;242:118477.
6. Wharton S, Bowtell R. Fiber orientation-dependent white matter contrast in gradient echo MRI. Proc Natl Acad Sci U S A 2012;109(45):18559-18564.
7. Wharton S, Bowtell R. Gradient echo based fiber orientation mapping using R2* and frequency difference measurements. Neuroimage 2013;83:1011-1023.
8. Sisman M, Nguyen TD, Roberts AG, Romano DJ, Dimov AV, Kovanlikaya I, Spincemaille P, Wang Y. Microstructure-Informed Myelin Mapping (MIMM) from Gradient Echo MRI using Stochastic Matching Pursuit. medRxiv 2023.
9. Nguyen TD, Deh K, Monohan E, Pandya S, Spincemaille P, Raj A, Wang Y, Gauthier SA. Feasibility and reproducibility of whole brain myelin water mapping in 4 minutes using fast acquisition with spiral trajectory and adiabatic T2prep (FAST‐T2) at 3T. Magnetic resonance in medicine 2016;76(2):456-465.
10. Nguyen TD, Spincemaille P, Gauthier SA, Wang Y. Rapid whole brain myelin water content mapping without an external water standard at 1.5 T. Magnetic Resonance Imaging 2017;39:82-88.
11. Birkl C, Doucette J, Fan M, Hernández‐Torres E, Rauscher A. Myelin water imaging depends on white matter fiber orientation in the human brain. Magnetic resonance in medicine 2021;85(4):2221-2231.
12. Morris SR, Vavasour IM, Smolina A, MacMillan EL, Gilbert G, Lam M, Kozlowski P, Michal CA, Manning A, MacKay AL, Laule C. Myelin biomarkers in the healthy adult brain: Correlation, reproducibility, and the effect of fiber orientation. Magn Reson Med 2023;89(5):1809-1824.
13. Kaunzner UW, Kang Y, Zhang S, Morris E, Yao Y, Pandya S, Hurtado Rua SM, Park C, Gillen KM, Nguyen TD, Wang Y, Pitt D, Gauthier SA. Quantitative susceptibility mapping identifies inflammation in a subset of chronic multiple sclerosis lesions. Brain 2019;142(1):133-145.
14. Fatouros PP, Marmarou A, Kraft KA, Inao S, Schwarz FP. In vivo brain water determination by T1 measurements: effect of total water content, hydration fraction, and field strength. Magn Reson Med 1991;17(2):402-413.
Figures