2934
Impact of socioeconomic status and parental stress on infant regional brain development1Department of Radiology, Children's Hospital of Philadelphia, Philadelphia, PA, United States, 2Department of Bioengineering, University of Pennsylvania, Philadelphia, PA, United States, 3Department of Radiology, University of Pennsylvania, Philadelphia, PA, United States
Synopsis
Keywords: Gray Matter, Brain, Screening, Infant, Early Development, Structural MRI
Motivation: Human brain development is suggested to rely on a complex interplay between biological and environmental factors. For the latter, socioeconomic status (SES) and parental stress can significantly impact the development of cognitive and social skills. However, their links to infant brain development are not well understood.
Goal(s): Our goal is to identify regional brain development critically affected by environmental influences.
Approach: High-resolution structural MRI of 95 infants aged 0-22 months, and the corresponding SES, and parental perceived stress scales (PSS) were utilized to investigate how they are associated.
Results: Higher SES is associated with larger volumes in prefrontal cortex and inferior frontal gyrus.
Impact: The significant, positive correlations between socioeconomic status and prefrontal cortical, inferior frontal gyral volume underscore environmental impact on brain development during the critical period of infancy. Further investigation of brain regions related to emotion, executive function, and memory is warranted.
Introduction
Infant brain development is characterized by the most dynamic and rapid structural and functional changes across the lifespan1,2. In addition to genetic factors, the environmental contexts a person experiences also heavily influences their cognitive development3,4. Previous studies showed positive correlations between socioeconomic status (SES) and brain volume in children5 and young adults6. Children from disadvantaged socioeconomic backgrounds often have limited exposure to cognitive and linguistic stimulation, impacting the development of prefrontal cortex and left inferior frontal gyrus3,7. Additionally, increased stress in these households also affects the development of hippocampus, amygdala, and thalamus which are crucial for memory and social-emotional processing8. Hence, we hypothesized that regional brain structural changes during infancy are affected by environmental factors like SES and parental stress9,10. We measured the amygdaloid, thalamic, hippocampal, left inferior fontal gyral, and prefrontal cortical volumes of 95 infants using T1-weighted (T1w) MRI and assessed their parental stress and SES through questionnaires. The goal of this study is to investigate the association between specific brain structural development and environmental factors in typical developing infants from 0 to 22 months.Methods
Participants and data acquisition: This study involved 95 typically developing infants comprising 53 females and 42 males, ranging from 0 to 22 months. Images were acquired using a 3.0T Siemens Prisma scanner. T1w images were obtained using the MPRAGE sequence, featuring a voxel size of 0.8mm isotropic. The T1w imaging parameters included TR/TE/TI of 2400/2.24/1060ms, a field of view (FOV) of 256 × 240 mm², an acquisition matrix of 320 x 300, and slice thickness of 0.8 mm. The acquisition of the T1w images took 6.38 minutes.Parental questionnaires: Parents of the infants were asked to complete questionnaires on SES and perceived stress using the Perceived Stress Scale (PSS). SES, based on parental education and occupation, was quantified using the Amherst modification of the Hollingshead two-factor index11. The PSS questionnaire contains 10 items measuring whether caregivers perceive life as unpredictable, uncontrollable, or overloading in the past month. Responses ranged from 0 (never) to 4 (very often). Total stress was calculated by reverse-scoring and summing responses for questions 4, 5, 7, 8. Scores ranged from 0 to 40, with higher scores indicating greater perceived stress12.
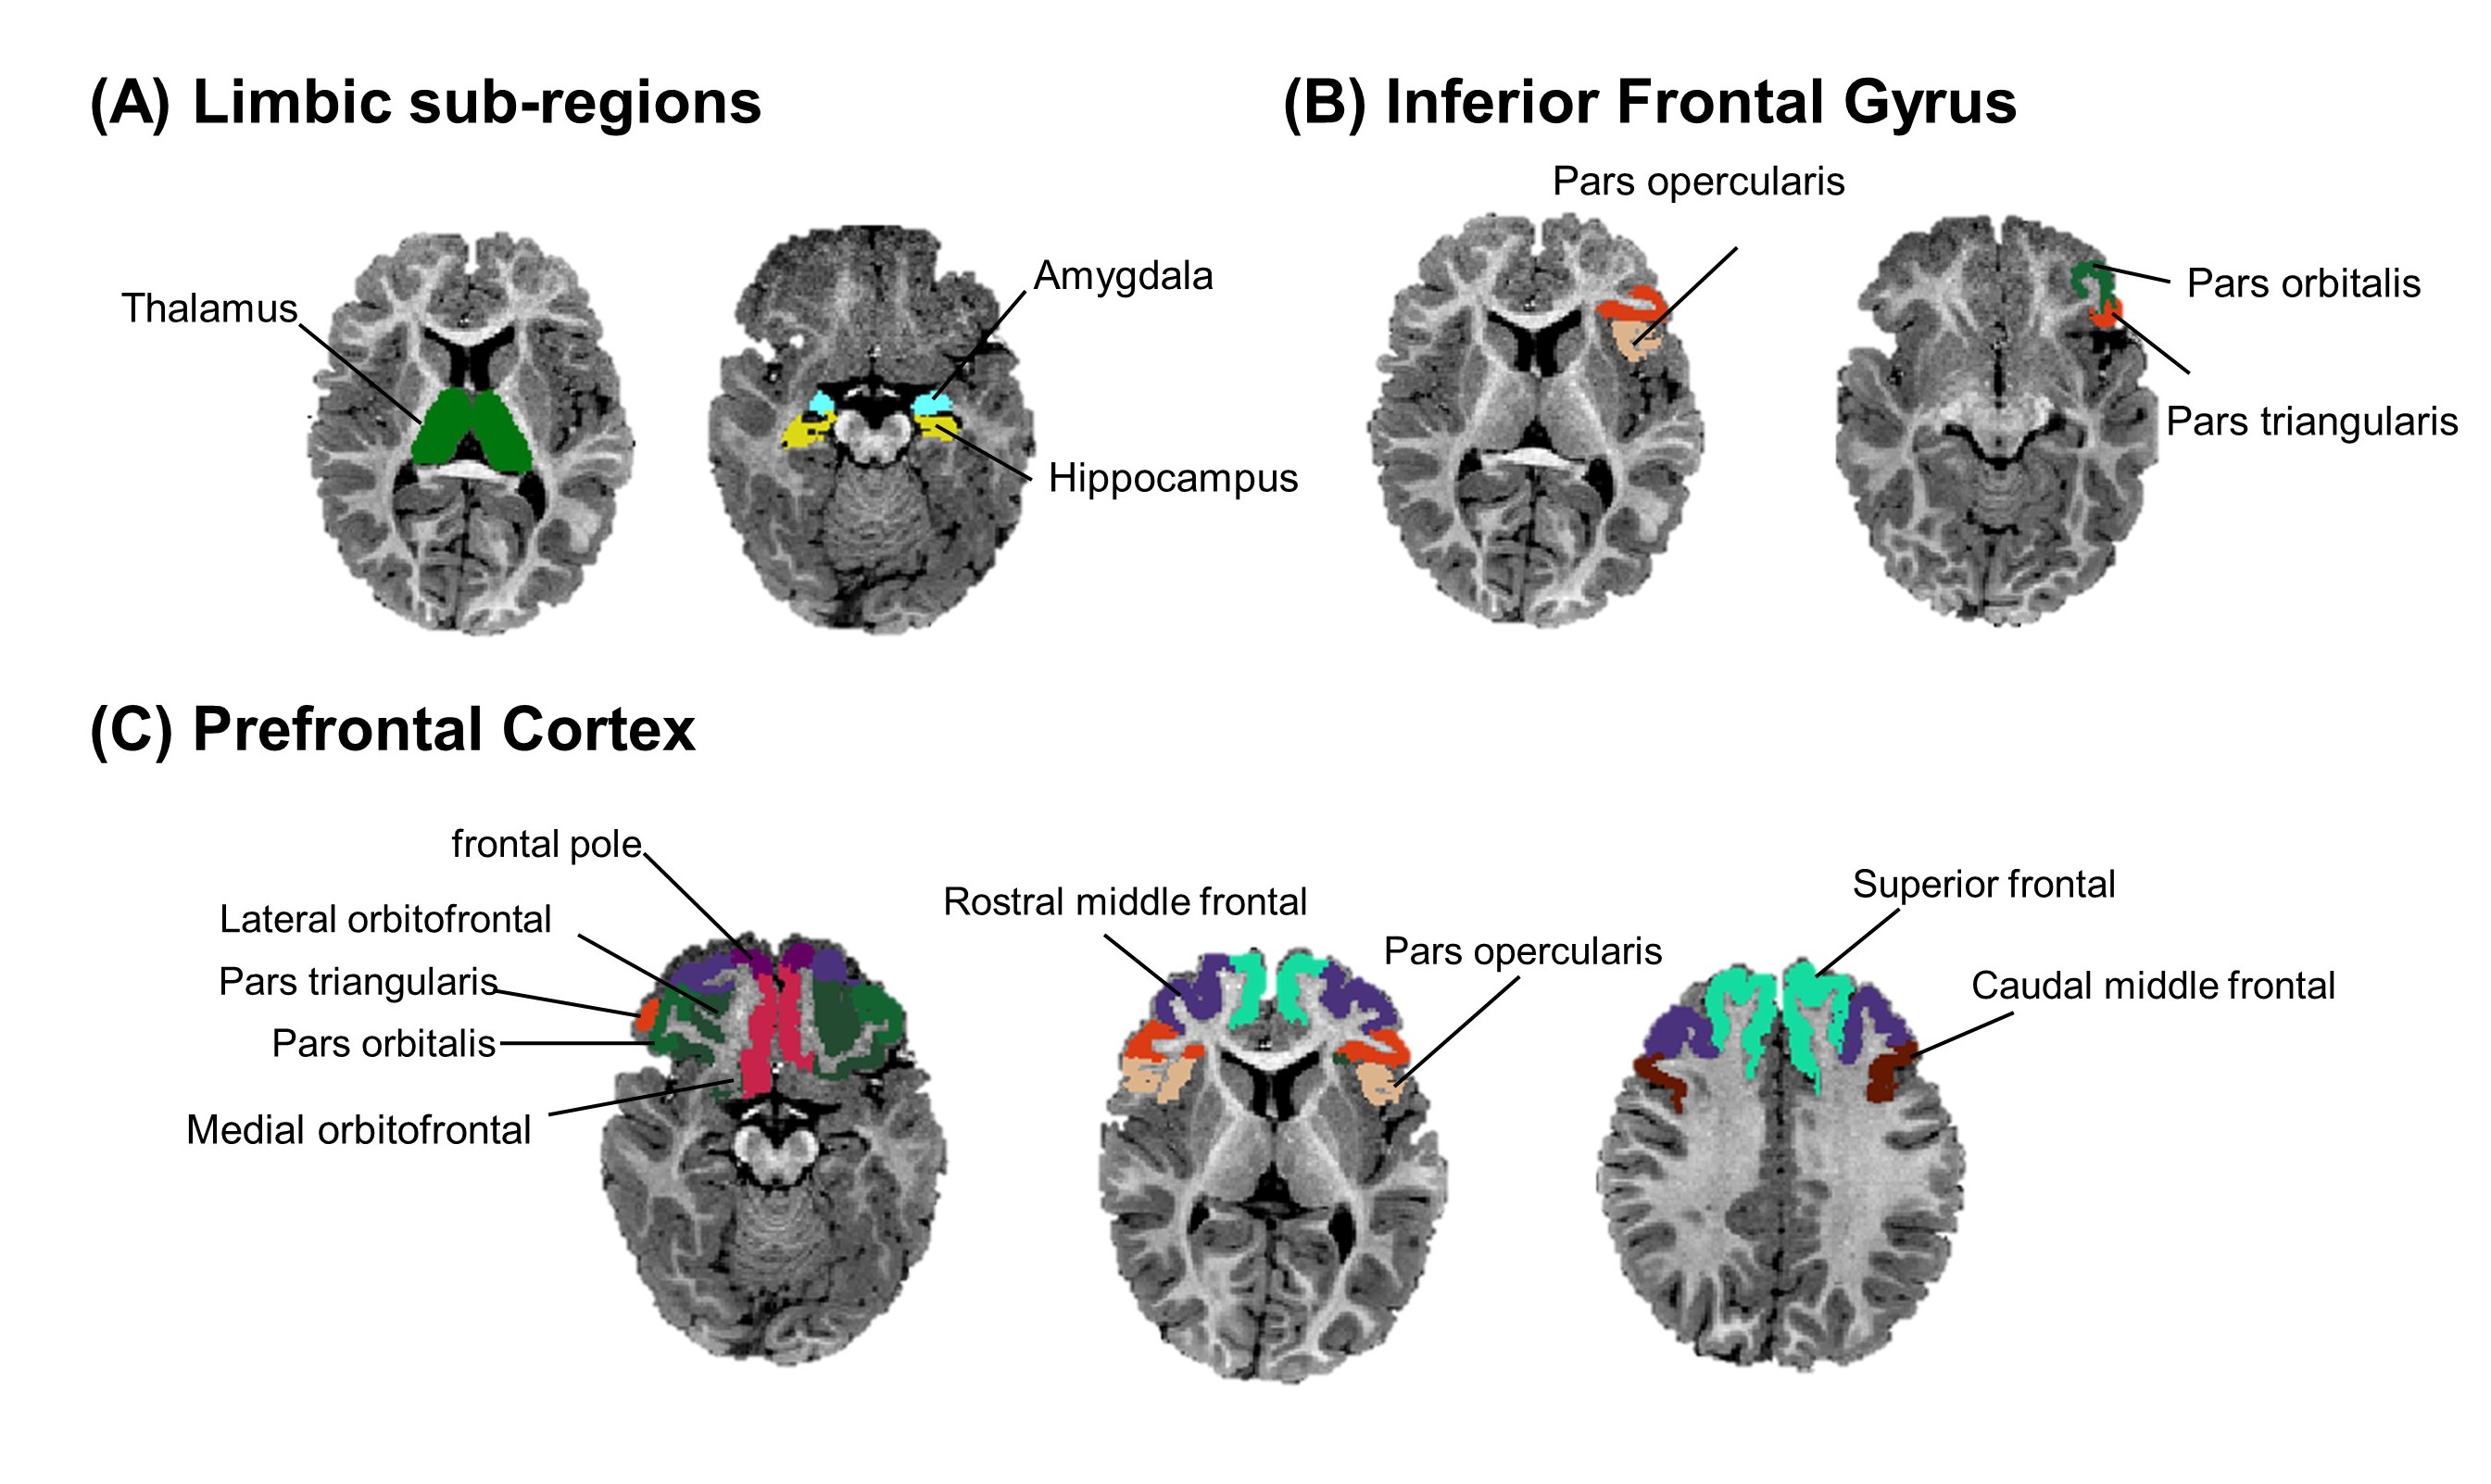
Data analysis: The T1w images of all infants were segmented using Infant FreeSurfer13. The following regional brain volumes were calculated based on the segmentation results: thalamus, amygdala, hippocampus, left inferior frontal gyrus, and prefrontal cortex. The left inferior frontal gyral volume was obtained by summing up the pars opercularis, pars orbitalis and pars triangularis. As for the prefrontal cortex volume, 9 brain regions were added together: frontal pole, lateral orbitofrontal, medial orbitofrontal, rostral middle frontal, superior frontal, caudal middle frontal, and the left inferior frontal gyrus.
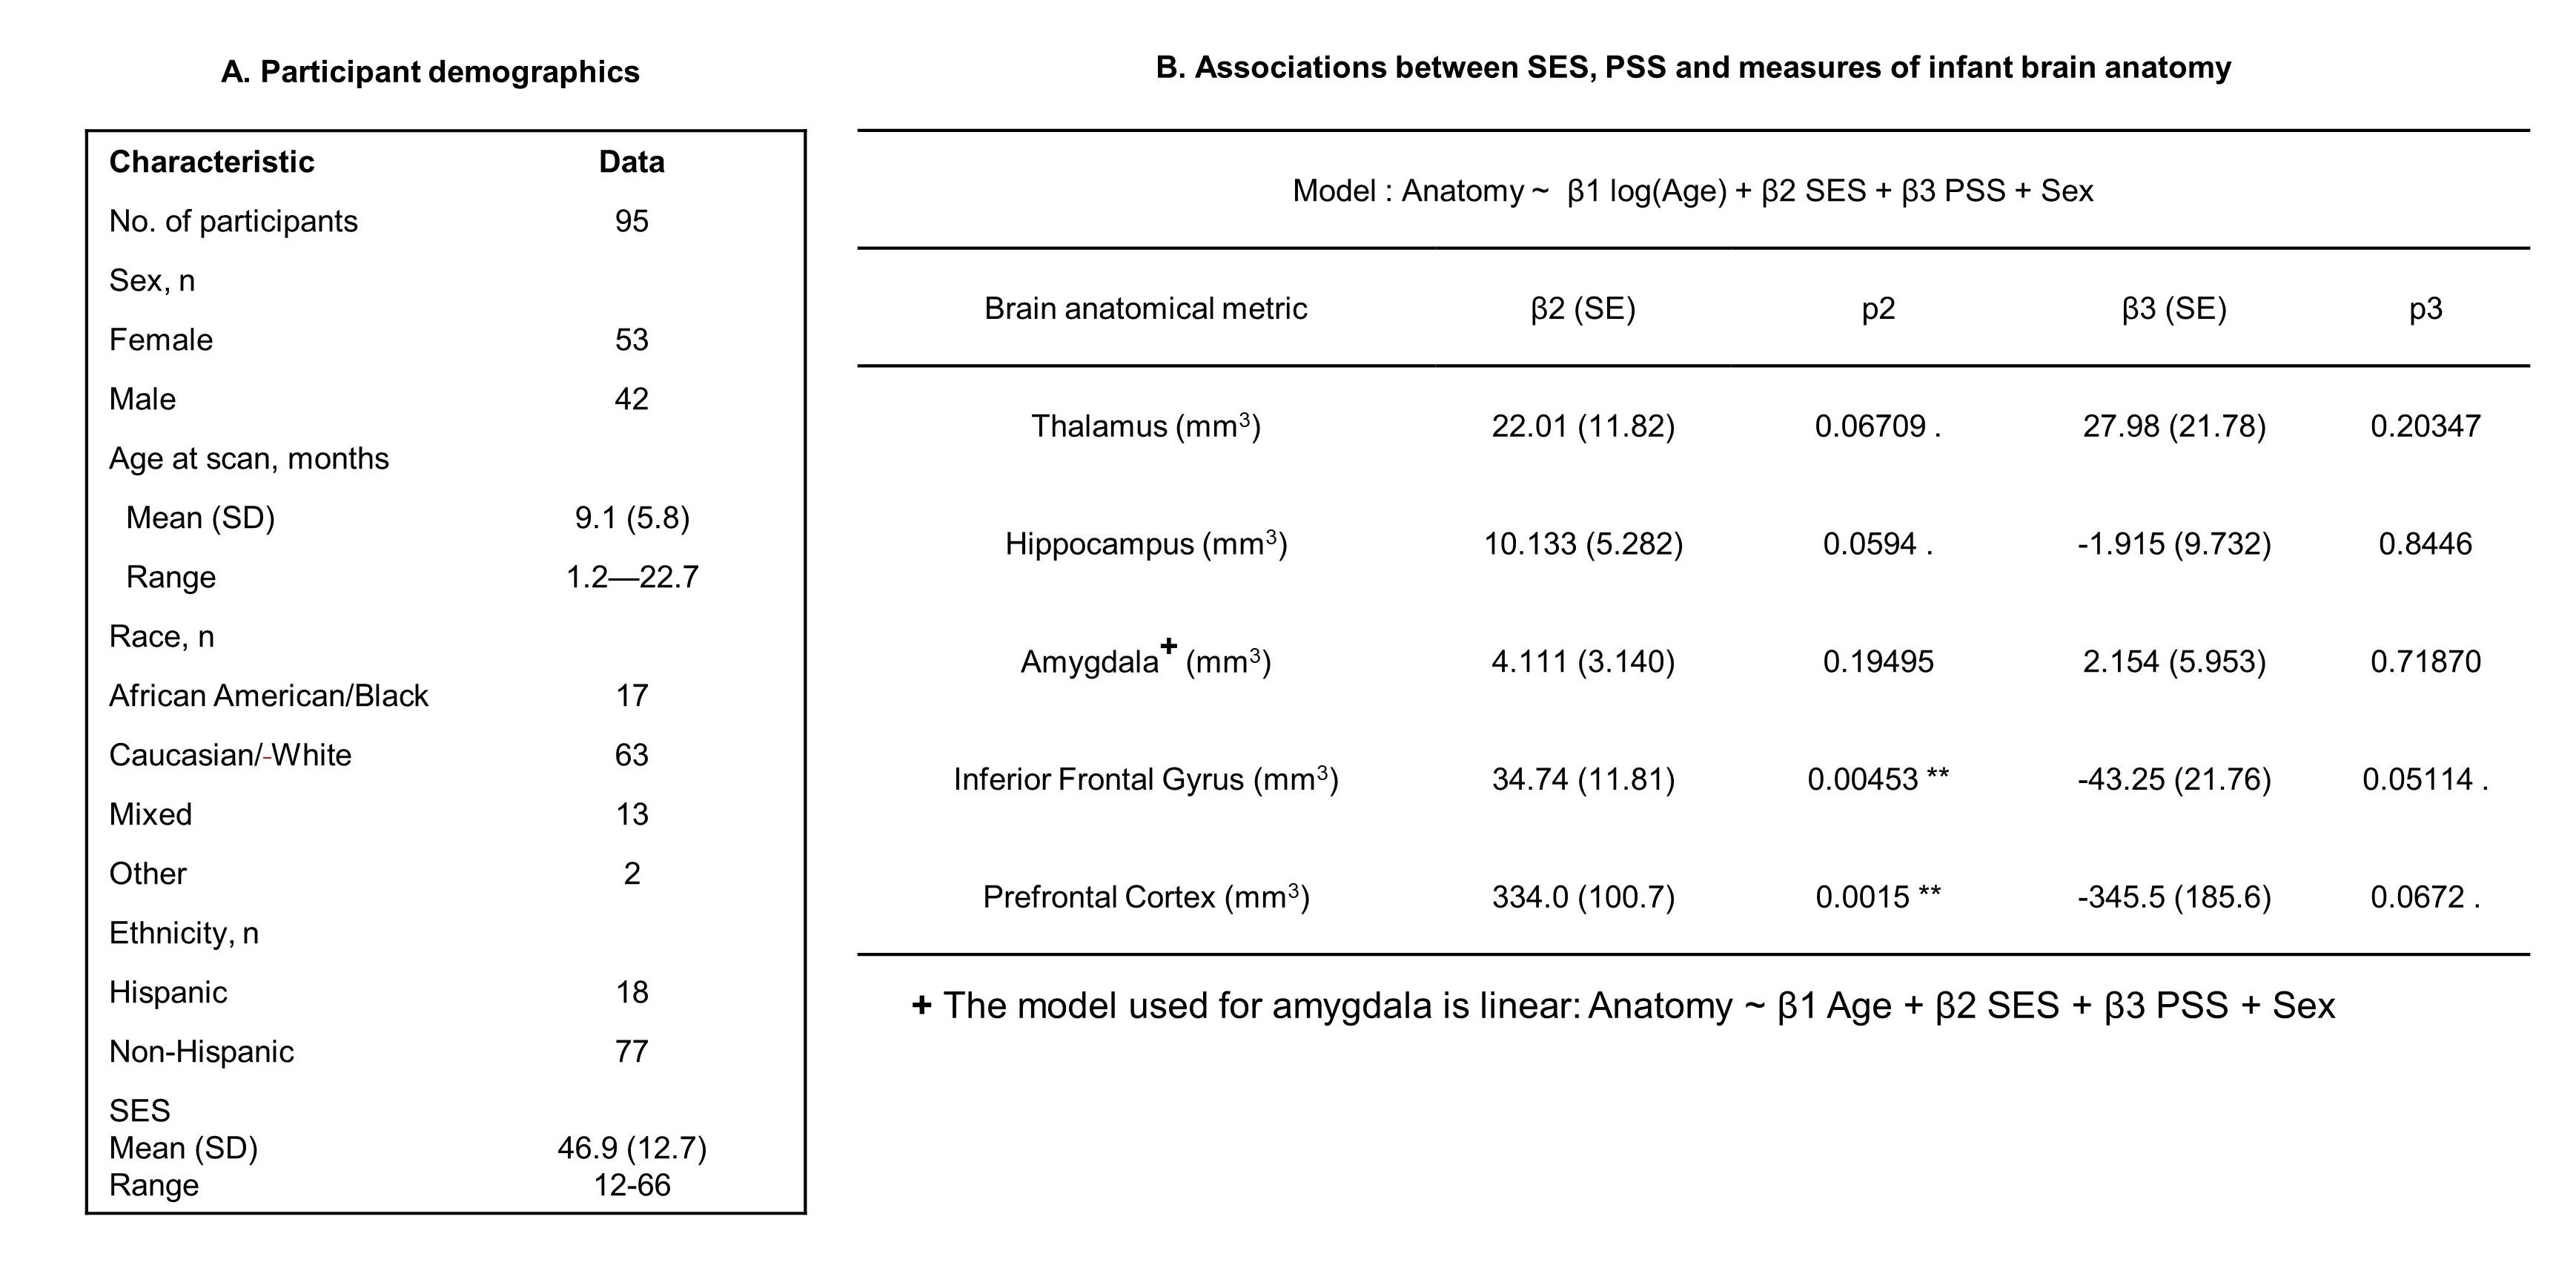
Statistical analyses were conducted using R to investigate the associations between brain volumetric measurements and age, SES, PSS, and sex using linear models. For a better fit, the amygdaloid volume did not utilize a log scale for the age parameter.
$$Volume (i.e., volumetric measure) ~ β1 log(Age) + β2 SES + β3 PSS + β4 Sex + β0$$
Results
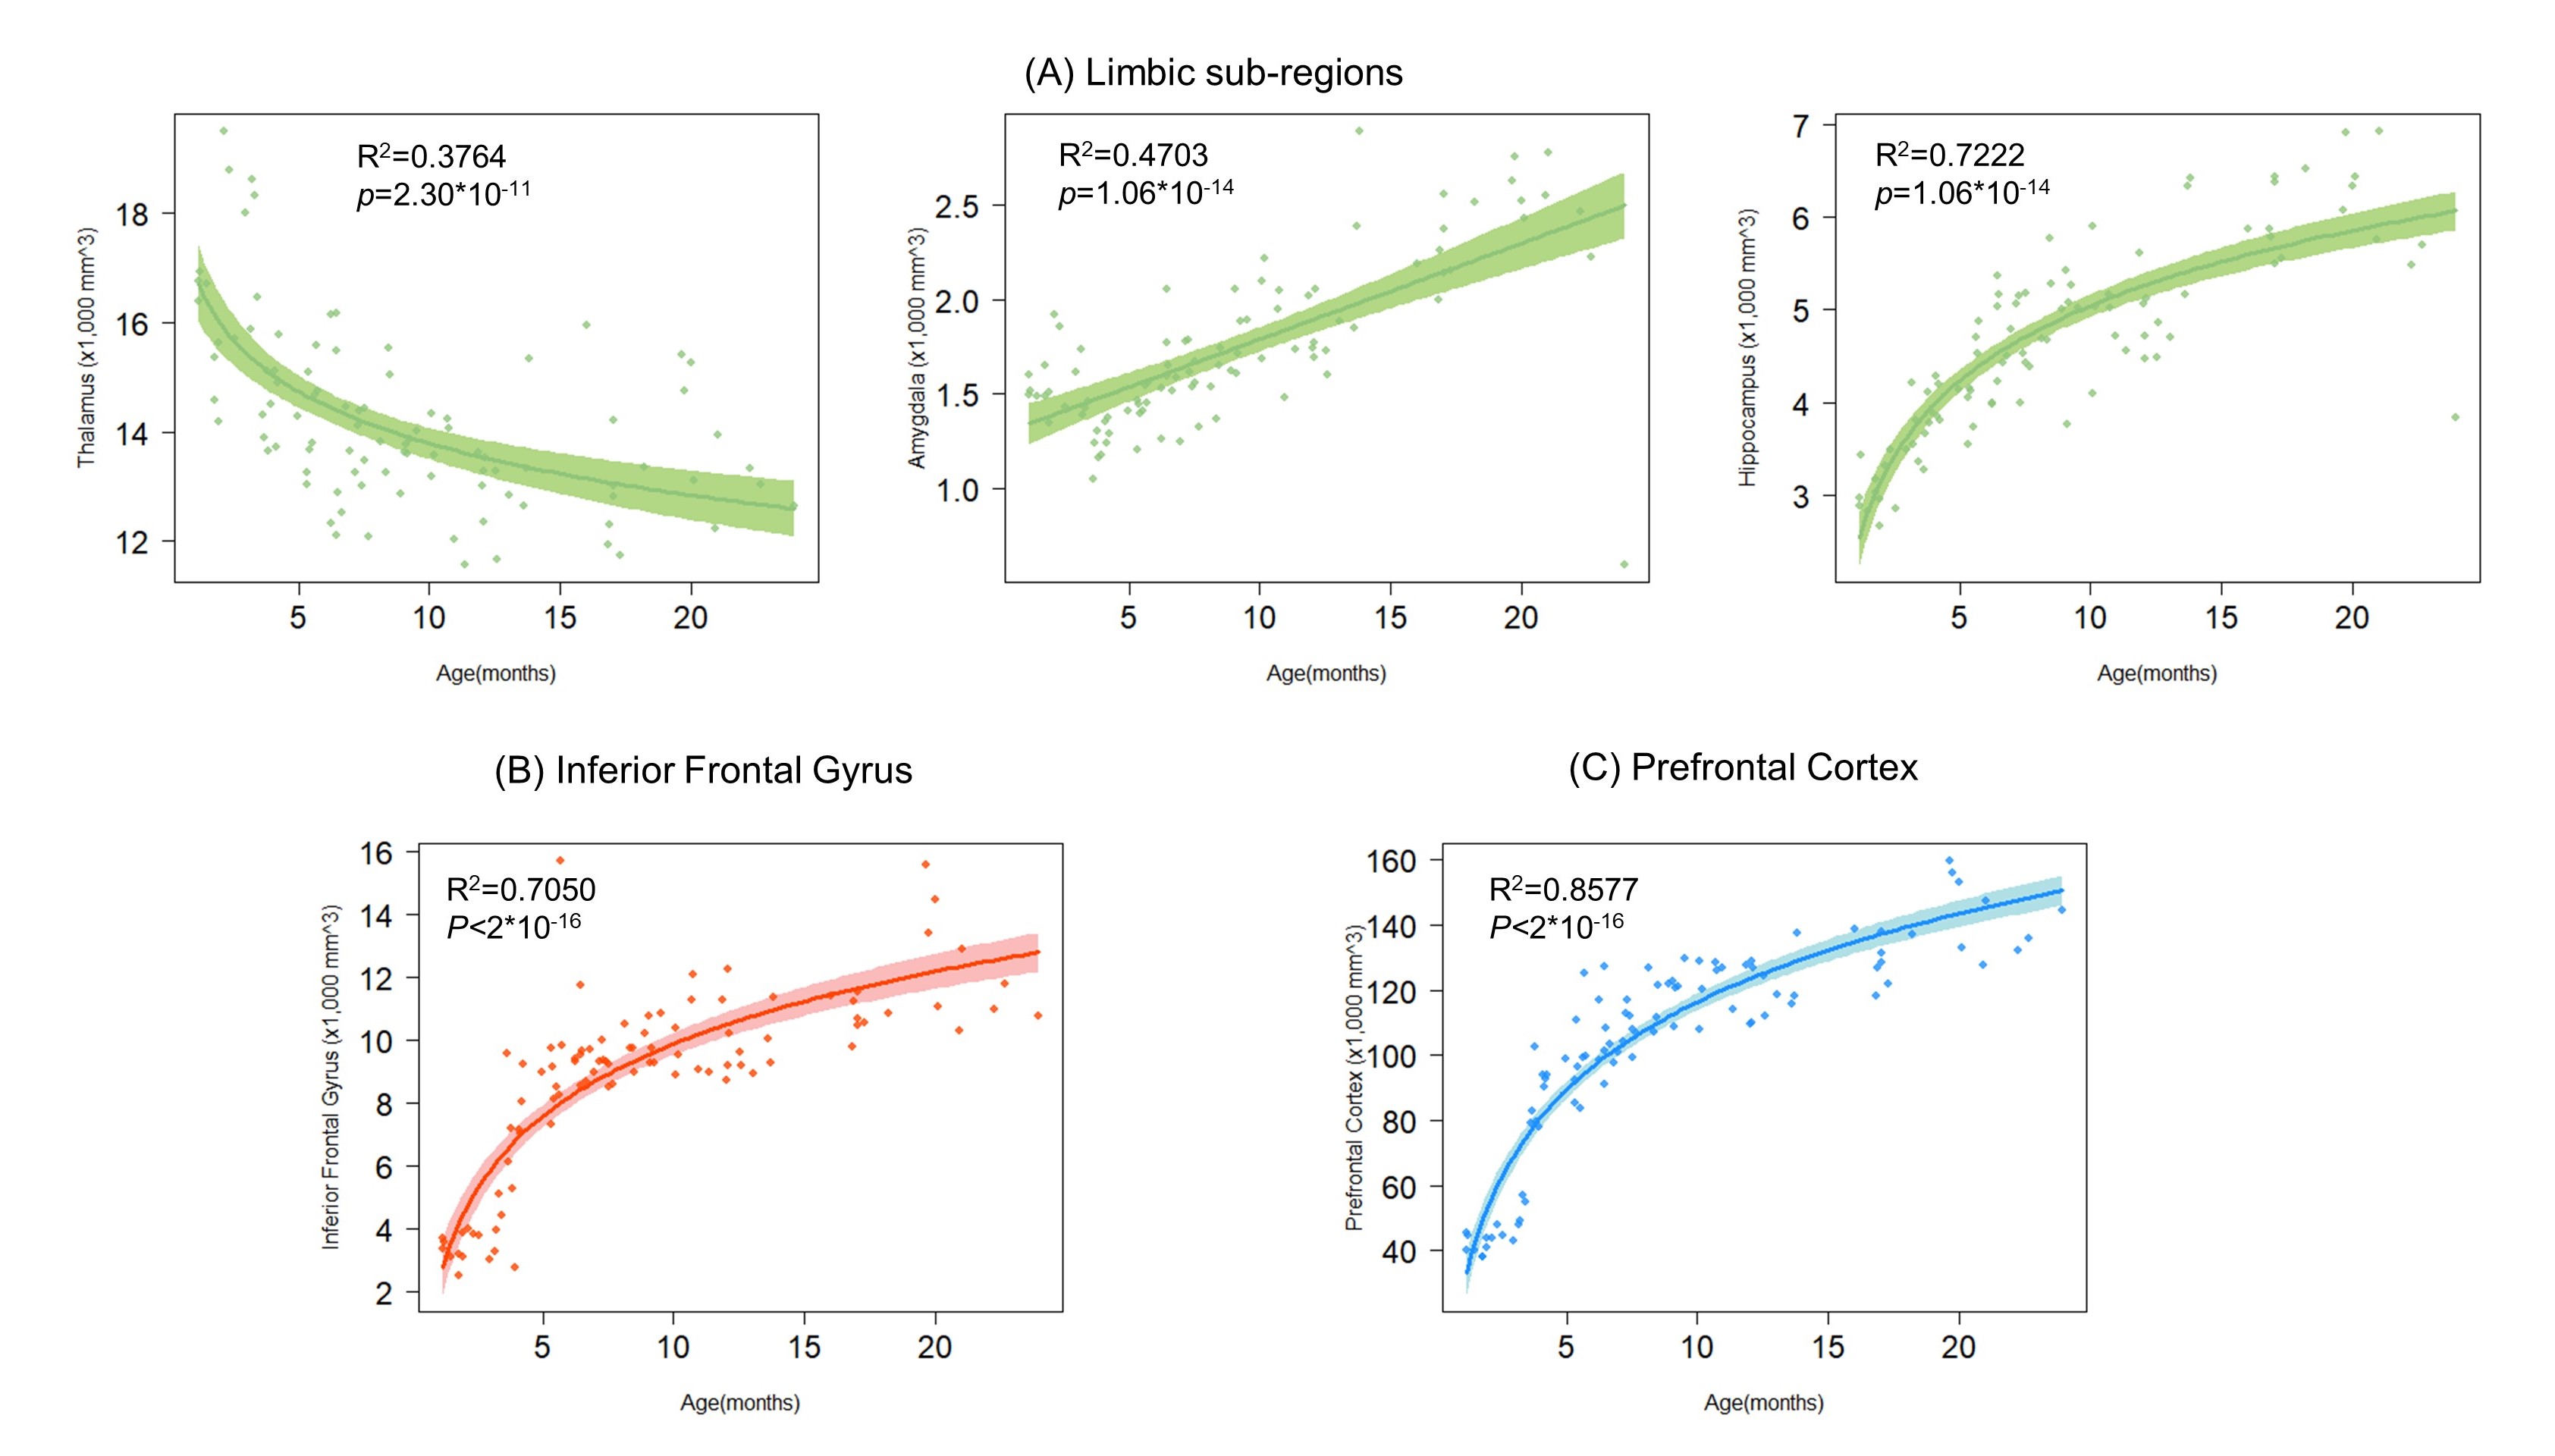
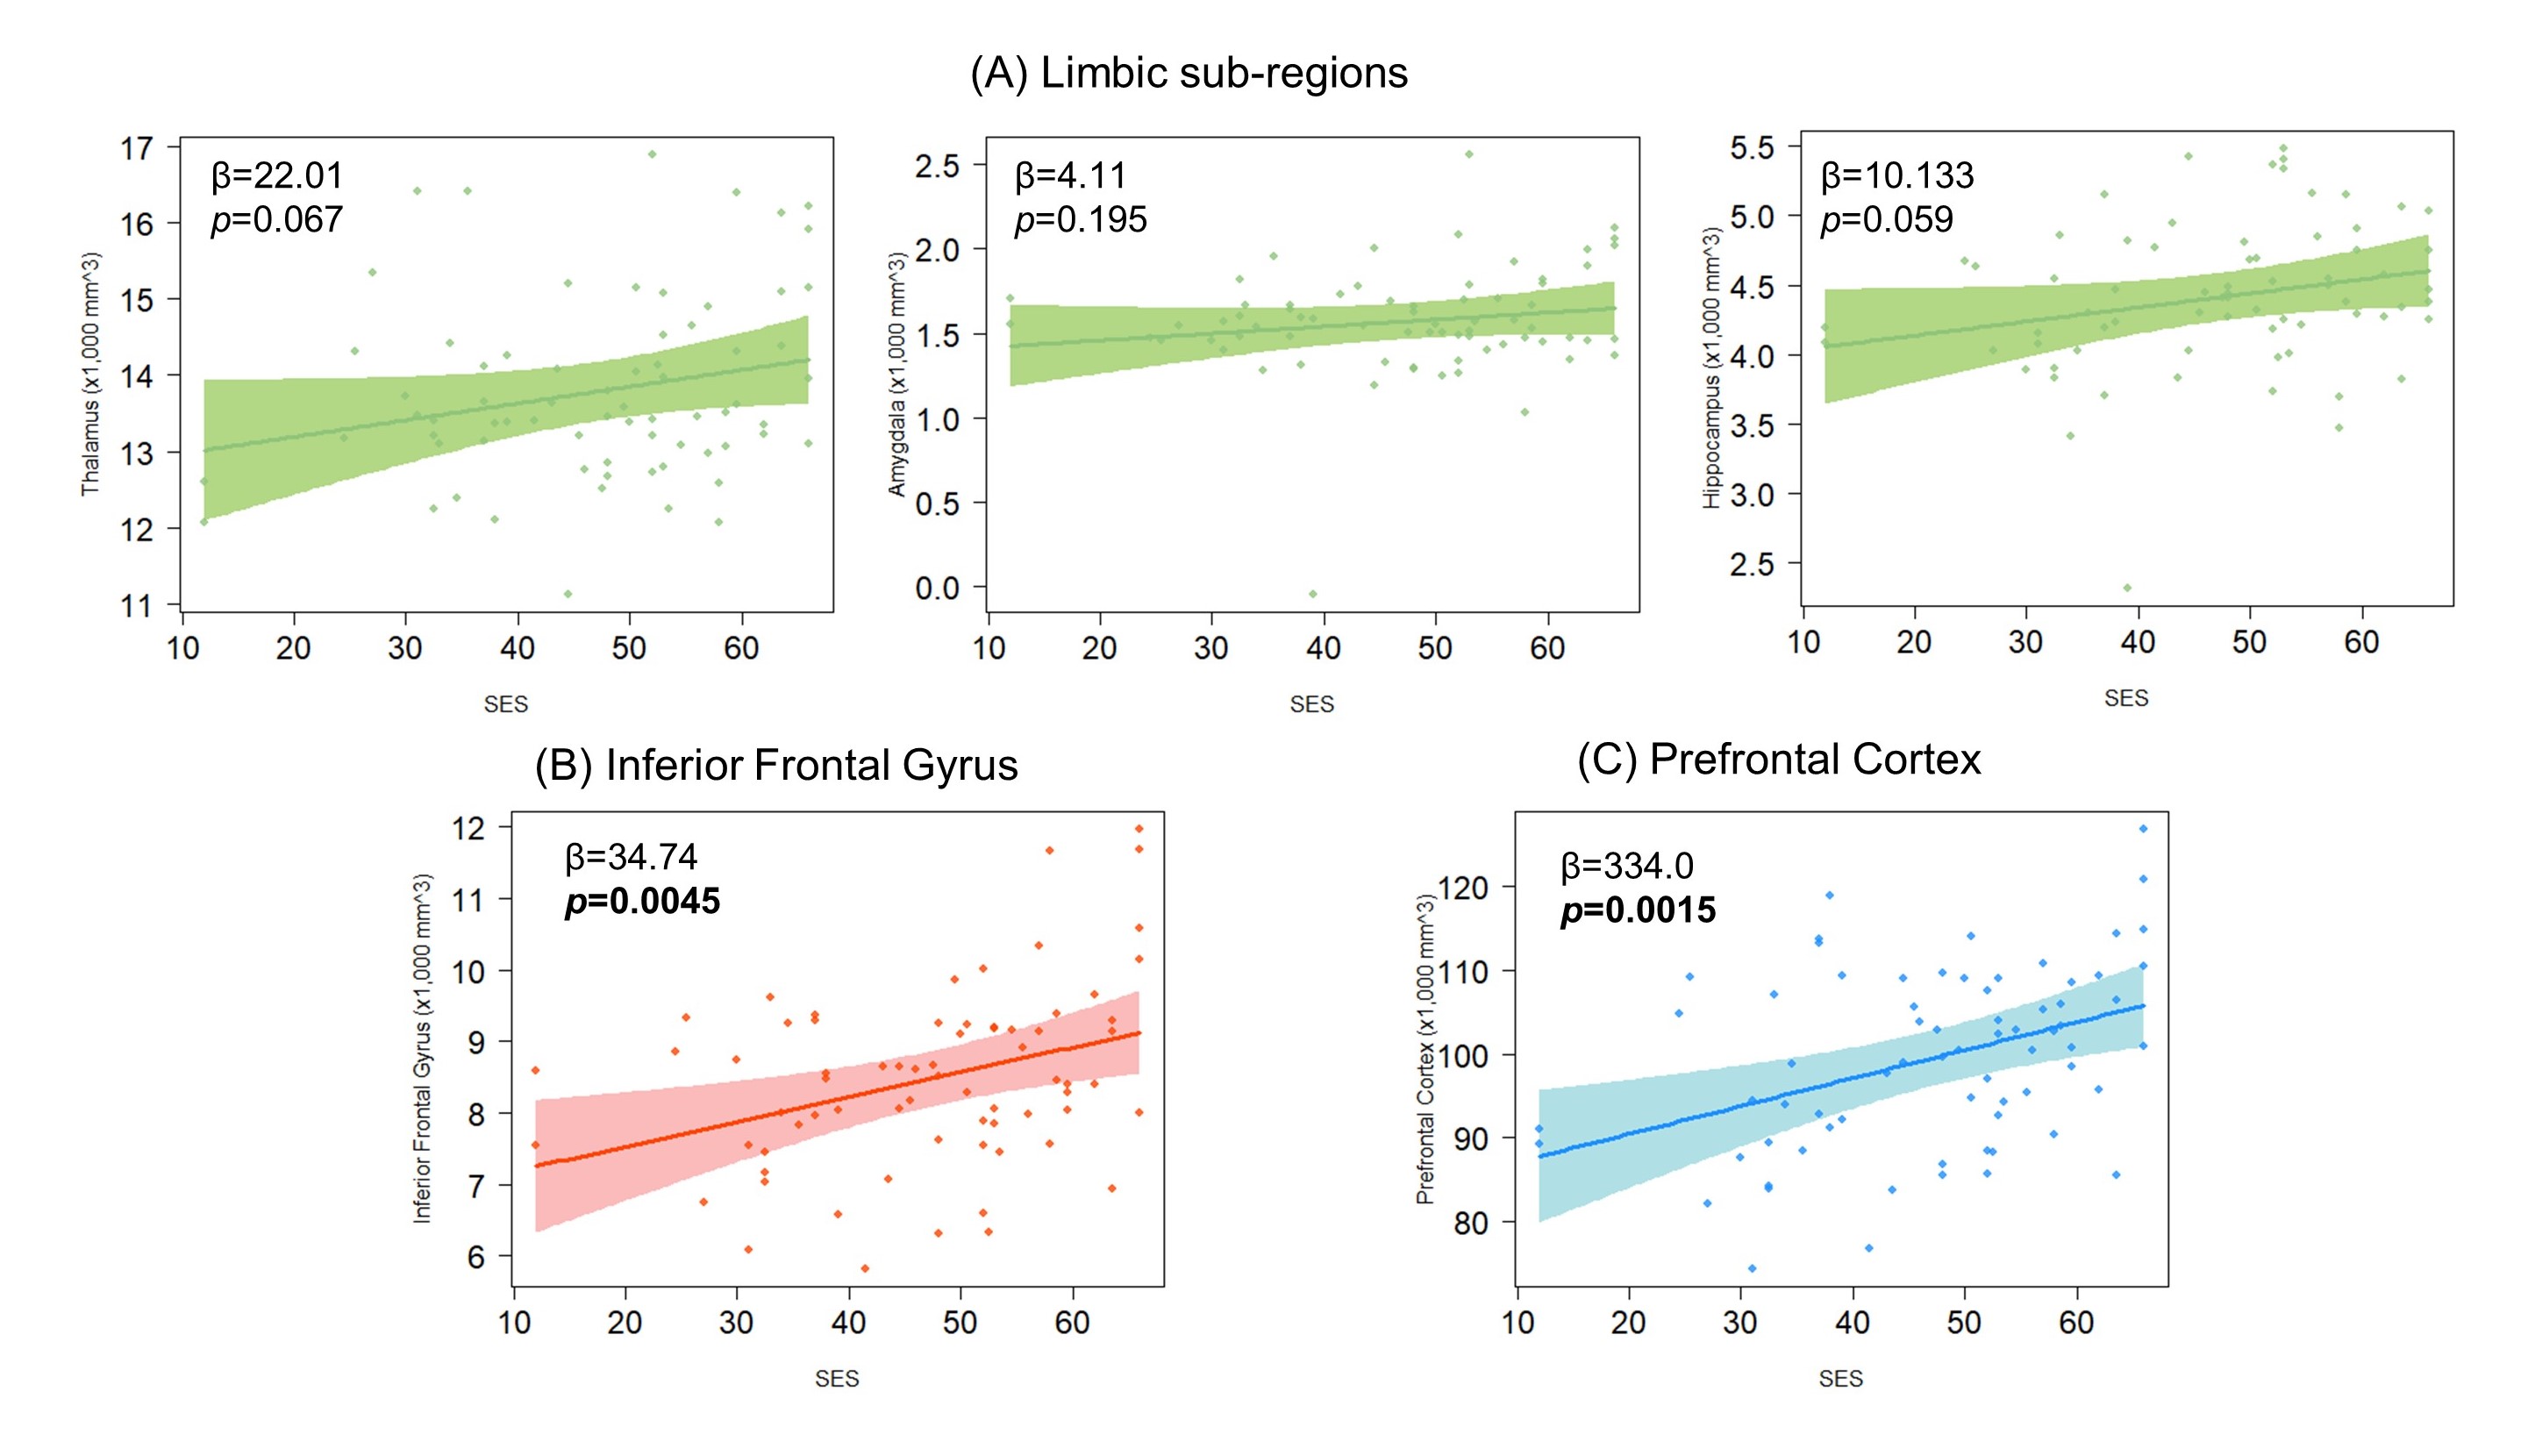
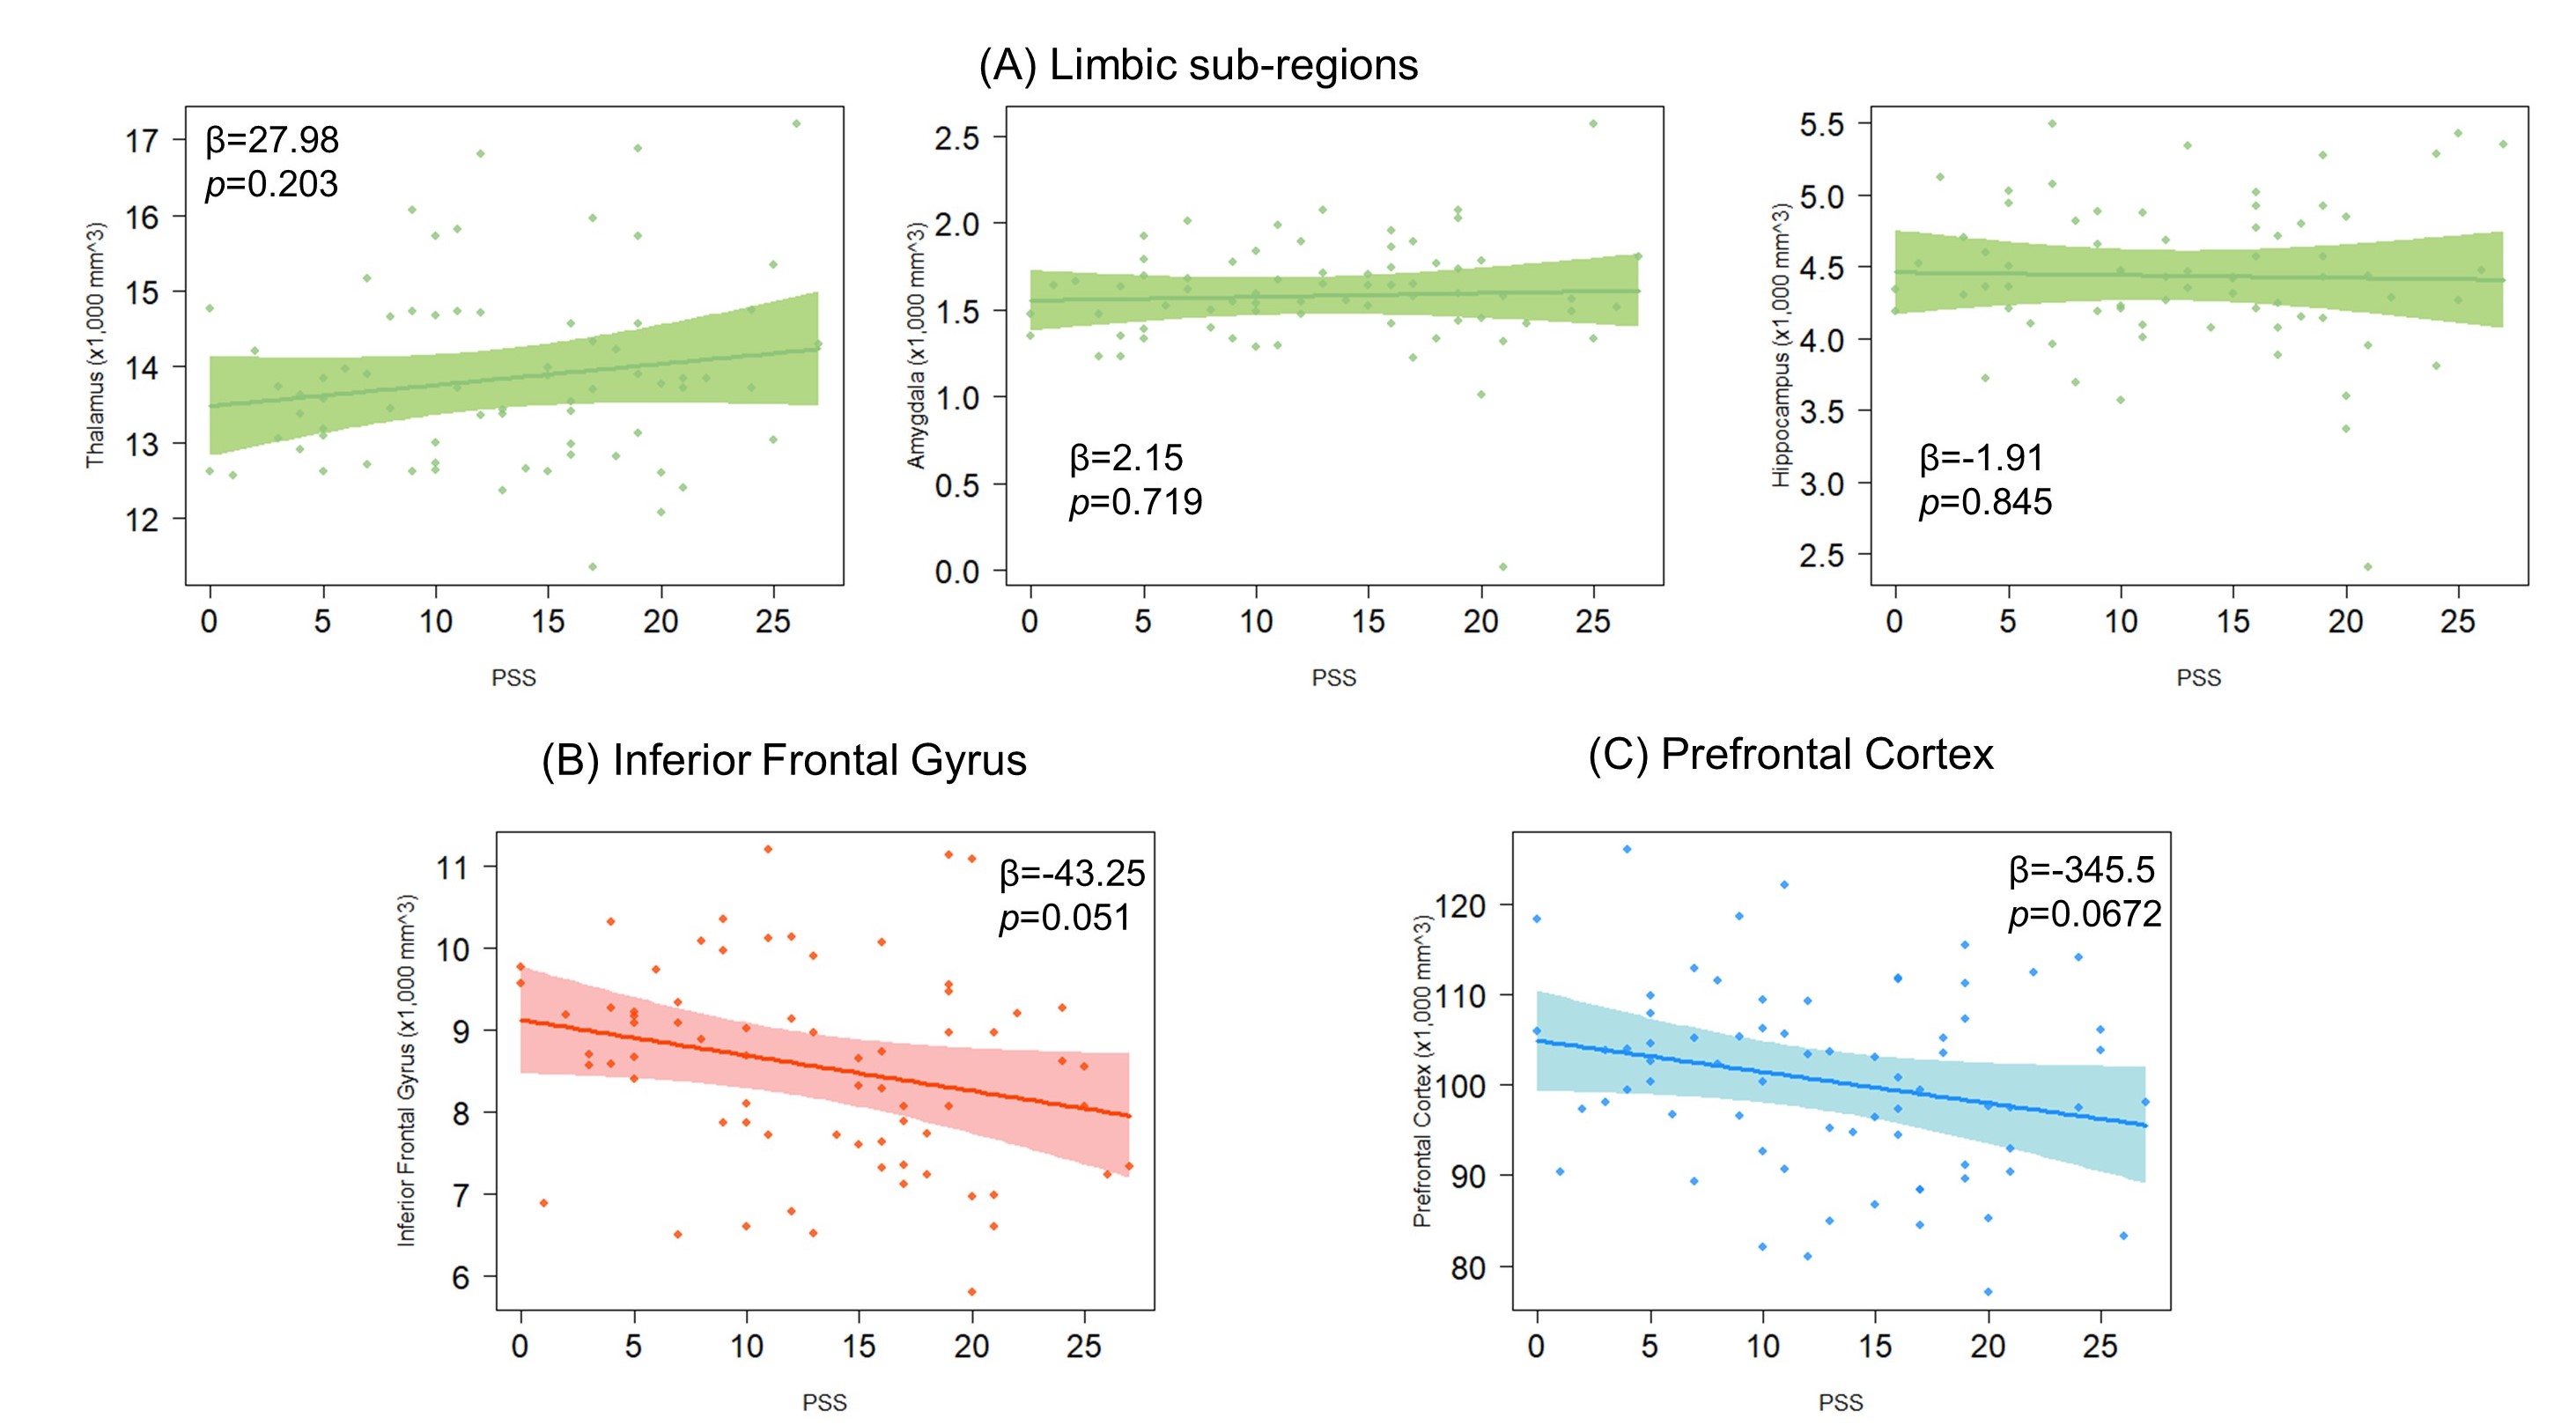
Figure 1 showcases a representative T1w infant at 12 months age, highlighting segmented brain regions including limbic sub-regions, the left inferior frontal gyrus, and the prefrontal cortex. Logarithmic scales were used to fit brain regions with age, except for the amygdala which used a linear scale (Fig. 2). It is evident that all brain regions exhibited positive associations (β>0) with SES (Fig. 3). Notably, significant positive correlations were observed between SES and the left inferior frontal gyrus (β1 = 34.74, p = 0.004) as well as the prefrontal cortex (β1 = 334.0, p = 0.001) (Figure 3B and C). Conversely, no significant correlations were found between regional brain volumes and PSS (Fig. 4). However, it's worth noting that a negative association (β<0) emerged between PSS and the hippocampus, the left inferior frontal gyrus, and the prefrontal cortex.Discussion and Conclusion
Our findings demonstrated that environmental factors such as parental stress and family SES can influence brain structural development as early as and throughout infancy. Consistent with previous literatures14, 15, regional brain volumes increased rapidly during this early developmental period. SES showed a significant impact on the left inferior frontal gyral and prefrontal cortical volumes, but less so on the thalamus and hippocampus with no impact on the amygdala. Despite the lack of significant correlation, lower perceived parental stress tends to be associated with higher inferior frontal gyral and prefrontal cortical volume. The analysis of the relationship between environmental factors and infant’s neurodevelopmental outcomes is under way.Acknowledgements
This study is funded by NIH R01MH092535, R01MH125333, R01EB031284, R01MH129981, R21MH123930 and P50HD105354.References
1. Ouyang M, Duboi J, et al. Delineation of early brain development from fetuses to infants with diffusion MRI and beyond. NeuroImage. 2019; 185: 836-850
2. Huang, H. Imaging the Infant Brain. in Oxford Research Encyclopedia of Psychology (Oxford University Press, 2022). doi:10.1093/acrefore/9780190236657.013.820
3. Brito N.H & Noble K.G. Socioeconomic status and structural brain development. Frontiers in Neuroscience. 2014; 8:276.
4. Hackman D.A, Farah M.J & Meaney M.J. Socioeconomic status and the brain: mechanistic insights from human and animal research. Nat Rev Neurosci. 2010; 11(9): 651-659.
5. Yang J, Liu H, et al. Regional gray matter volume mediates the relationship between family socioeconomic status and depression-related train in a young healthy sample. Cogn Affect Behav Neurosci. 2016; 16: 51-62.
6. McDermott C, Seidlitz J. et al. Longitudinally mapping childhood socioeconomic status associations with cortical and subcortical morphology. The Journal of Neuroscience. 2019; 39(8): 1365-1373.
7. Moriguchi Y & Shinohara I. Socioeconomic disparity in prefrontal development during early childhood. Scientific reports. 2019; 2585
8. Dennis E, Manza P. & Volkow N. Socioeconomic status, BMI, and brain development in children. Translational Psychiatry. 2022; 33.
9. Jednorog K, Altarelli I, et al. The influence of socioeconomic status on children’s brain structure. PLoS ONE. 2012; 7(8).
10. Tooley U, Bassett D, Mackey A. Environmental influences on the pace of brain development. Nature Neurosci Rev. 2021; 22: 372-384.
11. Hollingshead AB. Two factor index of social position. New Haven: Yale University Press. 1957.
12. Cohen S, Kamarck T, & Mermelstein R. A global measure of perceived stress. Journal of Health and Social Behavior. 1983; 24(4): 385-396.
13. Zöllei L, Iglesias J.E, Ou Y, Grant P.E & Fischl B, 2020. Infant FreeSurfer: An automated segmentation and surface extraction pipeline for T1-weighted neuroimaging data of infants 0–2 years. Neuroimage. 2020; 218: 116946.
14. Bethlehem R, Seidlitz J, et al. Brain charts for the human lifespan. Nature. 2022; 604: 525-533.
15. Mackes N.K, Golm D, et al. Early childhood deprivation is associated with alterations in adult brain structure despite subsequent environmental enrichment. PNAS. 2020; 114(1): 641-649.
Figures