2933
Visualization of Human Brain Cortical Layers Using Quantitative Parameter Mapping on a 3 Tesla Scanner1Institute of Biomedical Sciences, Tokushima University Graduate School, Tokushima, Japan, 2FUJIFILM Healthcare Corporation, Tokyo, Japan
Synopsis
Keywords: Gray Matter, Microstructure
Motivation: To observe the cortical layer in detail using MRI.
Goal(s): To evaluate the visualization of cortical layers in humans using quantitative parameter mapping (QPM)-MRI.
Approach: Using T1, T2, and R1·R2* derived from QPM-MRI, each measured value in the motor cortex and the putamen was compared. Additionally, the line profile curves of the cortex for R1, R2* and R1·R2* images were plotted.
Results: There are significant differences between the motor cortex and the putamen in T1 and T2* (P < 0.05). Visualization using R1·R2* leads to emphasis on the susceptibility effect of iron and myelin in addition to T1 differences.
Impact: Visualization using R1·R2* derived from QMP-MRI leads to emphasis on the susceptibility effect of iron and myelin in addition to T1 differences based on myelin content in the cortex.
INTRODUCTION
The cerebral cortex which contains many neurons has a structure of approximately six layers. The differences in the size, shape, and density of the arranged neurons can be distinguished on a microscopic scale. The BigBrain 3D atlas of cortical layers is segmented using a convolutional neural network from a 3D histological atlas of the human brain at 20-micrometer isotropic resolution 1. MRI approaches have been performed using MR imaging with ultra-high-spatial resolution at a high magnetic field scanner and quantitative MRI 2. Quantitative MRI can determine different MR parameters (e.g., relaxation times) to determine image contrast. Previous studies on the contribution of myelin and iron to different relaxation time constants showed that maps of R1 (= 1/T1) values are mainly dominated by myelin concentration, whereas R2* (= 1/T2*) are particularly sensitive to iron in deep gray matter (GM) and both myelin and iron in cortical GM 3, 4. We developed a novel myelin visualization method alternative to conventional T1 weighted/T2 weighted (T1w/T2w) ratio mapping 5. Our method may acquire contrast depending on the contribution of myelin and iron in the cortex. The purpose of this study is to evaluate the visualization of cortical layers in humans using quantitative parameter mapping (QPM)-MRI.METHODS
QPM-MRI was performed on six healthy volunteers (two men and four women; age range, 22-25 years; mean age, 22.9 ± 1.2 years). On a 3 Tesla MR scanner system (FUJIFILM Healthcare Corp.), a QPM dataset was acquired with three-dimensional partially radio frequency-spoiled steady-state gradient-echo (3D-RSSG) methods. The imaging parameters were echo times (TEs), 4.3-25.5 ms (ΔTE, 5.3 ms); repetition times, 20-32 ms; flip angles (FAs), 10 and 40 degrees. R1·R2* product image was calculated from the 3D-RSSG dataset for QPM. In addition, conventional T1w images were acquired using the 3D-RSSG method: the imaging parameters were TE, 6.2 ms; TR, 12 ms; FA, 18 degrees. Figure 1 shows the region-of-interest (ROI) settings used in this study. ROI was set as the motor cortex and the putamen in the brain of each subject. Measurement of T1, T2*, and R1·R2* values was carried out. A comparison was made between the motor cortex and the putamen in each measured value using the nonparametric Wilcoxon signed-rank test (P value of <0.05 was considered statistically significant). Additionally the line profile curve was plotted in a setting at verticality to the cortex for R1, R2* and R1·R2* images.RESULTS
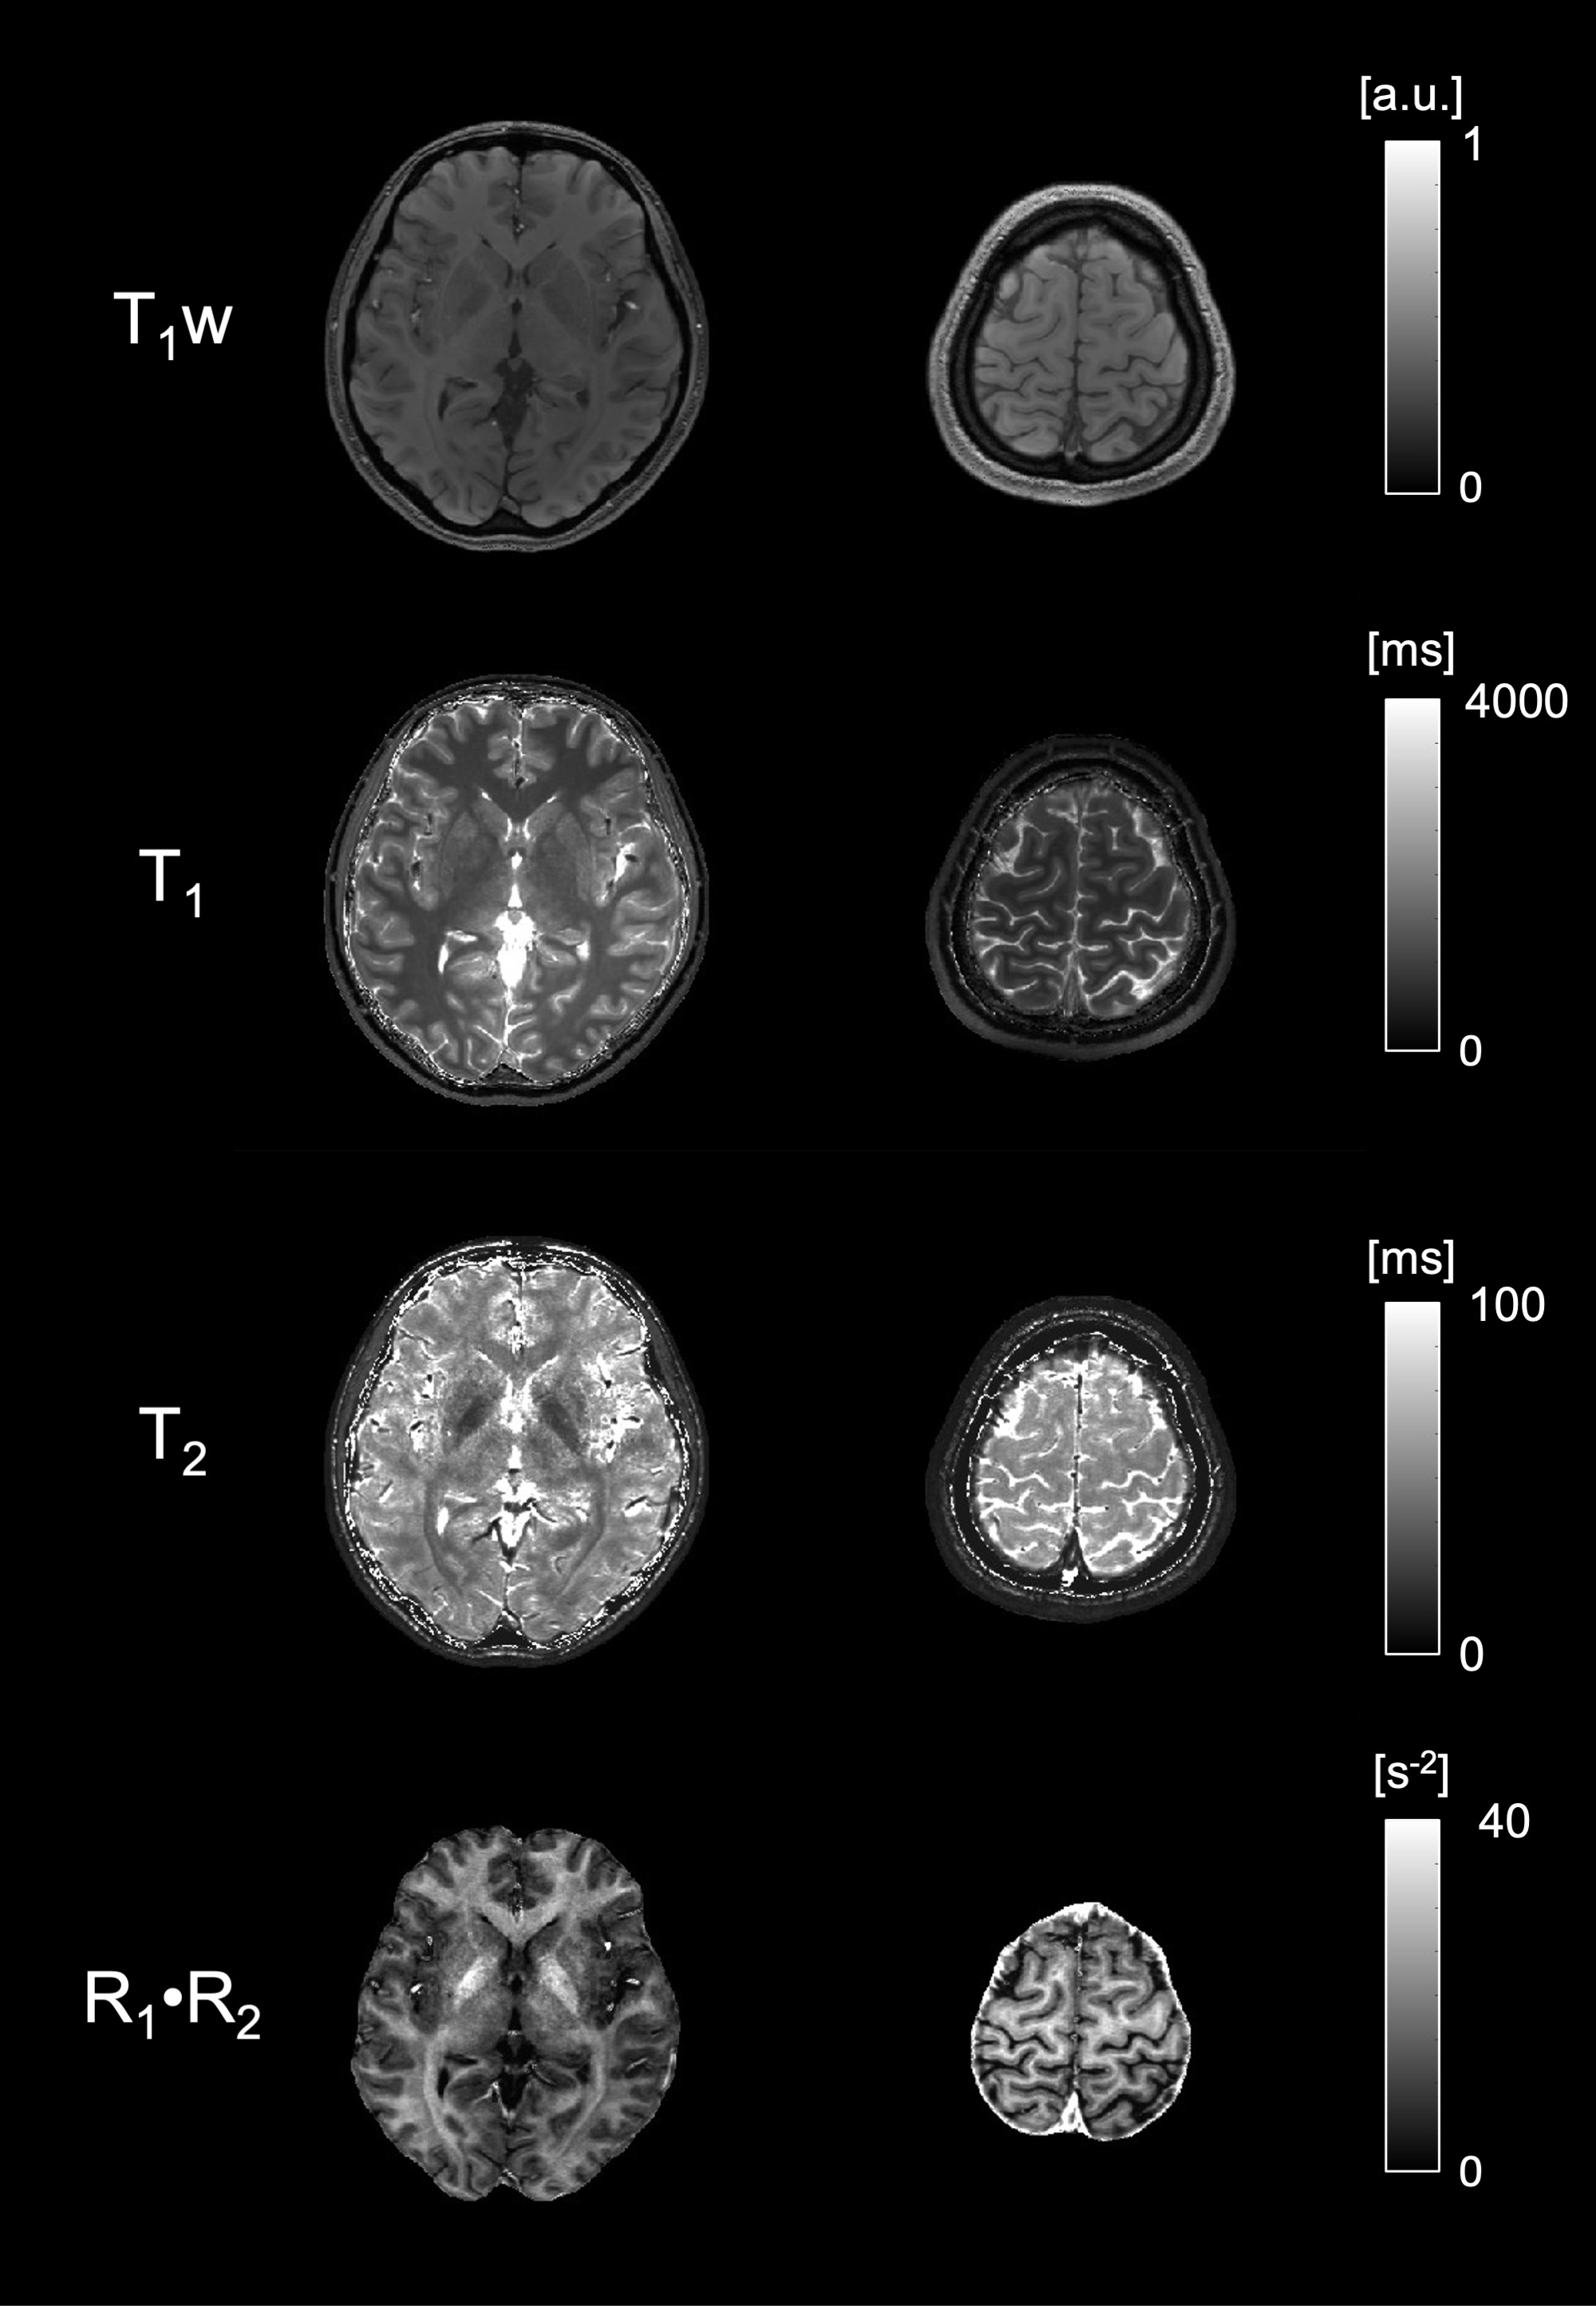
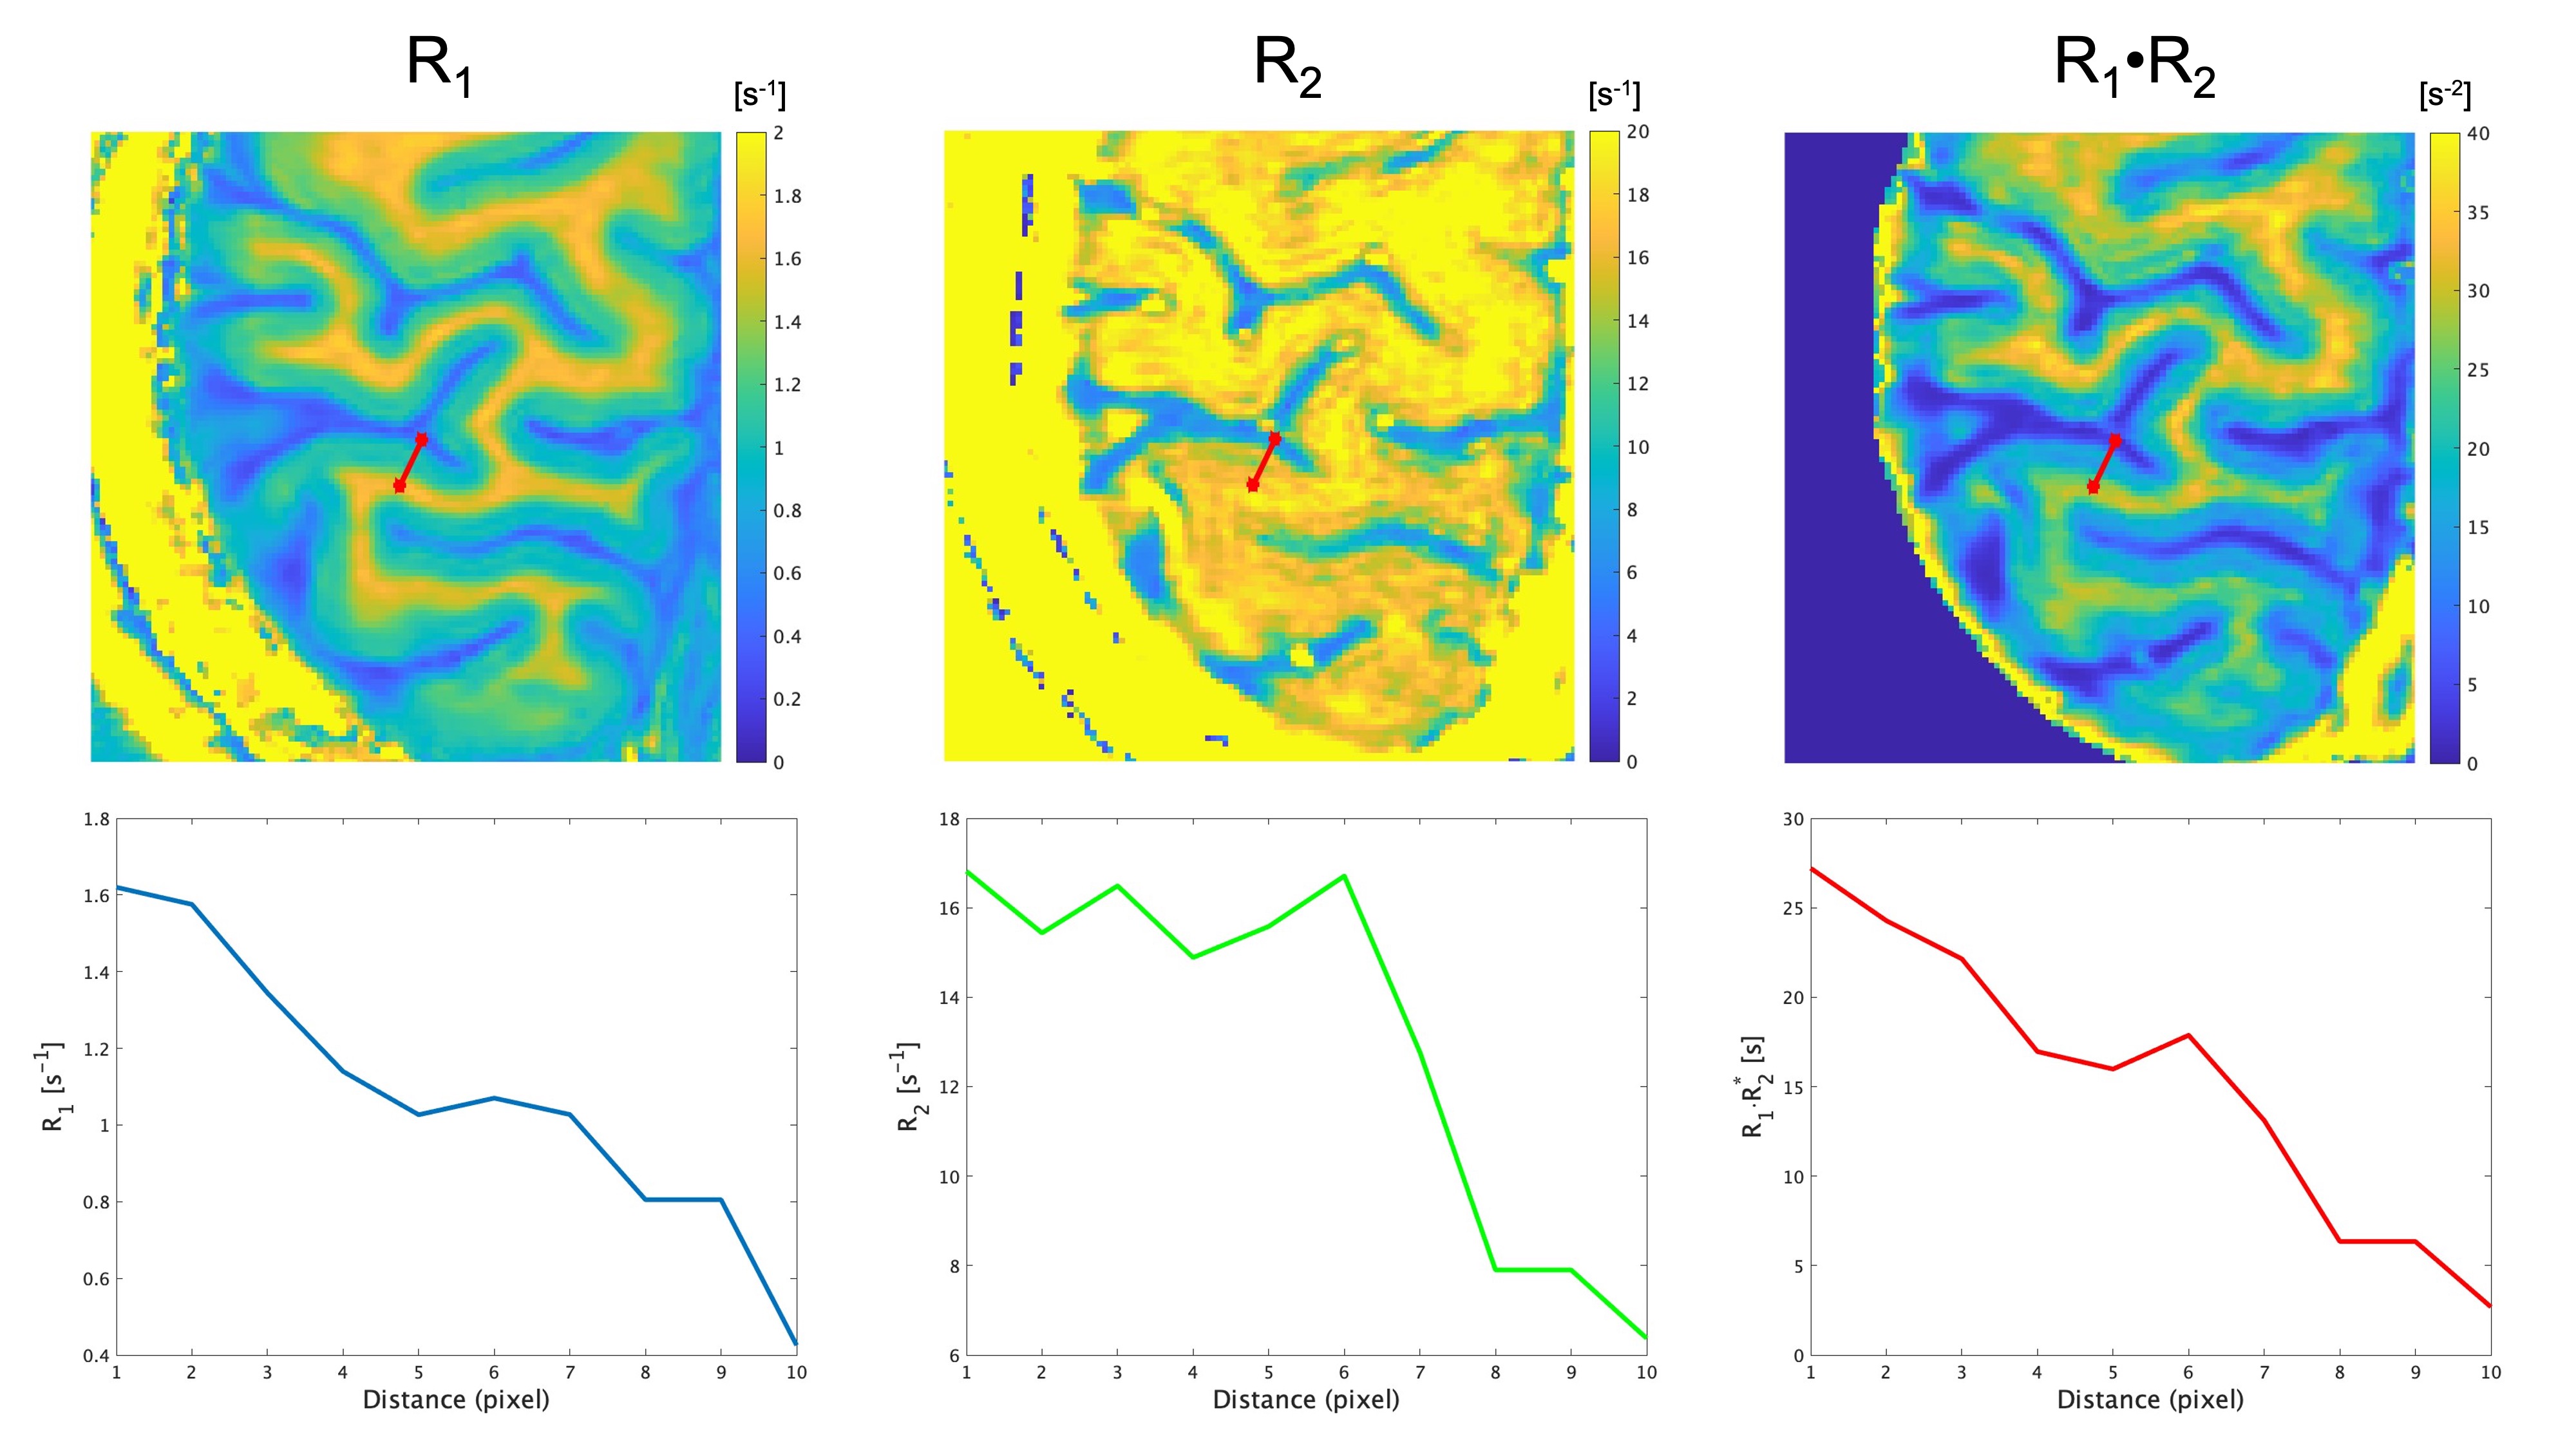
Figure 2 shows the relationship between the motor cortex and the putamen in T1, T2*, and R1·R2* values. There are significant differences between the motor cortex and the putamen in T1 and T2* (P < 0.05). There was no significant difference between the motor cortex and the putamen in R1·R2* values (P = 0.32). Figure 3 shows T1w image, T1, T2*, and R1·R2* maps of the basal ganglia and parietal lobe levels for a representative subject. Figure 4 shows R1, R2*, and R1·R2* images and each line profile curve.DISCUSSION
By comparing deep and cortical GM (Fig. 2), we demonstrated that T1 depends on myelin concentration and T2* myelin and iron in cortical GM. Visualization using R1·R2* leads to emphasis on the susceptibility effect of iron and myelin in addition to T1 differences based on myelin content in the cortex.CONCLUSION
R1·R2* derived from QPM makes it possible to observe cortical structure in more detail.Acknowledgements
This study was partly supported by JSPS KAKENHI [grant number 20K07997].References
- Wagstyl K, Larocque S, Cucurull G, et al. BigBrain 3D atlas of cortical layers: Cortical and laminar thickness gradients diverge in sensory and motor cortices. PLoS Biol. 2020;18(4):e3000678.
- Trampel R, Bazin PL, Pine K, et al. In-vivo magnetic resonance imaging (MRI) of laminae in the human cortex. Neuroimage. 2019;197:707-715.
- Wharton S, Bowtell R. Fiber orientation-dependent white matter contrast in gradient echo MRI. Proc Natl Acad Sci U S A. 2012;109(45):18559-64.
- Stüber C, Morawski M, Schäfer A, et al. Myelin and iron concentration in the human brain: a quantitative study of MRI contrast. Neuroimage. 2014;93 Pt 1:95-106.
- Kanazawa Y, Harada M, Taniguchi Y, et al. Myelin-weighted imaging derived from quantitative parameter mapping. Eur J Radiol. 2022;156:110525.
Figures
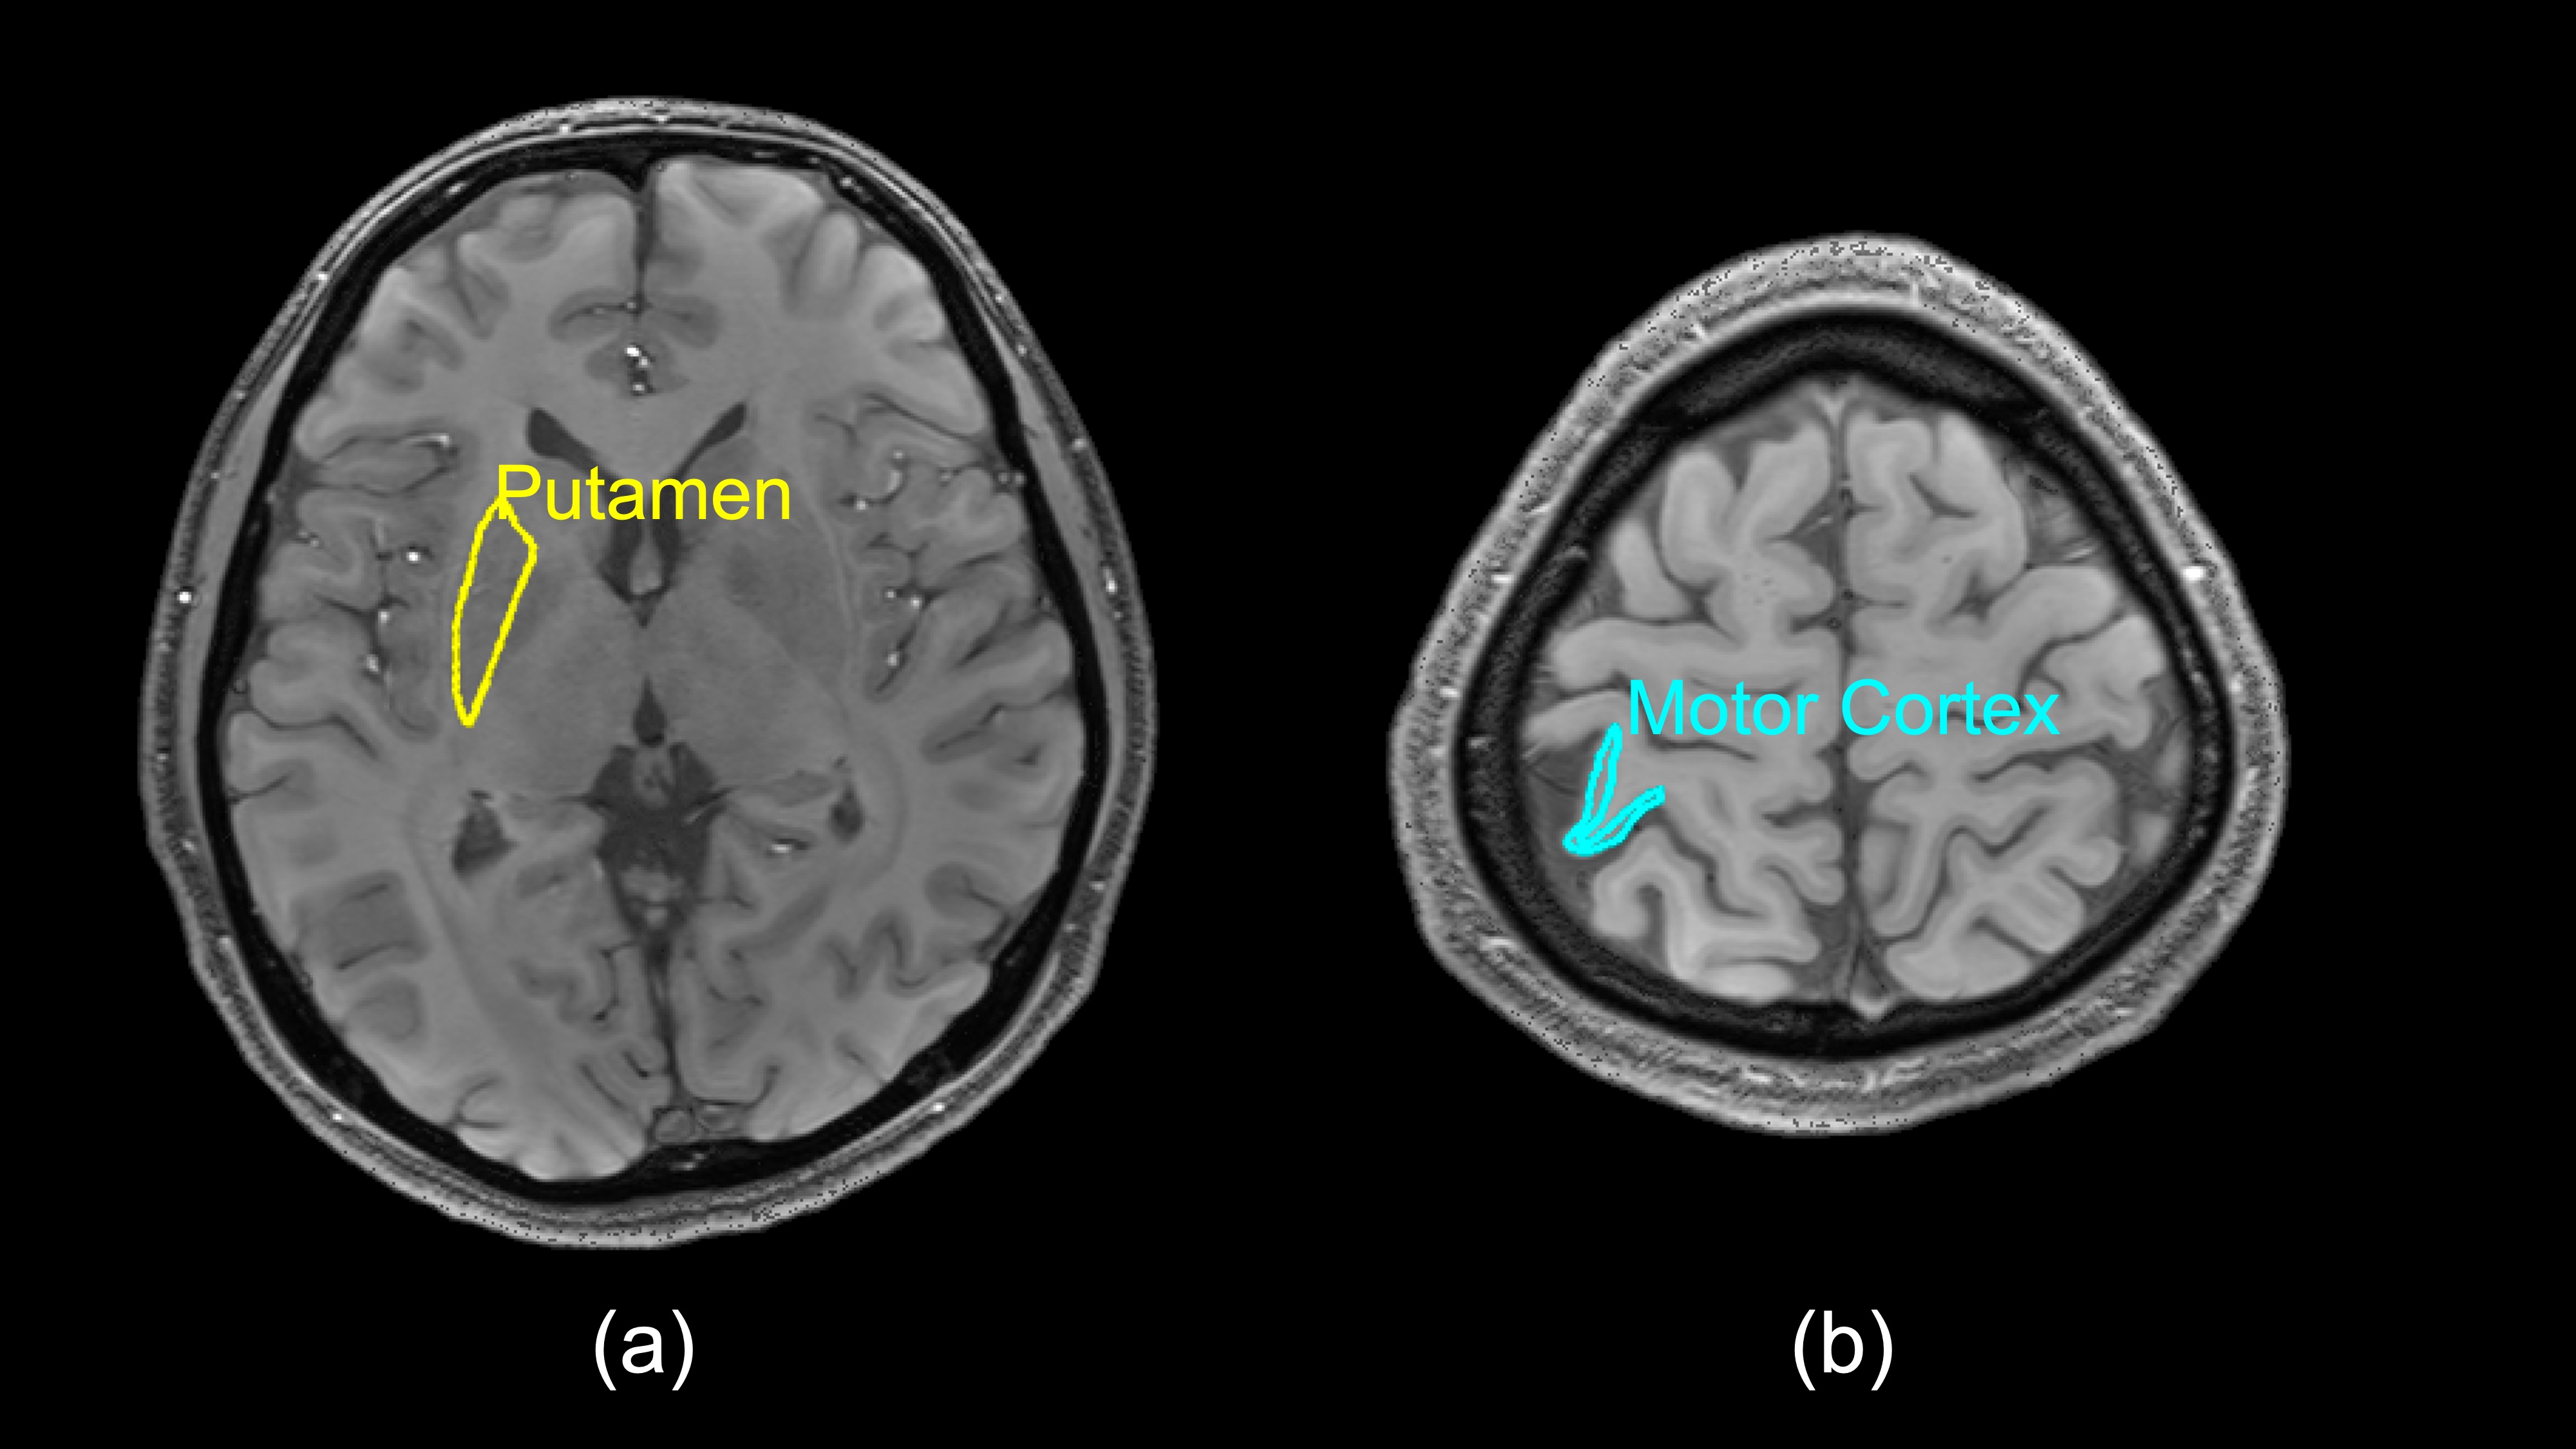
Figure 1 Region of interest (ROI) placements for an example. (a) putamen (b) motor cortex.
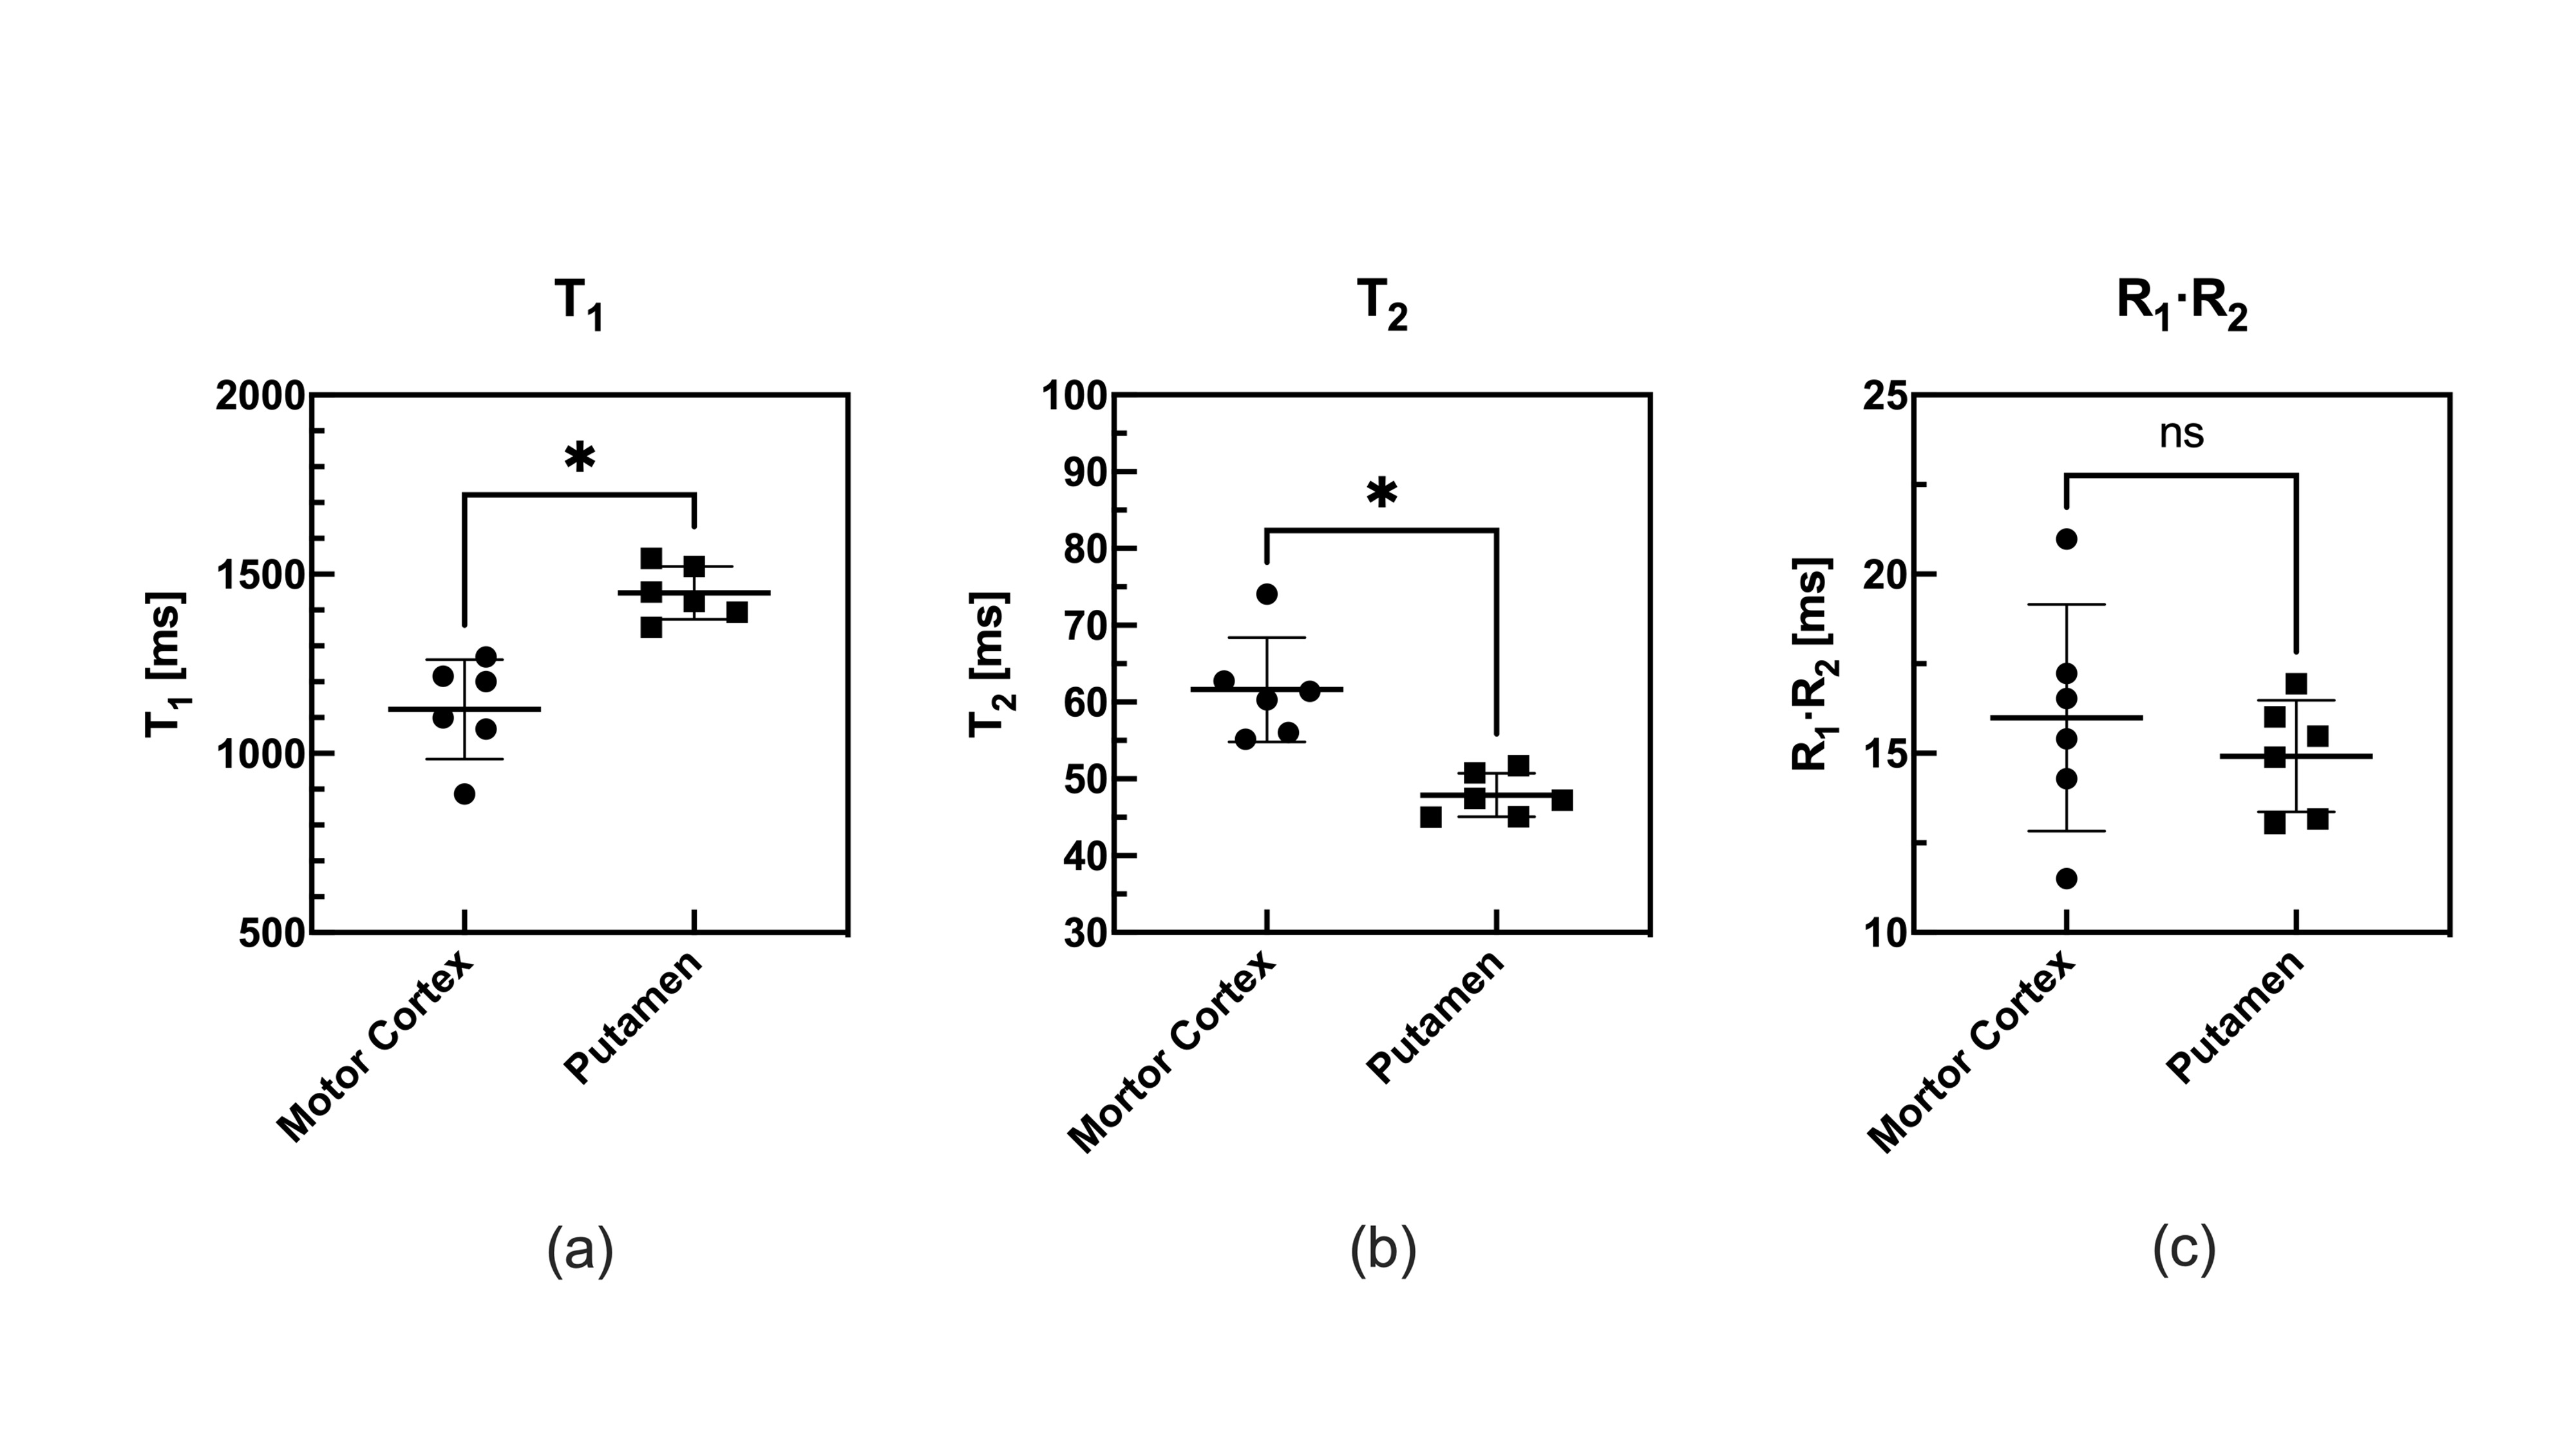
Figure 2 The relationship between the motor cortex and the putamen in T1, T2*, and R1·R2* values.