2932
Brain Iron Content Changes after Neoadjuvant Chemotherapy in Breast Cancer using Quantitative Susceptibility Mapping1Radiology department, Chongqing University Cancer Hospital, Chongqing, China, 2Chongqing University Cancer Hospital, Chongqing, China, 3MR Application Development, Siemens Shenzhen Magnetic Resonance Ltd, Shenzhen, China
Synopsis
Keywords: Gray Matter, Cancer, Neoadjuvant chemotherapy, Breast cancer, Chemotherapy-related cognitive impairment
Motivation: Chemotherapy-related cognitive impairments (CRCIs) are common in patients with breast cancer undergoing neoadjuvant chemotherapy (NAC). However, the mechanisms of CRCI are still unclear. Excess brain iron accumulation might be a potential mechanism for cognitive impairment.
Goal(s): Evaluating the longitudinal changes in brain iron content in participants with breast cancer after NAC using quantitative susceptibility mapping (QSM)
Approach: 53 women with breast cancer were enrolled, and each was imaged with T1WI and QSM and performed before and after NAC.
Results: Brain iron content derived from QSM changed in participants with breast cancer after NAC, and was related to cognitive performance.
Impact: Iron content changes derived from QSM may providing a new objective basis for the mechanism of CRCI.
Introduction
Chemotherapy is an important component of breast cancer treatment [1]. Chemotherapy-related cognitive impairment (CRCI) occurs in up to 75% of patients who receive chemotherapy [2]. Many hypotheses have been proposed to explain the mechanism of CRCI. However, the mechanisms of CRCI are still unclear [3].Chemotherapy can lead to iron metabolism disorder in the central nervous system. Evidence has suggested that brain iron deposition correlates with cognitive impairment [4]. Chemotherapy may be related to the regulation of ferritin expression by cytokines or the formation of iron chelates [5, 6]. Therefore, we hypothesized that disorders in brain iron metabolism after chemotherapy would be related to CRCI.The quantitative susceptibility mapping (QSM) technique allows quantitative estimation of local magnetic susceptibility [7]. This study aimed to evaluate the brain iron content changes in participants with breast cancer undergoing neoadjuvant chemotherapy (NAC) using QSM, providing a new objective basis for the mechanism of CRCI.
Materials and Methods
ParticipantsThis prospective single-center study was approved by the ethical commission of our hospital and all participants provided informed written consent. 53 women breast cancer participants completed the MR examination were recruited, in which thirty-one participants completed neuropsychological tests before and after NAC (Figure 1). Laboratory indices were recorded.
MRI Acquisition and Data Processing
MRI sequences were performed for all participants on a 3T MR system (MAGNETOM Prisma, Siemens Healthcare, Erlangen, Germany) using a 64-channel head & neck coil. 3D-T1 and multi-echo gradient echo (GRE) sequences were obtained for QSM analysis. Multi-echo GRE: TR, 55ms; 8 echoes from 3.6ms to 45ms, with 5.9ms increments; FOV, 240 mm; average, 1; voxel size, 0.9 mm × 0.9 mm × 2 mm; 64 slices.
QSM quantitative map were generated using STI Suite 3.0 software. To obtain the average QSM values of each brain region, a ROI-based method was performed. Brain regions were extracted from 3D-T1 morphometry images and registered to the first echo of multi-echo GRE image, and 38 brain labels were selected for ROI analysis. Finally, each brain region magnetic susceptibility value was extracted (Figure 2).
Data Analysis
Magnetic susceptibility, neuropsychological tests and laboratory indices were compared at two time points using paired t test or Wilcoxon's sign rank test. The association between changes in magnetic susceptibility and neuropsychological scores and laboratory indices were assessed with Spearman or Pearson correlation coefficients. Post hoc tests were performed using Bonferroni correction for multiple comparisons in 38 defined ROIs between the two time points (P’ < 0.05/38). All statistical analysis was conducted using R software.
Results
Compared with baseline, participants performed significantly worse after NAC on the neuropsychological assessments (Table 1). Brain magnetic susceptibility changes were found in the frontal/temporal/occipital/parietal lobe, limbic system, brainstem, subcortical gray nuclei and central region (Table 2).Correlations were observed between changes in the backward digit span test and magnetic susceptibility of the calcarine gyrus (rs = −0.39, P = .03) and olfactory cortex (rs = 0.40, P = .03) and between changes in perceived cognitive abilities and the red nucleus (rs = 0.39, P = .03) (Figure 3).
There were significant differences in serum iron, hemoglobin and mean corpuscular volume before and after NAC. Correlations were found between the changes in the laboratory indices and the putamen, locus coeruleus and median and posterior cingulate (Figure 3).
Discussion and Conclusion
In this study, we adopted the QSM technique to investigate brain iron changes in participants with breast cancer. This study showed changes in magnetic susceptibility in extensive brain regions, which indicated that iron deposition or iron deficiency had occurred in these brain regions. On the one hand, chemotherapeutic drugs may affect the hepcidin expression and thus affect the membrane iron transporters activity in neurons such that iron cannot be excreted [8]. On the other hand, decreased iron concentration may indicate that oligodendrocytes attempted to restore the initial neural or myelin loss caused by chemotherapy [9].The decline in neuropsychological performance indicates a decrease in perceived cognitive functions, which include working memory and short-term memory [10, 11]. The correlations of brain iron content changes and neuropsychological performance suggested that the iron content abnormalities might be related to the impairment of working memory [12, 13].
Furthermore, systemic iron changed after NAC, which may affect the brain iron content. The correlation between blood indices and brain magnetic susceptibility may be explained by the regulatory role of hepcidin, an iron-regulatory hormone that is sensitive to the inflammation induced by chemotherapy [14].
In conclusion, brain iron content derived from QSM changed in participants with breast cancer after NAC and was related to cognitive performance and blood iron indices.
Acknowledgements
The authors thank Lihua Chen, MD, for his suggestions on statistical analysis.The authors thank all volunteers who participated in the study and the staff of the Department of Radiology, Chongqing University Cancer Hospital.
References
1. Pondé NF, Zardavas D, Piccart M. Progress in adjuvant systemic therapy for breast cancer. Nat Rev Clin Oncol 2019;16(1):27-44. doi: 10.1038/s41571-018-0089-9
2. Feng Y, Zhang XD, Zheng G, Zhang LJ. Chemotherapy-induced brain changes in breast cancer survivors: evaluation with multimodality magnetic resonance imaging. Brain Imaging Behav 2019;13(6):1799-1814. doi: 10.1007/s11682-019-00074-y
3. Brown T, Sykes D, Allen AR. Implications of Breast Cancer Chemotherapy-Induced Inflammation on the Gut, Liver, and Central Nervous System. Biomedicines 2021;9(2). doi: 10.3390/biomedicines9020189
4. Masaldan S, Bush AI, Devos D, Rolland AS, Moreau C. Striking while the iron is hot: Iron metabolism and ferroptosis in neurodegeneration. Free Radic Biol Med 2019;133:221-233. doi: 10.1016/j.freeradbiomed.2018.09.033
5. Urrutia P, Aguirre P, Esparza A, Tapia V, Mena N, Arredondo M, González-Billault C, Núñez MJJon. Inflammation alters the expression of DMT1, FPN1 and hepcidin, and it causes iron accumulation in central nervous system cells. 2013;126(4):541-549. doi: 10.1111/jnc.12244
6. Barcellini W, Zaninoni A, Gregorini A, Soverini G, Duca L, Fattizzo B, Giannotta J, Pedrotti P, Vercellati C, Marcello A, Fermo E, Bianchi P, Cappellini MJBjoh. Iron overload in congenital haemolytic anaemias: role of hepcidin and cytokines and predictive value of ferritin and transferrin saturation. 2019;185(3):523-531. doi: 10.1111/bjh.15811
7. Bilgic B, Langkammer C, Marques JP, Meineke J, Milovic C, Schweser F. QSM reconstruction challenge 2.0: Design and report of results. Magn Reson Med 2021;86(3):1241-1255. doi: 10.1002/mrm.28754
8. Qian Z, Ke Y. Brain iron transport. Biological reviews of the Cambridge Philosophical Society 2019;94(5):1672-1684. doi: 10.1111/brv.12521
9. Jáuregui-Lobera I. Iron deficiency and cognitive functions. Neuropsychiatr Dis Treat 2014;10:2087-2095. doi: 10.2147/ndt.S72491
10. Du J, Zhang A, Li J, Liu X, Wu S, Wang B, Wang Y, Jia H. Doxorubicin-Induced Cognitive Impairment: The Mechanistic Insights. Front Oncol 2021;11:673340. doi: 10.3389/fonc.2021.673340
11. Kesler SR, Blayney DW. Neurotoxic Effects of Anthracycline- vs Nonanthracycline-Based Chemotherapy on Cognition in Breast Cancer Survivors. JAMA Oncol 2016;2(2):185-192. doi: 10.1001/jamaoncol.2015.4333
12. Moon CM, Jeong GW. Functional neuroanatomy on the working memory under emotional distraction in patients with generalized anxiety disorder. Psychiatry Clin Neurosci 2015;69(10):609-619. doi: 10.1111/pcn.12295
13. Al-Otaibi M, Lessard-Beaudoin M, Castellano CA, Gris D, Cunnane SC, Graham RK. Volumetric MRI demonstrates atrophy of the olfactory cortex in AD. Curr Alzheimer Res 2020;17(10):904-915. doi: 10.2174/1567205017666201215120909
14. Yu P, Chang YZ. Brain Iron Metabolism and Regulation. Adv Exp Med Biol 2019;1173:33-44. doi: 10.1007/978-981-13-9589-5_3
Figures
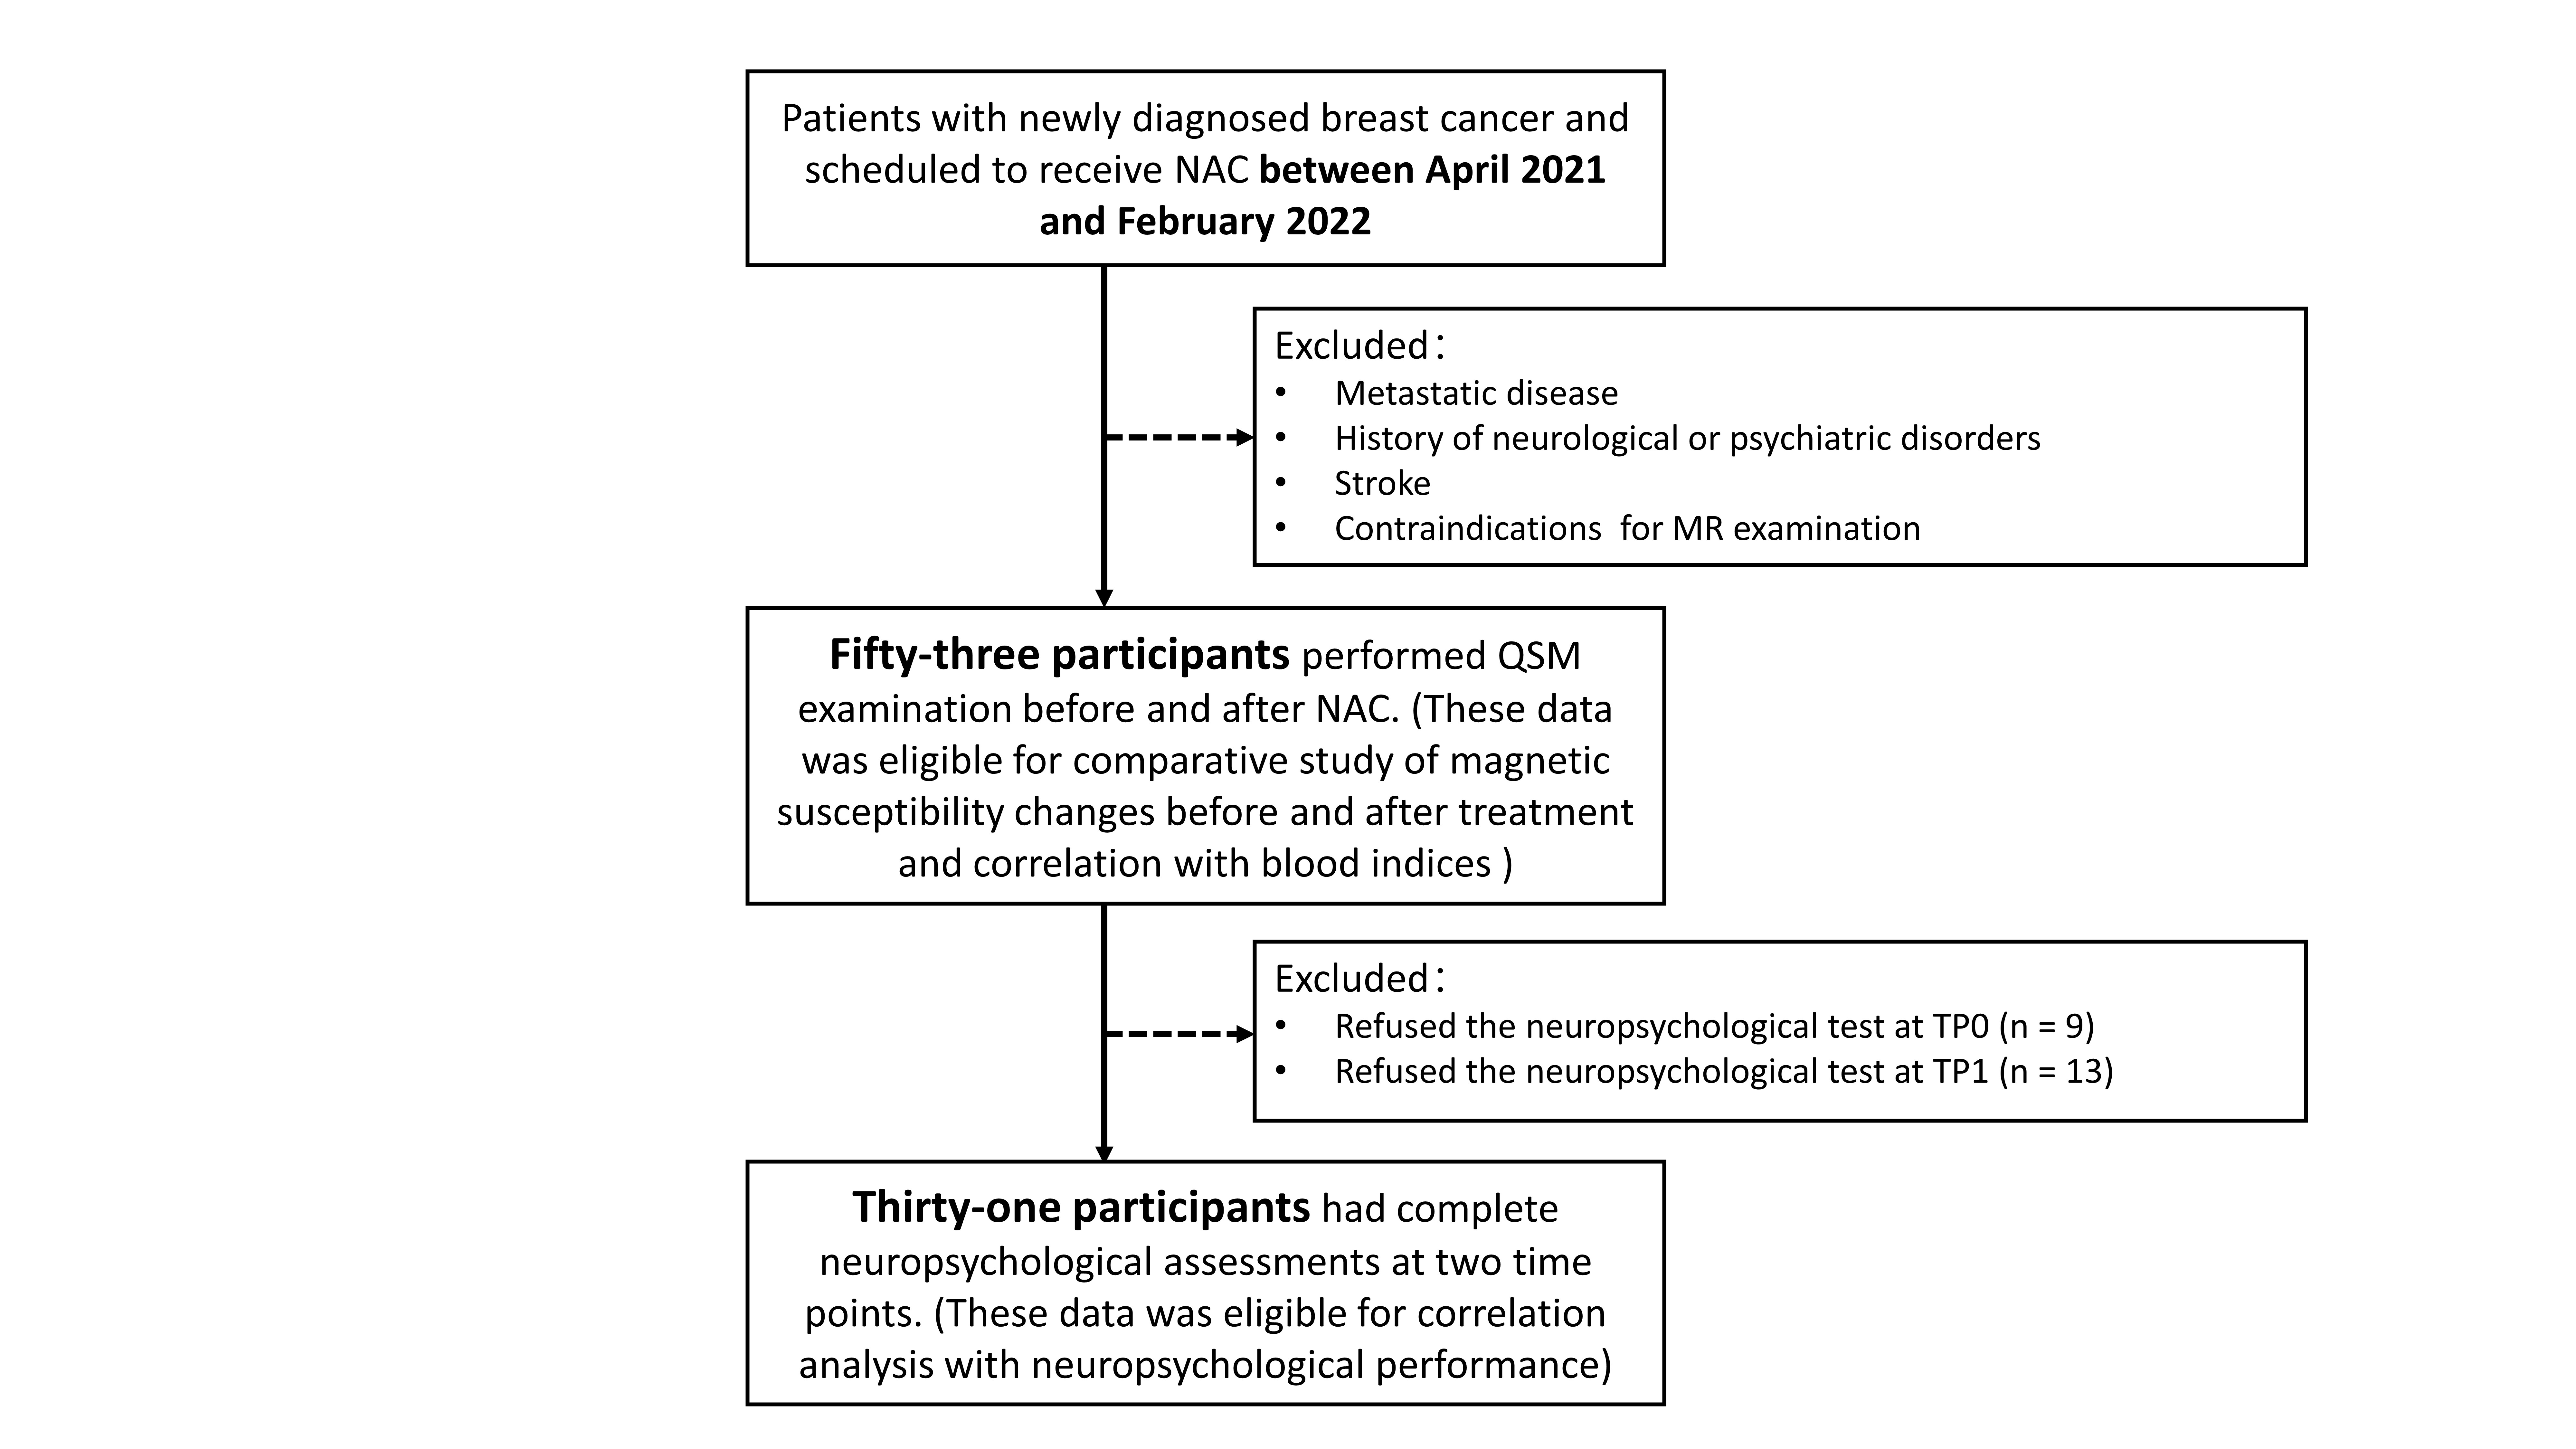
Figure 1. Flowchart shows patient selection. NAC = neoadjuvant chemotherapy, QSM = quantitative susceptibility mapping, TP0 = baseline, TP1 = after the last course of NAC.
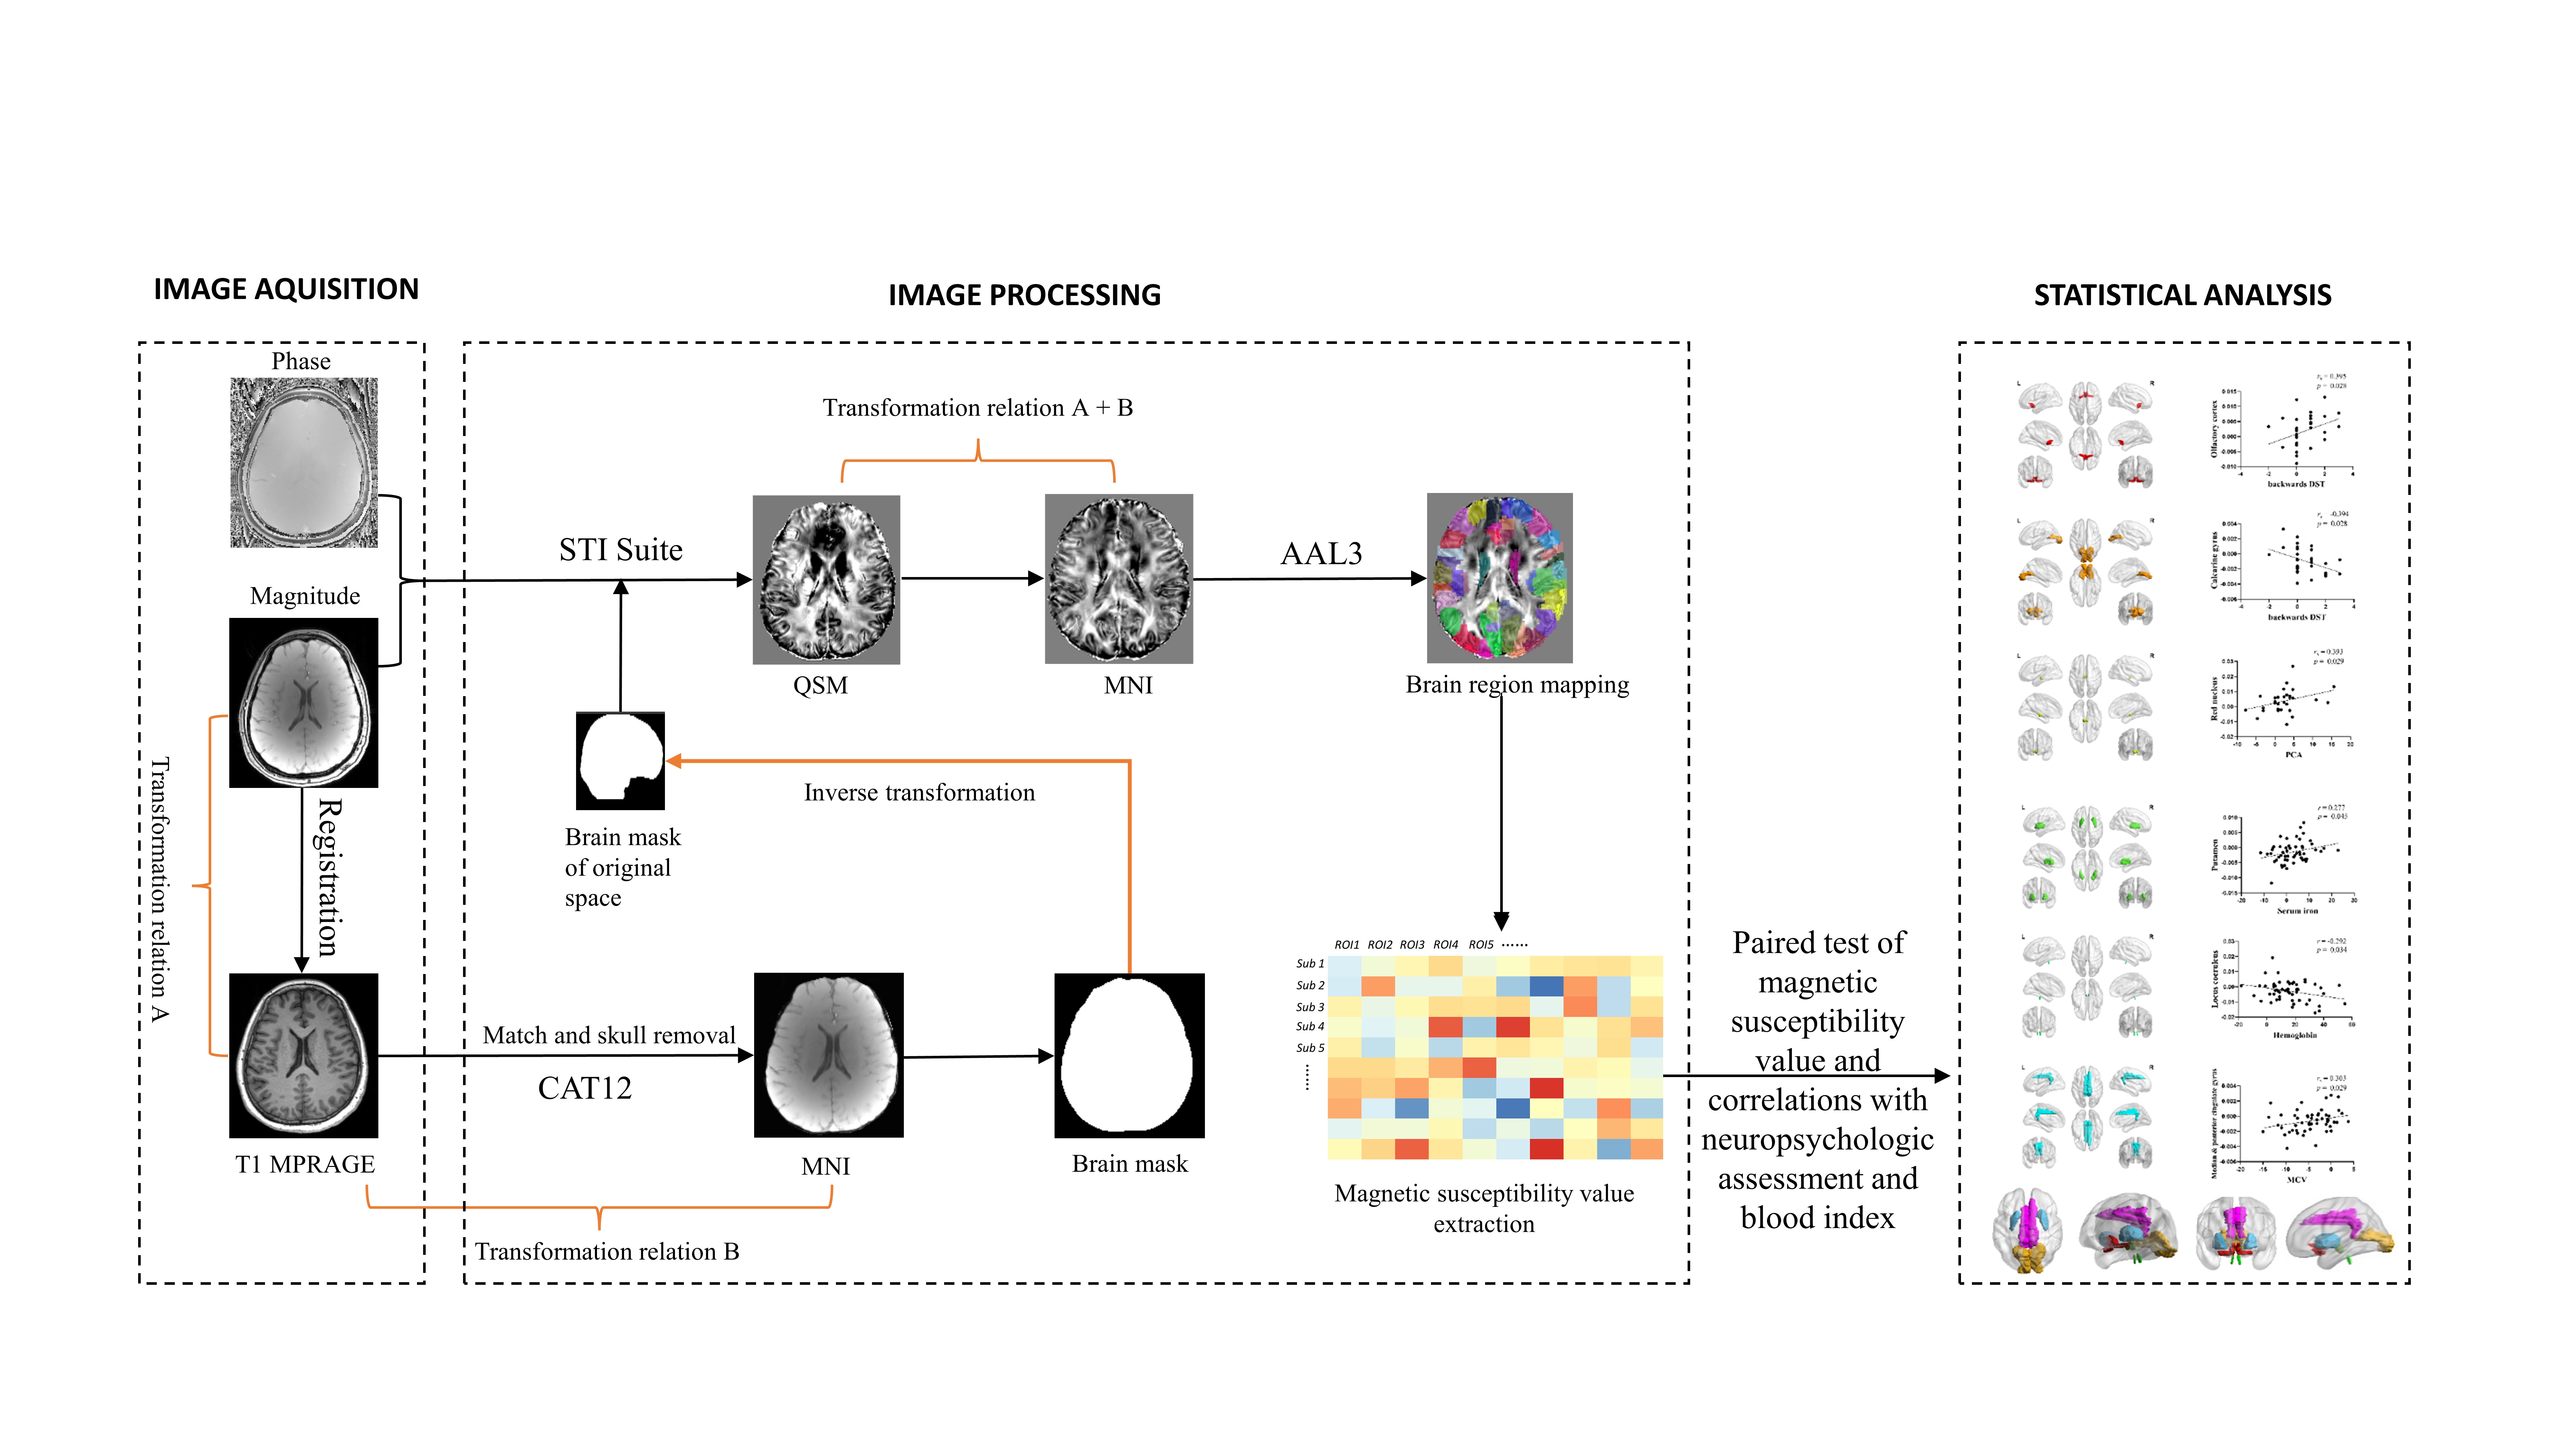
Figure 2. Summary of the data processing pipeline for QSM reconstruction and ROI based analysis.
MPRAGE = magnetization-prepared three-dimensional rapid gradient-echo, QSM = quantitative susceptibility mapping, ROI = region of interest, MNI = Montreal neurological institute spaces, AAL = automated anatomical labeling.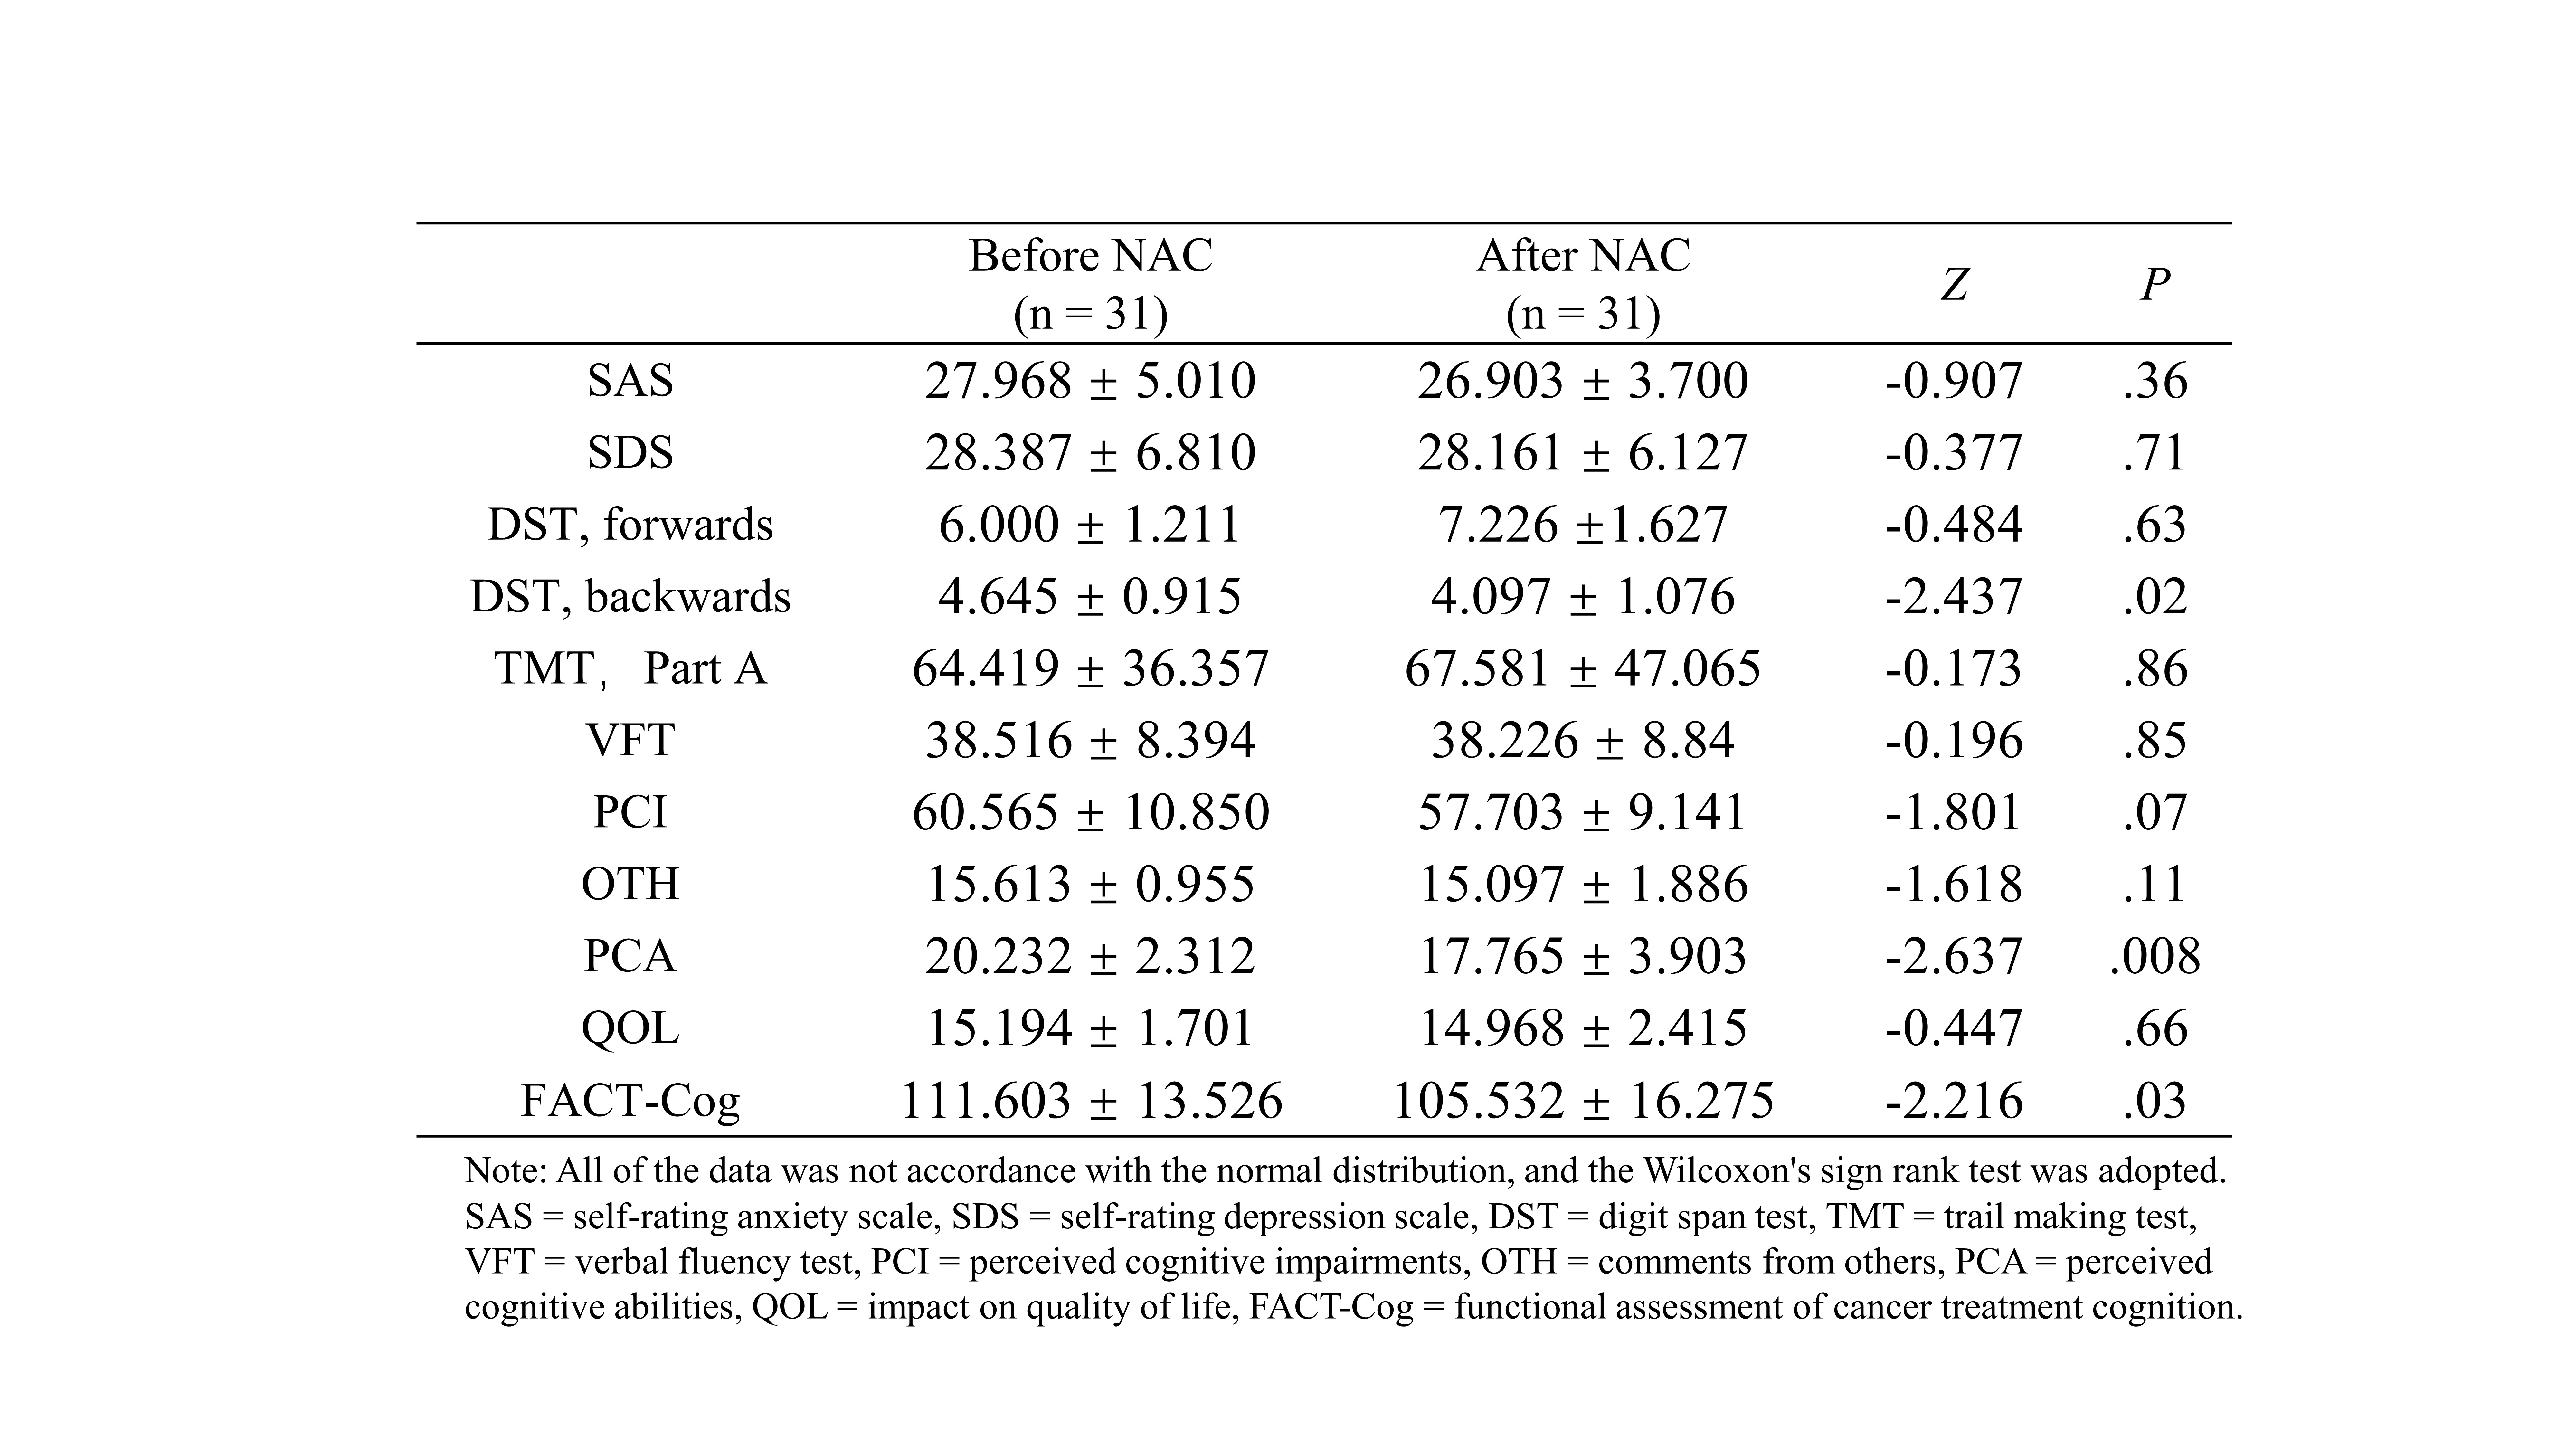
Table 1 Summary of neuropsychologic assessment
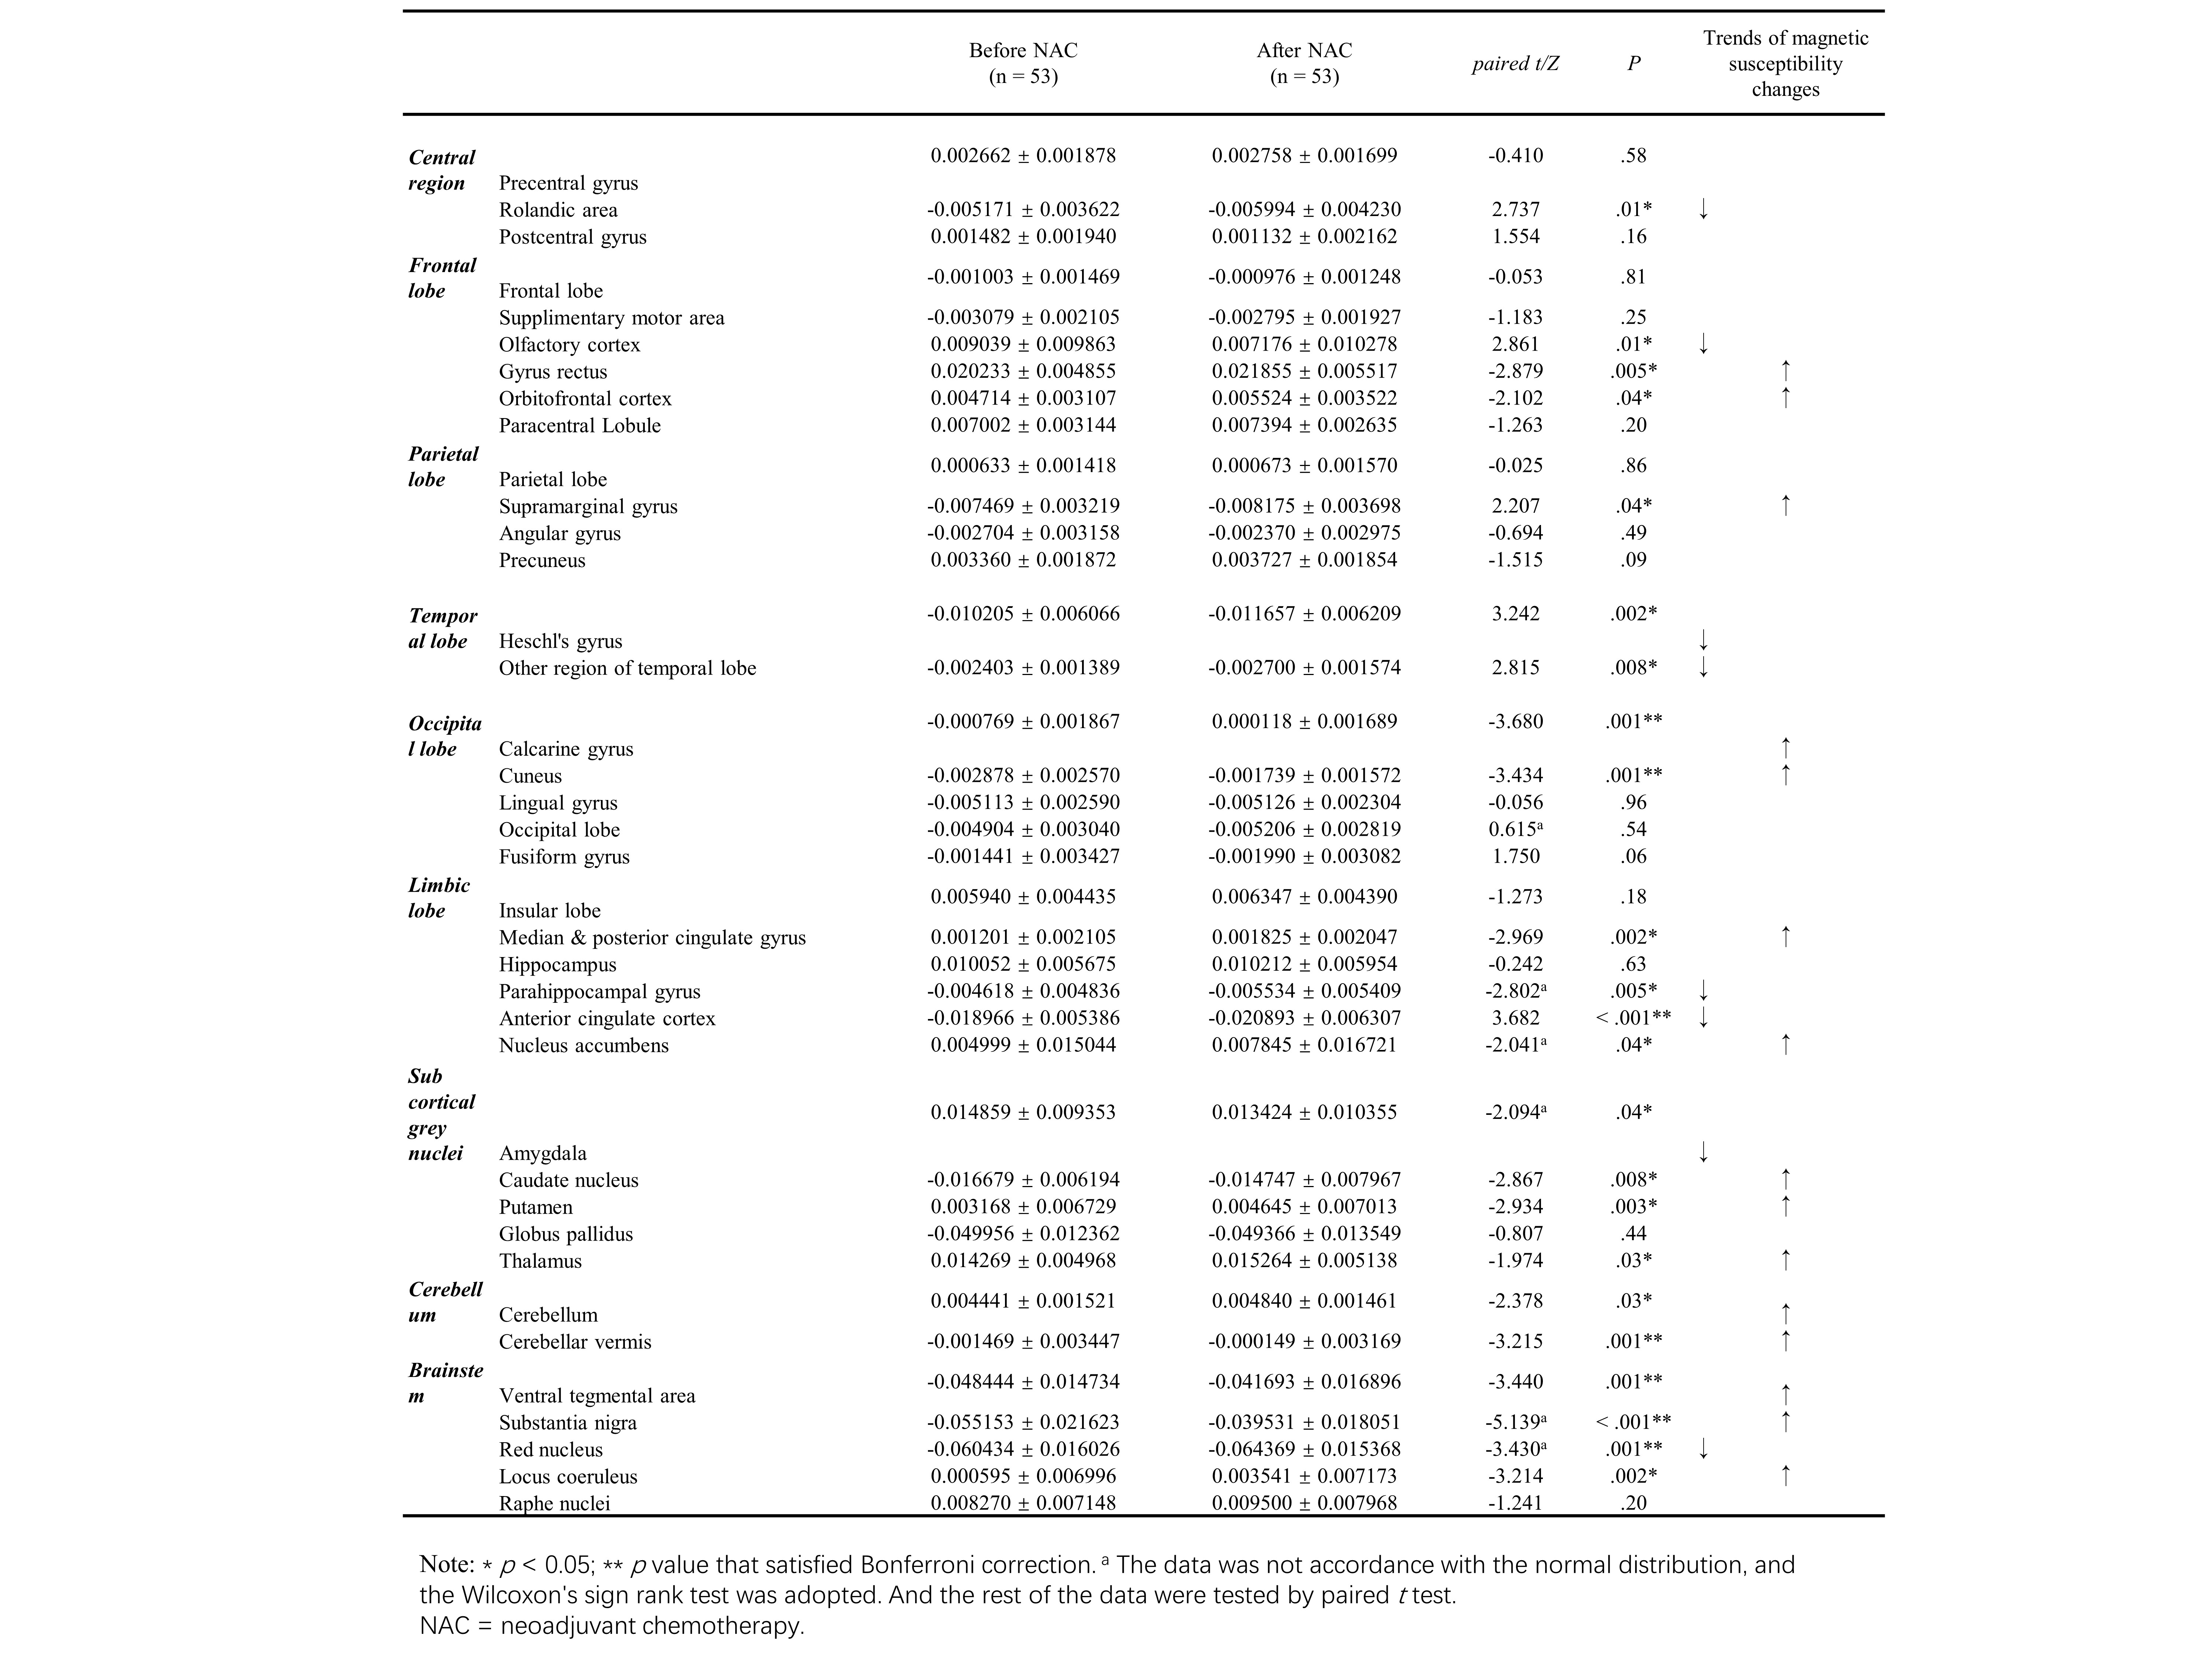
Table 2 Comparison of magnetic susceptibility in different brain regions before and after NAC
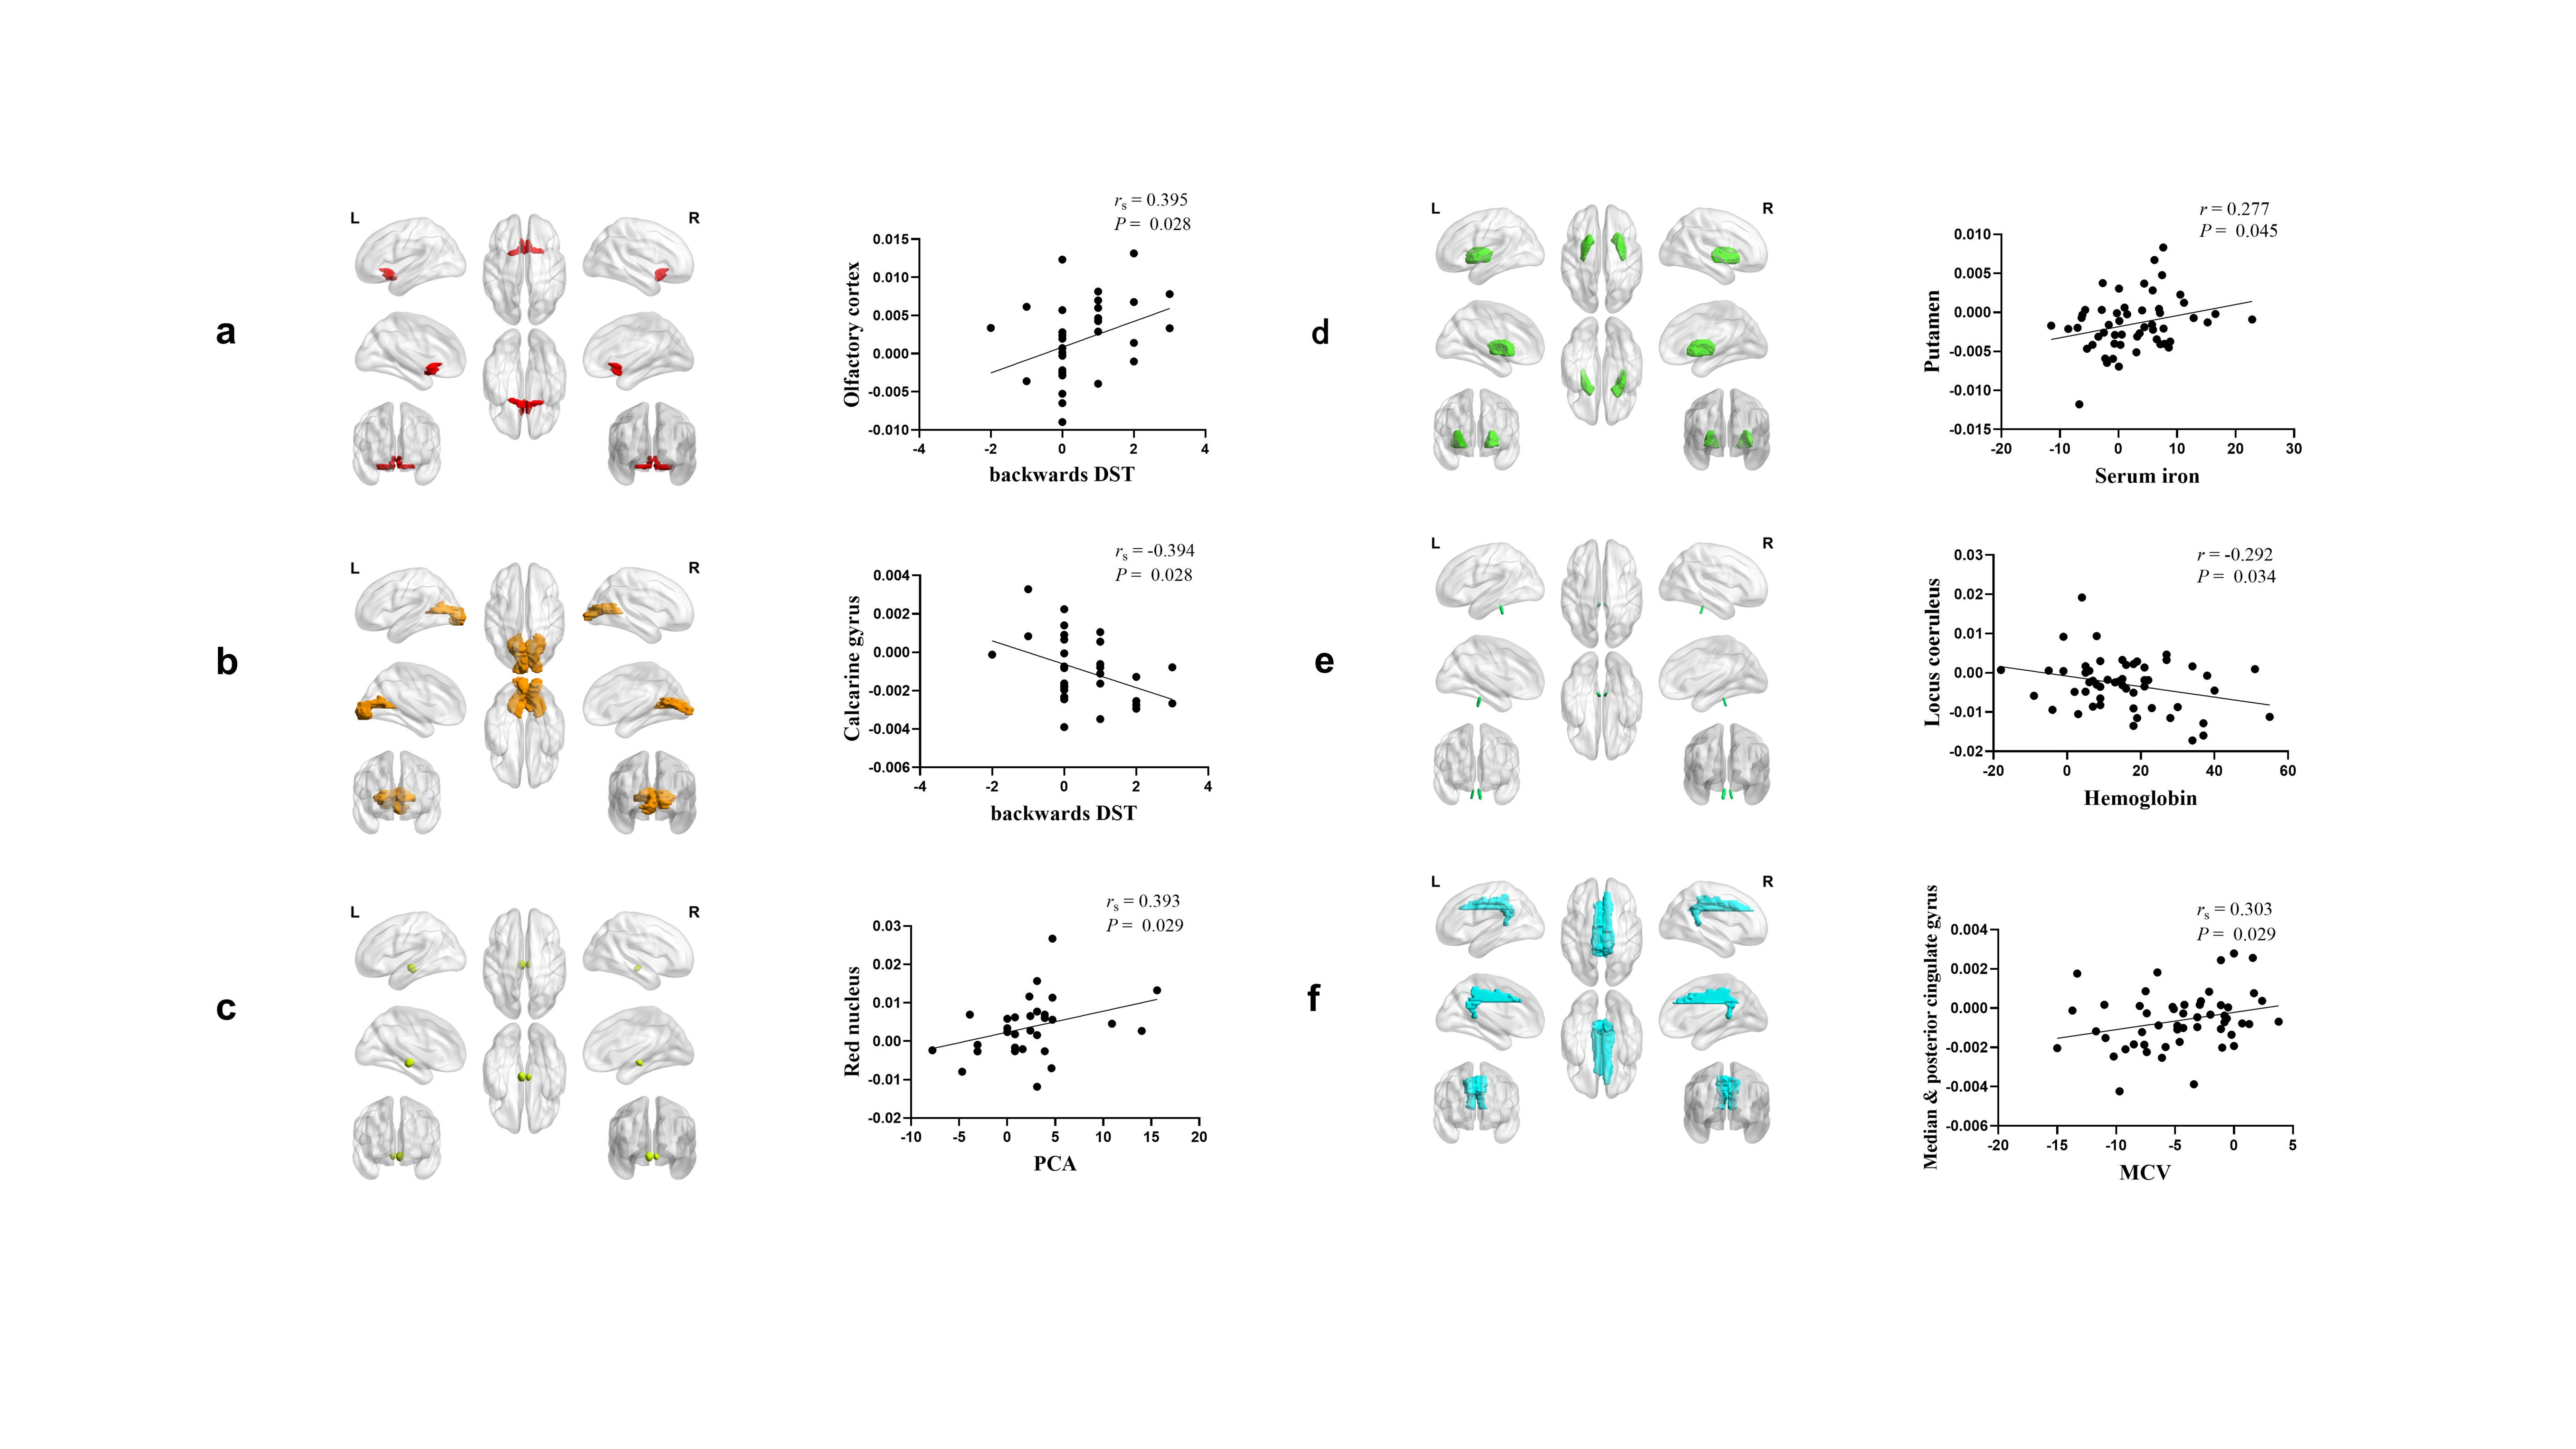
Figure 3 Correlation of changes in neuropsychologic parameters and brain susceptibility values in olfactory cortex (a), Calcarine gyrus (b) and red nucleus (c), and correlations of changes in blood index and brain susceptibility values in putamen (d), Locus coeruleus (e) and Median & posterior cingulate gyrus (f).
r = Pearson correlation coefficient, rs = Spearman correlation coefficient, DST = digit span test, PCA = perceived cognitive abilities, MCV = mean corpuscular volume.