2931
Assessments of brain volume and cerebral perfusion across ages in patients with Duchenne muscular dystrophy1Leiden University Medical Center, Leiden, Netherlands, 2Duchenne center Netherlands, Leiden, Netherlands, 3Newcastle University, Newcastle upon Tyne, United Kingdom, 4Newcastle Hospitals NHS Foundation Trust, Newcastle upon Tyne, United Kingdom
Synopsis
Keywords: Gray Matter, Brain
Motivation: Lower total brain and grey matter volume and reduced cerebral perfusion have been shown cross-sectionally in Duchenne muscular dystrophy (DMD) patients compared to healthy controls (8-18 years old).
Goal(s): We aimed to assess changes of these findings over time.
Approach: We analyzed both; data from adults with DMD and longitudinal data.
Results: Our results show that the difference in total brain volume, grey matter volume and perfusion persist into adulthood, but that the rate of change over ~3 years did not differ between DMD and healthy controls. This suggests that structural brain changes in DMD are not progressive over this timeframe.
Impact: Widespread brain alterations have been observed in the progressive muscle wasting condition DMD, along with neurocognitive and behavioral changes. In contrast to the muscle phenotype, our study showed stable reductions in brain volume and perfusion indicative of non-progressive pathology.
Introduction
Duchenne muscular dystrophy (DMD) is a progressive X-linked recessive neuromuscular disorder caused by the absence of functional dystrophin protein. Patients experience muscle weakness that starts between 2-4 years of age and have a reduced life-expectancy of 30-40 years. Approximately 30% of DMD patients experience behavioral and cognitive deficits, which have a large impact on their quality of life. Life expectancy in DMD will likely increase due to advanced standards-of-care and therapeutic advances leading to a larger expected burden of the cognitive and behavioral problems. Previous studies showed that DMD patients have a reduced total brain volume (TBV), a smaller grey matter volume (GMV), and a globally reduced perfusion (independent of the reduced GMV) compared to healthy controls (HCs)1,2. As these findings are based on cross-sectional studies in children, it is unclear if they are progressive. The current study aimed to assess the progressive nature of the reductions in TBV and GMV and perfusion in children and adults.Methods
This study combined two cohorts: one longitudinal two-center ((Leiden University Medical Center, the Netherlands and Newcastle University, the United Kingdom) cohort and an adult cohort of DMD patients (>18 years) including age- and sex-matched HCs (Leiden site only).Scans were obtained at 3 Tesla (Philips Achieva, Best, the Netherlands) using an 8-channel head coil (longitudinal cohort) or 32-channel head coil (adult cohort).
3DT1-weighted scans (TE/TR 4.6/9.8ms; 1.17x0.92x1.17mm3; 4:55min and TE/TR = 4.60/9.70ms (longitudinal cohort), 1.17x1.17x1.20mm3, 4:57min (adult)) were obtained for anatomical reference and to extract TBV, intracranial volume, white matter (WM), GMV and cerebrospinal fluid (CSF). T1-weighted images were analyzed with FMRIB Software Library (FSL) software version 6.03. Intracranial volumes were obtained using the Brain Extraction Tool (BET)4. GM, WM, and CSF were subsequently segmented using FMRIB’s Automated Segmentation Tool (FAST)5. Quantification of the volumes was performed with fslstats.
A pseudo continuous arterial spin labeling scan (pCASL; TE/TR 14/4020ms; label duration 1650ms; PLD 1525ms; 3.00×3.00×7.00mm3; 4:49min (longitudinal cohort) and pCASL; TE/TR 14/4020ms, PLD 1800ms; 3.75x4.00x6.00mm3; 4:49min, (adult cohort)) was acquired for cerebral perfusion measurements. An M0 scan was acquired for cerebral blood flow (CBF) quantification. Quantification of CBF was performed using the Bayesian Inference for ASL MRI toolkit (BASIL)6, including calibration, white paper recommendations7, motion correction and partial volume correction8. See Figure 1 for an overview of a 3DT1-weighted of a DMD patient and a HC and a raw and analyzed ASL image.
Linear mixed models were used to assess the effect of age (estimated as curvilinear), disease (DMD), and time (independent of age) on TBV and GMV. For ASL, only cross-sectional data were available and hence the effect of time was not assessed. To account for between-scanner and -site differences scanner type and testing site were included as covariates in all models. To control for multiple comparisons a Bonferroni correction was applied.
Results
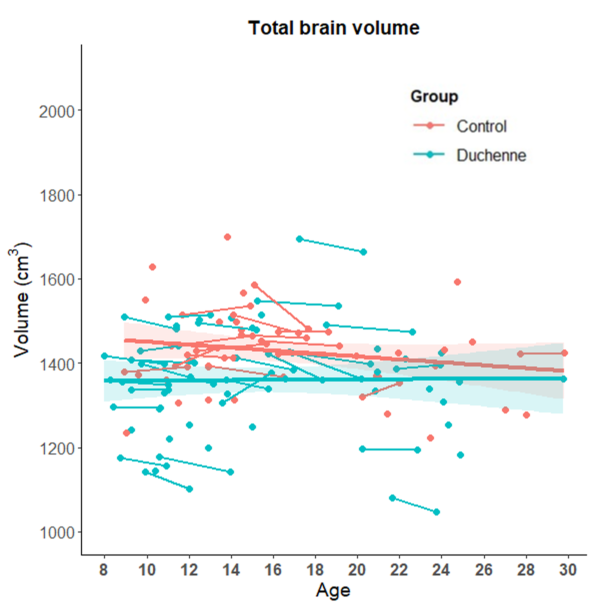
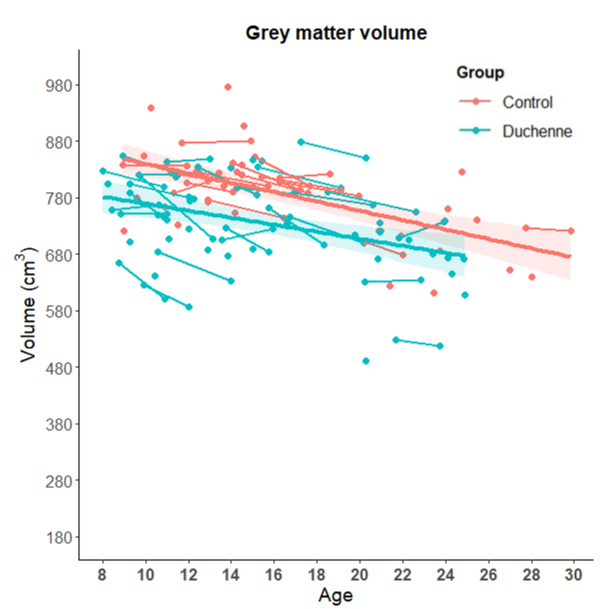
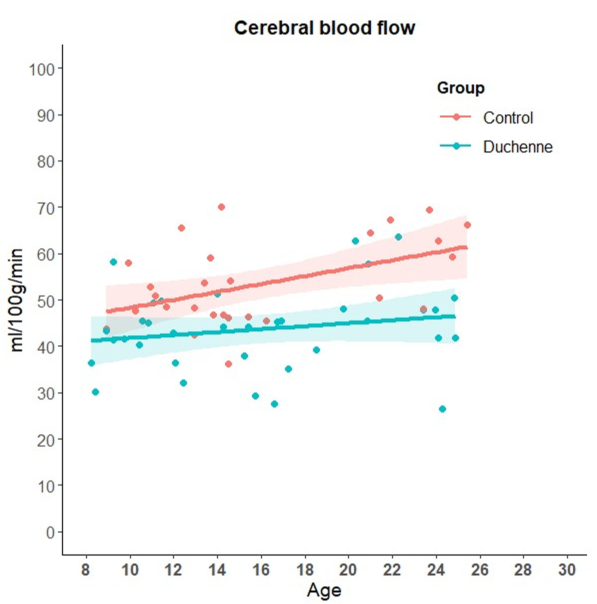
For the longitudinal study, mean age at inclusion was 13.09 (SD 3.79) years for the DMD patients (n= 47) and 13.79 (SD 4.48) years for the HCs (n=32), follow-up measurement was at a median of 2.88 years (IQR = 1.32). The mean age of the adult cohort was 22.98 (SD 1.75) years for DMD (n=10) and 23.37 (SD 2.05) years for HCs (n=10). Three DMD patients and 2 HCs did not pass quality control based on motion in the 3DT1-weighted anatomical scans. ASL data were available from 37 DMD patients and 28 HCs. DMD patients showed a reduced TBV and GMV compared to HCs (b=-0.93, p<0.05; b=-12.35, p<0.05 respectively; Figure 2 and 3). GMV decreased over time in both groups (b=-0.95, p<0.05; b=-2.52, p<0.05 respectively). The decrease in GMV over time was not different between-groups (p>0.05). In addition, DMD patients had a lower cerebral perfusion than HCs (b=0.72, p<0.05; Figure 4). The cerebral perfusion increased with age in both groups (b=0.83, p<0.05), this was not different between-groups (p>0.05).Discussion and conclusion
Our results show that the difference in TBV, GMV, and cerebral perfusion persist into adulthood, but that the rate of change over a 3-year period did not differ between DMD and HCs. This could indicate that the differences compared to controls originate from an early age and do not progress over time. The absence of a decline in perfusion with age seems in contrast to earlier work9. However, we performed partial volume correction to account for the loss in GMV and it is unclear if this contributes to stable perfusion. Furthermore, the volumetric differences in DMD might also be influenced by the impact of the corticosteroid treatment on the brain10.Acknowledgements
This research is supported by the Duchenne Parent Project-NL and Muscular Dystrophy UK.References
- Doorenweerd, N., Dumas, E. M., Ghariq, E., Schmid, S., Straathof, C. S., Roest, A. A., Wokke, B. H., van Zwet, E. W., Webb, A. G., Hendriksen, J. G., van Buchem, M. A., Verschuuren, J. J., Asllani, I., Niks, E. H., van Osch, M. J., & Kan, H. E. (2017). Decreased cerebral perfusion in Duchenne muscular dystrophy patients. Neuromuscular disorders : NMD, 27(1), 29–37. https://doi.org/10.1016/j.nmd.2016.10.005
- Doorenweerd, N., Straathof, C. S., Dumas, E. M., Spitali, P., Ginjaar, I. B., Wokke, B. H., Schrans, D. G., van den Bergen, J. C., van Zwet, E. W., Webb, A., van Buchem, M. A., Verschuuren, J. J., Hendriksen, J. G., Niks, E. H., & Kan, H. E. (2014). Reduced cerebral gray matter and altered white matter in boys with Duchenne muscular dystrophy. Annals of neurology, 76(3), 403–411. https://doi.org/10.1002/ana.24222
- Jenkinson, M., Beckmann, C. F., Behrens, T. E. J., Woolrich, M. W., & Smith, S. M. (2012). FSL. NeuroImage, 62(2), 782–790. https://doi.org/10.1016/J.NEUROIMAGE.2011.09.015
- Smith S. M. (2002). Fast robust automated brain extraction. Human brain mapping, 17(3), 143–155. https://doi.org/10.1002/hbm.10062
- Zhang, Y., Brady, M., & Smith, S. (2001). Segmentation of brain MR images through a hidden Markov random field model and the expectation-maximization algorithm. IEEE Transactions on Medical Imaging, 20(1), 45–57. https://doi.org/10.1109/42.906424
- Chappell MA, Groves AR, Whitcher B, Woolrich MW. Variational Bayesian inference for a non-linear forward model. IEEE Transactions on Signal Processing 57(1):223-236, 2009. 223–236. https://doi.org/10.1109/TSP.2008.2005752
- Alsop, D. C., Detre, J. A., Golay, X. , Günther, M. , Hendrikse, J. , Hernandez‐Garcia, L. , Lu, H. , MacIntosh, B. J., Parkes, L. M., Smits, M. , Osch, M. J., Wang, D. J., Wong, E. C. and Zaharchuk, G. (2015), Recommended implementation of arterial spin‐labeled perfusion MRI for clinical applications: A consensus of the ISMRM perfusion study group and the European consortium for ASL in dementia. Magn. Reson. Med., 73: 102-116. doi:10.1002/mrm.25197
- Chappell, M. A., Groves, A. R., MacIntosh, B. J., Donahue, M. J., Jezzard, P., & Woolrich, M. W. (2011). Partial volume correction of multiple inversion time arterial spin labeling MRI data. Magnetic resonance in medicine, 65(4), 1173–1183. https://doi.org/10.1002/mrm.22641
- Biagi, L., Abbruzzese, A., Bianchi, M. C., Alsop, D. C., Del Guerra, A., & Tosetti, M. (2007). Age dependence of cerebral perfusion assessed by magnetic resonance continuous arterial spin labeling. Journal of magnetic resonance imaging : JMRI, 25(4), 696–702. https://doi.org/10.1002/jmri.20839
- Geuens, S., Van Dessel, J., Govaarts, R., Ikelaar, N. A., Meijer, O. C., Kan, H. E., Niks, E. H., Goemans, N., Lemiere, J., Doorenweerd, N., & De Waele, L. (2023). Comparison of two corticosteroid regimens on brain volumetrics in patients with Duchenne muscular dystrophy. Annals of clinical and translational neurology, 10.1002/acn3.51922. https://doi.org/10.1002/acn3.51922
Figures
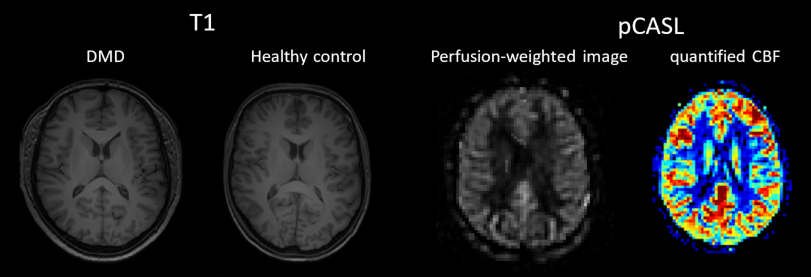
Figure 1. Representative T1-weighted images of a patient with Duchenne muscular dystrophy (DMD) and an age-matched healthy control. On the right, an example of a perfusion-weighted image (pCASL) and an example of a quantified cerebral blood flow image (CBF; from blue (0 ml/100g/min) up to red (100ml/100g/min)).