2929
Thalamic Morphometry Abnormalities in Trigeminal Neuralgia Using Deformation-Based Shape Analysis1Department of Radiology, The First Affiliated Hospital of Shenzhen University, Health Science Center, Shenzhen Second People's Hospital, Shenzhen, China, 2Department of Electrical and Electronic Engineering, Southern University of Science and Technology, Shenzhen, China, 3MR Research Collaboration, Siemens Healthineers, Guangzhou, China
Synopsis
Keywords: Gray Matter, Visualization, thalamic morphometry, trigeminal neuralgia, biomarker
Motivation: The potential pathophysiologic mechanisms related to trigeminal neuralgia (TN) needed elucidation, and alternative biomarkers of TN needed to be identified.
Goal(s): To explore atrophy in specific subregions of the thalamus, which may contribute to the pathophysiology of TN.
Approach: We used vertex-based shape analysis to evaluate the differences in thalamus volume and shape in patients with TN and determine the location of regional thalamic atrophy.
Results: The analysis revealed distinct brain structural disparities between patients with TN exhibiting symptoms on the right and left sides. Compared with controls, patients with TN showed atrophy in specific subregions of the thalamus.
Impact: This study used an advanced deformation-based statistical shape analysis pipeline to investigate localized morphometric abnormalities in the thalamus, rather than relying on global volume measurements. It may help us understand the pathologic mechanism of trigeminal neuralgia.
Introduction
Trigeminal neuralgia (TN) is a chronic neuropathic facial pain affecting 4.3 per 100,000 individuals in the United States1. Frequent pain episodes hinder daily activities, degrading patients' quality of life and mental health2, 3. TN’s pathogenesis remains not fully understood and controversial.The thalamus is central to transmitting TN4. However, MRI studies on its structural changes in TN are inconclusive1, 5, 6.
This study aimed to assess thalamic volume changes and regional atrophy in patients with TN compared with controls.
Methods
1. Study participantsExclusion criteria were TN from neurologic conditions, like tumors or multiple sclerosis, known intracranial lesions including trauma, prior craniocerebral surgery, and incomplete MRI scans. After thorough screening, 60 patients were included. We recruited sex- and age-matched healthy controls without pain or neurologic diseases through advertisements.
2. MRI data acquisition
We employed a 3T system (MAGNETOM Prisma, Siemens Healthineers, Erlangen, Germany) with a 20-channel head/neck coil. Each patient underwent T1-weighted 3D MPRAGE scans (slice thickness of 0.9 mm, 192 sections, a 256 × 256 matrix and voxel size of 0.9 × 0.9 mm2) and preoperative 3D TOF and T2 SPACE sequences.
3. Data processing
We performed image preprocessing and analysis using FSL4.1, and automated thalamus segmentation using FIRST (http://www.fmrib.ox.ac.uk/fsl/ FIRST).
3D volumetric segmentations of the thalamus were converted to triangulated surfaces using an automated pipeline for shape analysis7. We applied large deformation diffeomorphic metric mapping (LDDMM) to align participant’s thalamus surfaces to a common template8, 9. Using a recognized pipeline, we segmented the thalamus structure into specific subregions for more detailed investigations10. Shape comparisons used a linear regression model11.
Results
The demographic and clinical characteristics are summarized in Table 1. No differences in age or sex were observed when comparing patients with the right and left side pain TN and healthy controls.Considerable volume reduction was observed in the TN group compared with the HC group for both the structures under investigation (Tables 2 and 3). The volume reduction was quite similar in both, with a decrease of 7.34% on the left and 8.30% on the right. The P values indicated a great significance of volume reduction on the affected side of the thalamus compared with the contralateral side.
The shape difference mappings are illustrated in Figures 1 and 2, where only vertices that survived the FWER correction at a level of 0.05 are highlighted. The percentage changes are represented as 0% for vertices with no remarkable group shape difference.
Region-specific inhomogeneous surface atrophies were notable in the TN group for all structures, with surface subregion divisions illustrated in Figures 1 and 2. The shape findings were depicted the percentage of surface area differences between the HC and TN groups for each structure and each subregion.
Discussion
This study involved a thorough investigation into thalamic morphometric abnormalities in patients with TN, examining both volume and shape. LDDMM, an advanced deformation-based statistical shape analysis pipeline, was used to quantify localized morphometric abnormalities in both the left and right thalami8, 10. Our findings indicated a greater significance of volume reductions in subfields on the ipsilateral side affected by TN compared with the contralateral side, which was consistent with the laterality of TN pain experience. These findings, combined with previous research, suggested that the small volume of the thalamus in patients with TN might signify an impaired capability to process and regulate neuropathic pain signals12-14. For shape analysis, we observed a notable difference between patients with right and left TN and healthy controls. The shape difference of the TN-affected hemisphere thalamus was more pronounced than that of the contralateral thalamus. For the right TN group, the most atrophic subregions were the temporal and prefrontal lobes of the right thalamus, as well as the anterior motor area and primary motor area of the left thalamus. The left TN group had the sensation of the left thalamus and the occipital lobe, along with the posterior parietal lobe of the right thalamus and the occipital lobe. Thalamic atrophy in the TN group was concentrated in the ipsilateral occipital lobe and sensory-related brain areas15. This insight might enhance our understanding of the lateralization of pain processing pathways and the characteristics of the network of brain regions in the pain matrix16, 17.Future longitudinal studies will probe TN’s effects on thalamic morphometry and validate cortex–white matter connections.
Conclusions
This study identified brain structural disparities in patients with TN, shedding light on pain lateralization. Patients with TN demonstrated thalamic atrophy, hinting at the disease’s pathophysiology and adding translational medicine.Acknowledgements
No acknowledgement found.References
References
1. Alper J, Seifert AC, Verma G et al. Leveraging high-resolution 7-tesla MRI to derive quantitative metrics for the trigeminal nerve and subnuclei of limbic structures in trigeminal neuralgia. J Headache Pain 2021;22:112.
2. Liu H, Hou H, Li F et al. Structural and functional brain changes in patients with classic trigeminal neuralgia: A combination of Voxel-Based morphometry and Resting-State functional MRI study. Front Neurosci 2022;16:930765.
3. Gambeta E, Chichorro JG, Zamponi GW. Trigeminal neuralgia: An overview from pathophysiology to pharmacological treatments. Mol Pain 2020;16:1744806920901890.
4. Boelens KJ, van Heese EM, Laansma MA et al. Structural assessment of thalamus morphology in brain disorders: A review and recommendation of thalamic nucleus segmentation and shape analysis. Neurosci Biobehav Rev 2021;131:466-478.
5. Shen S, Zheng H, Wang J et al. Gray matter volume reduction with different disease duration in trigeminal neuralgia. Neuroradiology 2022;64:301-311.
6. Mooney J, Erickson N, Pittman B et al. The use of MRI in preoperative Decision-Making for trigeminal neuralgia: A Single-Center study. World Neurosurg 2021;146:e651-e657.
7. Tang X, Luo Y, Chen Z et al. A Fully-Automated subcortical and ventricular shape generation pipeline preserving smoothness and anatomical topology. Front Neurosci 2018;12:321.
8. Ma J, Miller MI, Younes L. A bayesian generative model for surface template estimation. Int J Biomed Imaging 2010;2010.
9. Vaillant M, Glaunès J. Surface matching via currents. Inf Process Med Imaging 2005;19:381-92.
10. Tang X, Holland D, Dale AM et al. Shape abnormalities of subcortical and ventricular structures in mild cognitive impairment and Alzheimer's disease: Detecting, quantifying, and predicting. Hum Brain Mapp 2014;35:3701-25.
11. Nichols T, Hayasaka S. Controlling the familywise error rate in functional neuroimaging: A comparative review. Stat Methods Med Res 2003;12:419-46.
12. Vaculik MF, Noorani A, Hung PS et al. Selective hippocampal subfield volume reductions in classic trigeminal neuralgia. Neuroimage Clin 2019;23:101911.
13. Xu H, Zhang M, Wang Y. Shape deformations of the basal ganglia in patients with classical trigeminal neuralgia: A cross-sectional evaluation. Neurol Sci 2022;43:5007-5015.
14. Mo J, Zhang J, Hu W et al. Whole-brain morphological alterations associated with trigeminal neuralgia. J Headache Pain 2021;22:95.
15. Michels L, Koirala N, Groppa S et al. Structural brain network characteristics in patients with episodic and chronic migraine. J Headache Pain 2021;22:8.
16. Hebestreit JM, May A. Topiramate modulates trigeminal pain processing in thalamo-cortical networks in humans after single dose administration. Plos One 2017;12:e0184406.
17. Tu Y, Fu Z, Mao C et al. Distinct thalamocortical network dynamics are associated with the pathophysiology of chronic low back pain. Nat Commun 2020;11:3948.
Figures

SD, standard deviation; NA, not applicable; TN, trigeminal neuralgia; HCs, healthy controls
a p values were calculated with the analysis of variance (ANOVA)
b p value was obtained using a Pearson x2 test
c p values were calculated with two-tailed t tests

SD, standard deviation; NA, not applicable; TN, trigeminal neuralgia; HCs, healthy controls
p values were calculated with two-tailed t tests

SD, standard deviation; NA, not applicable; TN, trigeminal neuralgia; HCs, healthy controls
p values were calculated with two-tailed t tests
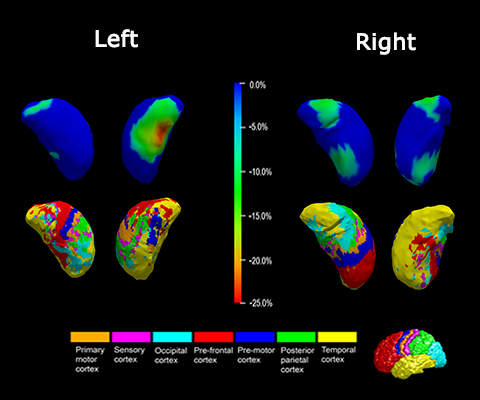
Figure 1 Shape analysis results for the bilateral thalamus in Right TN. Statistically significant group comparison results for the thalamus shape in each hemisphere as well as the corresponding subregion definitions. The color bar represents the per-centage of atrophy at a specific vertex in the disease group relative to the control group. The bottom panel illustrates the seven subregions of the bilateral thalamus. Two views (left: Lateral, right: Medial) are presented for each case.
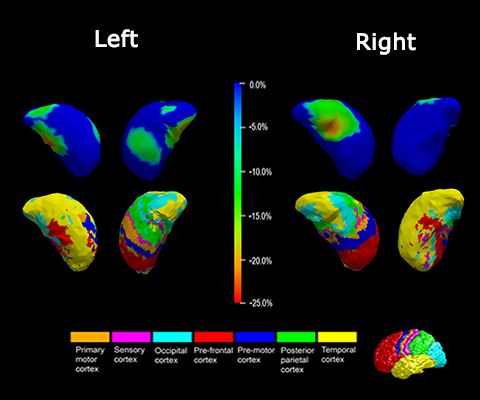
Figure 2 Shape analysis results for the bilateral thalamus in Left TN. Statistically significant group comparison results for the thalamus shape in each hemisphere as well as the corresponding subregion definitions. The color bar represents the per-centage of atrophy at a specific vertex in the disease group relative to the control group. The bottom panel illustrates the seven subregions of the bilateral thalamus. Two views (left: Lateral, right: Medial) are presented for each case.