2928
Volumetric brain analysis and associated retinal thinning in autosomal dominant optic atrophy plus syndrome1Radiology, Faculty of Medicine, Siriraj Hospital, Madidol University, Bangkok, Thailand, 2Ophthalmology, Faculty of Medicine, Siriraj Hospital, Madidol University, Bangkok, Thailand, 3Medicine, Faculty of Medicine, Siriraj Hospital, Madidol University, Bangkok, Thailand
Synopsis
Keywords: Gray Matter, Brain, Dominant Optic Atrophy, OPA1, Primary visual cortex, occipital lobe, atrophy
Motivation: Dominant optic atrophy plus patients have retinal thinning like in glaucoma patients that have associated structural atrophy of primary visual cortex.
Goal(s): To evaluate the cerebral atrophy of DOA-plus patients compared with normal healthy group and analyse correlation between the retinal thinning and primary visual cortex atrophy.
Approach: Recruited DOA-plus and normal healthy patients were examed with OCT test for retinal abnormality, imaged with 3T MRI and analyse the images using Freesurfer software for data including gray matter volume.
Results: DOA-plus patients have significant cerebral atrophy, more pronounce at primary visual cortex with positive correlation between retinal thinning and primary visual cortex.
Impact: For better understanding of structural brain change in DOA-plus patients and may help in the study of pathophysiology of primary visual cortex atrophy in DOA-plus patient by advanced MRI techniques.
Introduction
Dominant optic atrophy (DOA) or autosomal dominant optic atrophy (ADOA) is mitochondriopathy with neuro-ophthalmic condition affecting the retinal ganglion cells (RGC) and their axons causing progressive visual loss(1). Dominant optic atrophy syndrome (DOA-plus, DOA+) is a syndromic manifestation with extra-ophthalmological abnormalities represent up to 20% of DOA patients with OPA1 mutation(2). The most common extra-ocular sign is sensorineural hearing loss and other associated findings including myopathy and peripheral neuropathy. CNS involvement of DOA-plus patient with OPA1 mutation can be found from conventional MRI as cortical and cerebellar atrophy but there is no mentioning of specific location or pattern involvement(3).Objective
To demonstrate cerebral cortex abnormality in dominant optic atrophy plus patients compared with healthy controls and to study correlation between retinal thinning and primary visual cortexMaterial and Method
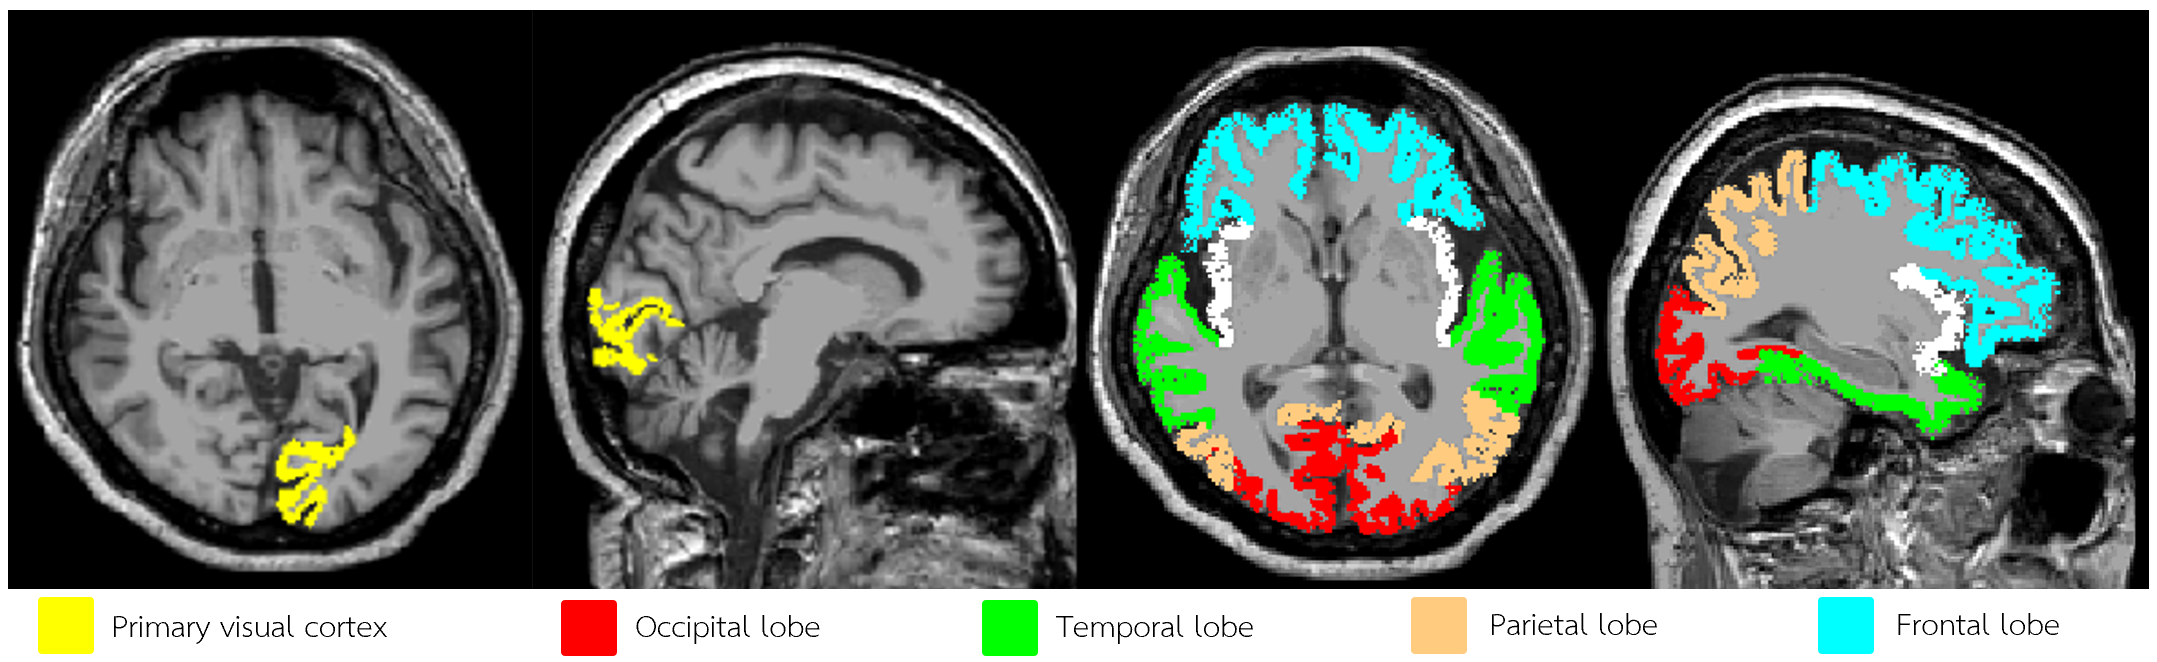
Seven DOA-plus patients and seven age-matched, sex-matched healthy control subjects were prospectively recruited between June 2020 – December 2021 and were performed MRI of the brain. T1WI sequence was obtained using a 3D TFE with 3T MR scanner. Cortical analysis of the whole brain including gray matter volume were performed by Freesurfer software v.6.0(2) and data of primary visual cortex, occipital lobe, temporal lobe, parietal lobe and frontal lobe were obtained. The optical coherence tomography (OCT) was performed by experienced ophthalmologists to evaluate retinal abnormality. Independent t-test was used to compared analytic data between DOA-plus patients and healthy control. Pearson’s correlation was used to demonstrate a correlation between OCT data (average RNFL, average GCL/IPL) and primary visual cortex data.Results
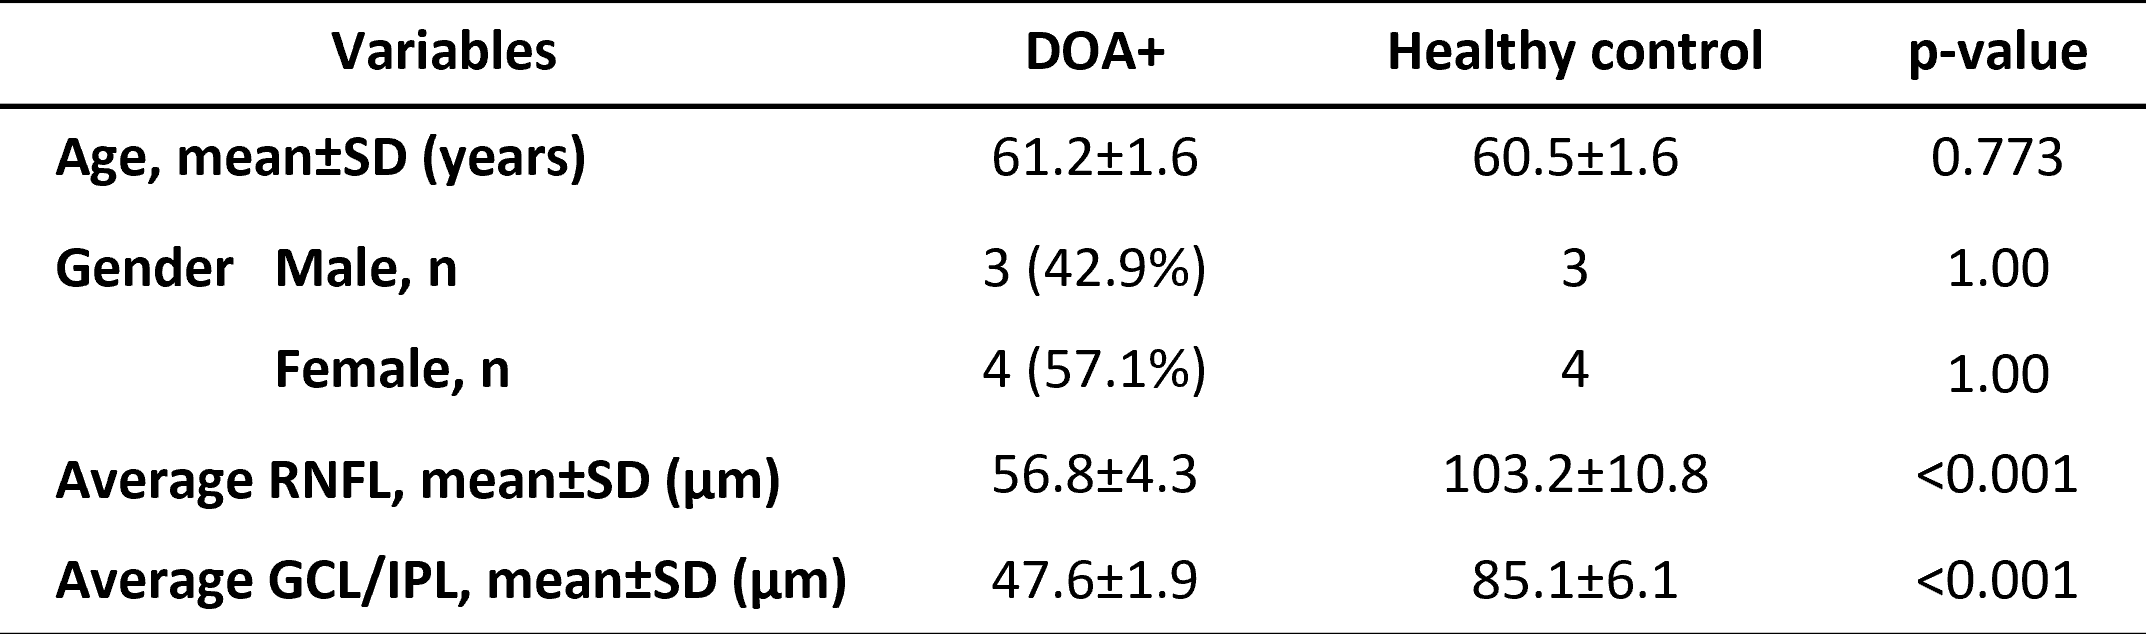
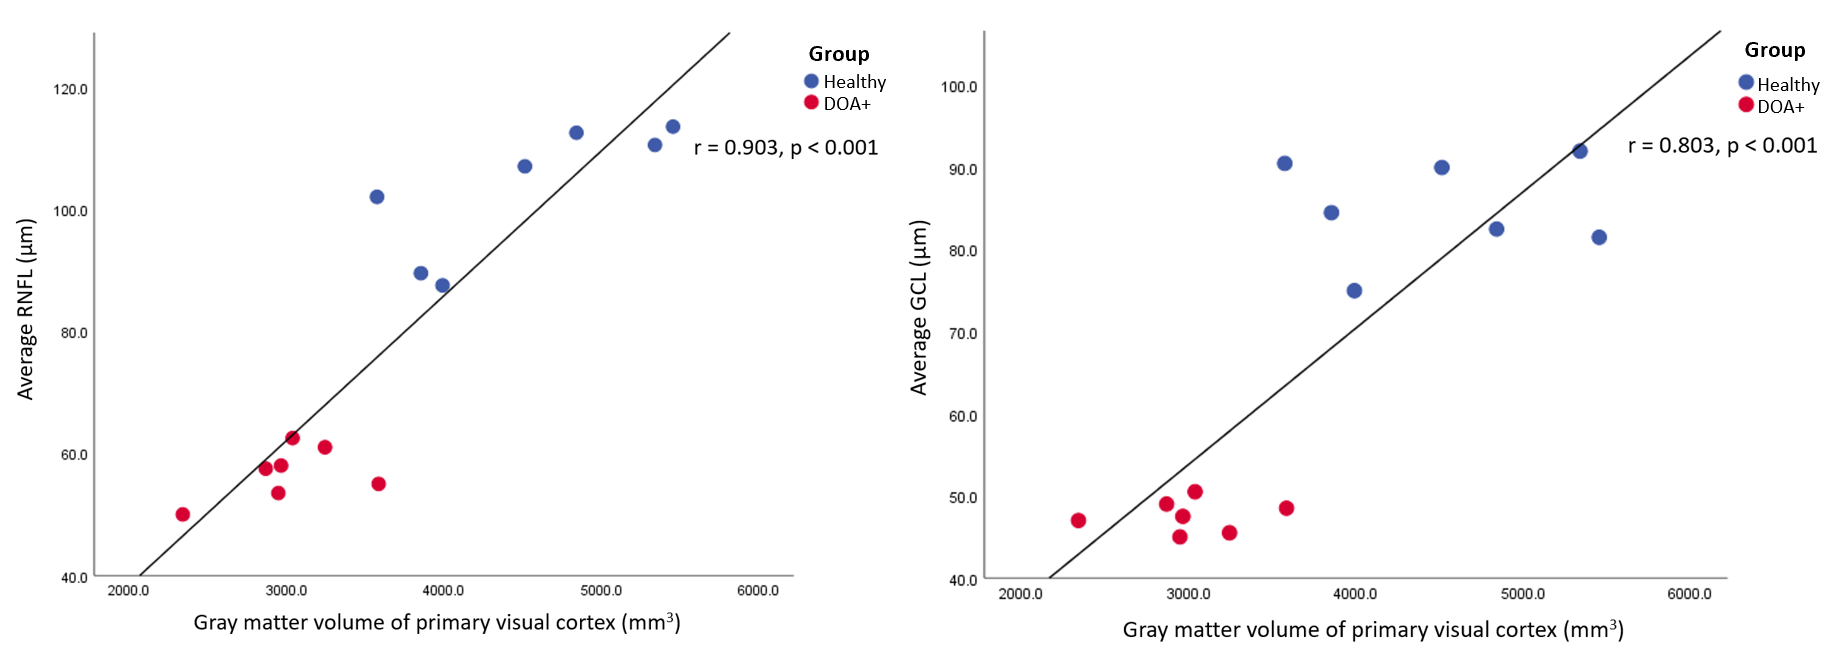
All DOA-plus patients has significant retinal thinning with average RNFL = 56.8±4.3 µm compared with healthy control group average RNFL = 103.2±10.8 µm (p<0.001) and average GCL/IPL = 47.6±1.9 µm compared with healthy control group average GCL/IPL = 85.1±6.1 µm (p<0.001). DOA-plus group has significant reduction in gray matter volume of cerebral cortex of the brain; frontal lobe (DOA+ = 70837.4±7915.6 mm3, healthy control = 82000.6±10580.3 mm3, 13.6% reduction, p=0.045), temporal lobe (DOA+ = 43193.6±6128.7 mm3, healthy control = 51236.9±7301.5 mm3, 15.7% reduction, p=0045), parietal lobe (DOA+ = 44756.4±7327.5 mm3, healthy control = 55995.6±8462.1 mm3, 20.1% reduction, p=0.021) and occipital lobe (DOA+ = 18071.2±2415.3 mm3, healthy control = 24127.8±2346.3 mm3, 25.1% reduction, p<0.001) and also at primary visual cortex (DOA+ = 2997.7±378.5 mm3, healthy control = 4509.5±738.0 mm3, 33.5% reduction, p<0.001) when compared with healthy control. There is a strong significant positive correlation between (average RNFL, average GCL/IPL) and primary visual cortex (r = 0.905, 0.803, p = <0.001).Discussion
Our study observed significant reduction in average RNFL and average GCL/IPL reflecting retinal thinning in DOA-plus patients group that caused by degeneration of retinal ganglion cells due to mitochondrial fragility from OPA1-gene mutation and photo-oxidative stress(1). The reduction of gray matter volume of the primary visual cortex and cortical lobes (frontal lobe, occipital lobe, temporal lobe, and parietal lobe) in our DOA-plus patients represented cerebral atrophy, which corresponds with the result of previous study(3). Cortical and cerebellar atrophy were common non-specific findings that could be found in other mitochondrial diseases due to mitochondrial abnormality resulting in damage of neuronal tissue and subsequent brain atrophy(5). Atrophy of retinal ganglion cells could result in structural brain changes as seen in glaucoma, prior studies had stated degenerative change of posterior visual pathway including optic radiation and visual cortex was foreshadowed by retinal ganglion cells axonopathy, suggesting anterograde trans-synaptic degeneration, described as the loss of inputs from damaged presynaptic neurons causing degeneration of postsynaptic neurons, to be responsible for structural brain change(6). In our study the cortical lobe with the highest percentage of gray matter volume reduction is the occipital lobe. From the strong significant positive correlation between retinal thickness and gray matter volume of the primary visual cortex, we suggested that, in addition to the effect of mitochondrial abnormality affecting neuronal structures, the process of anterograde trans-synaptic degeneration caused by retinal atrophy is responsible for predominant occipital lobe atrophy in our patients. Future study using advanced MRI techniques such as diffusion imaging may help in better understanding of pathophysiology behind cerebral atrophy in DOA-plus patients.Conclusion
DOA-plus patients demonstrated significant retinal thinning and cerebral atrophy, which is more pronounce at primary visual cortex and occipital lobe, with a strong positive correlation between gray matter volume of primary visual cortex and retinal thinning probably associated with anterograde trans-synaptic degeneration.Acknowledgements
The authors would like to express sincere gratitude to ophthalmologists, neurologists, statistician and radiologist technicians of Faculty of medicine, Siriraj Hospital, Mahidol University for their dedication, commitment and contribution in this research.References
1. Lenaers, G., Hamel, C., Delettre, C. et al. Dominant optic atrophy. Orphanet J Rare Dis 7, 46 (2012)
2. Yu-Wai-Man P, Griffiths PG, Burke A, Sellar PW, Clarke MP, Gnanaraj L, Ah-Kine D, Hudson G, Czermin B, Taylor RW, et al: The prevalence and natural history of dominant optic atrophy due to OPA1 mutations. Ophthalmology. 2010, 117 (8): 1531-1546.
3. Yu-Wai-Man P, Griffiths PG, Gorman GS, et al. Multi-system neurological disease is common in patients with OPA1 mutations. Brain. 2010 Mar;133(Pt 3):771-86
4. Fischl B. FreeSurfer. Neuroimage. 2012;62(2):774-81.
5. Gropman AL. Neuroimaging in Mitochondrial Disorders. Neurotherapeutics. 2013;10(2):273-85
6. Davis BM, Crawley L, Pahlitzsch M, Javaid F, Cordeiro MF. Glaucoma: the retina and beyond. Acta Neuropathologica. 2016;132(6):807-26
Figures