2921
Evaluating R1 and T1w/T2w as myelin-sensitive measures compared to macromolecular proton fraction1Bernard and Irene Schwartz Center for Biomedical Imaging, Department of Radiology, New York University Grossman School of Medicine, New York, NY, United States, 2Center for Advanced Imaging Innovation and Research (CAI2R), Department of Radiology, New York University Grossman School of Medicine, New York, NY, United States, 3Vilcek Institute of Graduate Biomedical Sciences, New York University Grossman School of Medicine, New York, NY, United States, 4Department of Radiology, University of Wisconsin-Madison, Madison, WI, United States
Synopsis
Keywords: Gray Matter, Quantitative Imaging
Motivation: In vivo myelin mapping of the human brain holds great research significance due to the critical role that myelin health plays in both normal and neuropathological conditions.
Goal(s): To quantitatively assess the relationship and concordance between MRI-based myelin-sensitive metrics, which are not well understood in current literature.
Approach: Using the macromolecular proton fraction (MPF) as a standard myelin marker, we compared the longitudinal relaxation rate (R1) and T1w/T2w image ratio and their reliability across tissue types.
Results: We show that R1 corresponds well with MPF across the brain while T1w/T2w is reasonably reliable in only limited areas.
Impact: By quantitatively comparing R1 and T1w/T2w with more established myelin marker MPF, we highlight their varying levels of concordance across tissue types, which informs future studies planning to use R1 or T1w/T2w as myelin proxies in the brain.
Introduction
In vivo myelin mapping of the human brain using MRI holds great research significance due to the critical role that myelin health plays in both normal and neuropathological conditions. Among commonly used myelin-sensitive markers, quantitative magnetization transfer-based metric, the macromolecular proton fraction (MPF), has been recognized and validated as a robust and specific myelin marker in neural tissue [1-3]. While other more clinically available metrics have also been shown to reflect myelin contrast, quantitative comparisons between these measures are still lacking.The current study aimed to compare two popular myelin proxies, the longitudinal relaxation rate (R1) and T1w/T2w image ratio, to assess their concordance with MPF across tissue types. Based on previous literature, we hypothesize that R1 is more robust in the white matter [4] while T1w/T2w is reliable in cortical grey matter only [5].
Methods
We scanned 40 healthy volunteers (age: 25 ± 3.5 years, 21 males/19 females) on a Siemens Prisma 3T scanner. Three-dimensional T1w MPRAGE and T2w SPACE sequences were acquired following the Human Connectome Project (HCP) Lifetime protocol with 0.8mm isotropic resolution (T1w: TR=2400ms; TE=2.24ms; FA=8°; T2w: TR=3200ms; TE=563ms). Structural images were processed using the HCP preprocessing pipelines to segment tissue types and generate T1w/T2w ratio images [6].The qMT protocol included two 3D variable-flip-angle spoiled gradient echo sequences (TR=21ms, TE=2.43ms, FA=4°/25°) and a 3D gradient echo MT-weighted sequence (TR=29ms, TE=2.43ms, FA=10°). Off-resonance MT saturation was achieved by applying a 12.3ms Gaussian pulse with an FA of 560° and offset frequency of 4kHz. The parameters were chosen according to a previously described fast single-point MPF mapping protocol [7, 8]. All qMT volumes were acquired with 1.5mm isotropic resolution. Additionally, B1+ and B0 field maps were estimated using the Siemens turboFLASH B1+ mapping sequence and the b=0 diffusion images. MPF and R1 were fitted in MATLAB using the two-pool model and a modified cross-relaxation fitting approach [8-11].
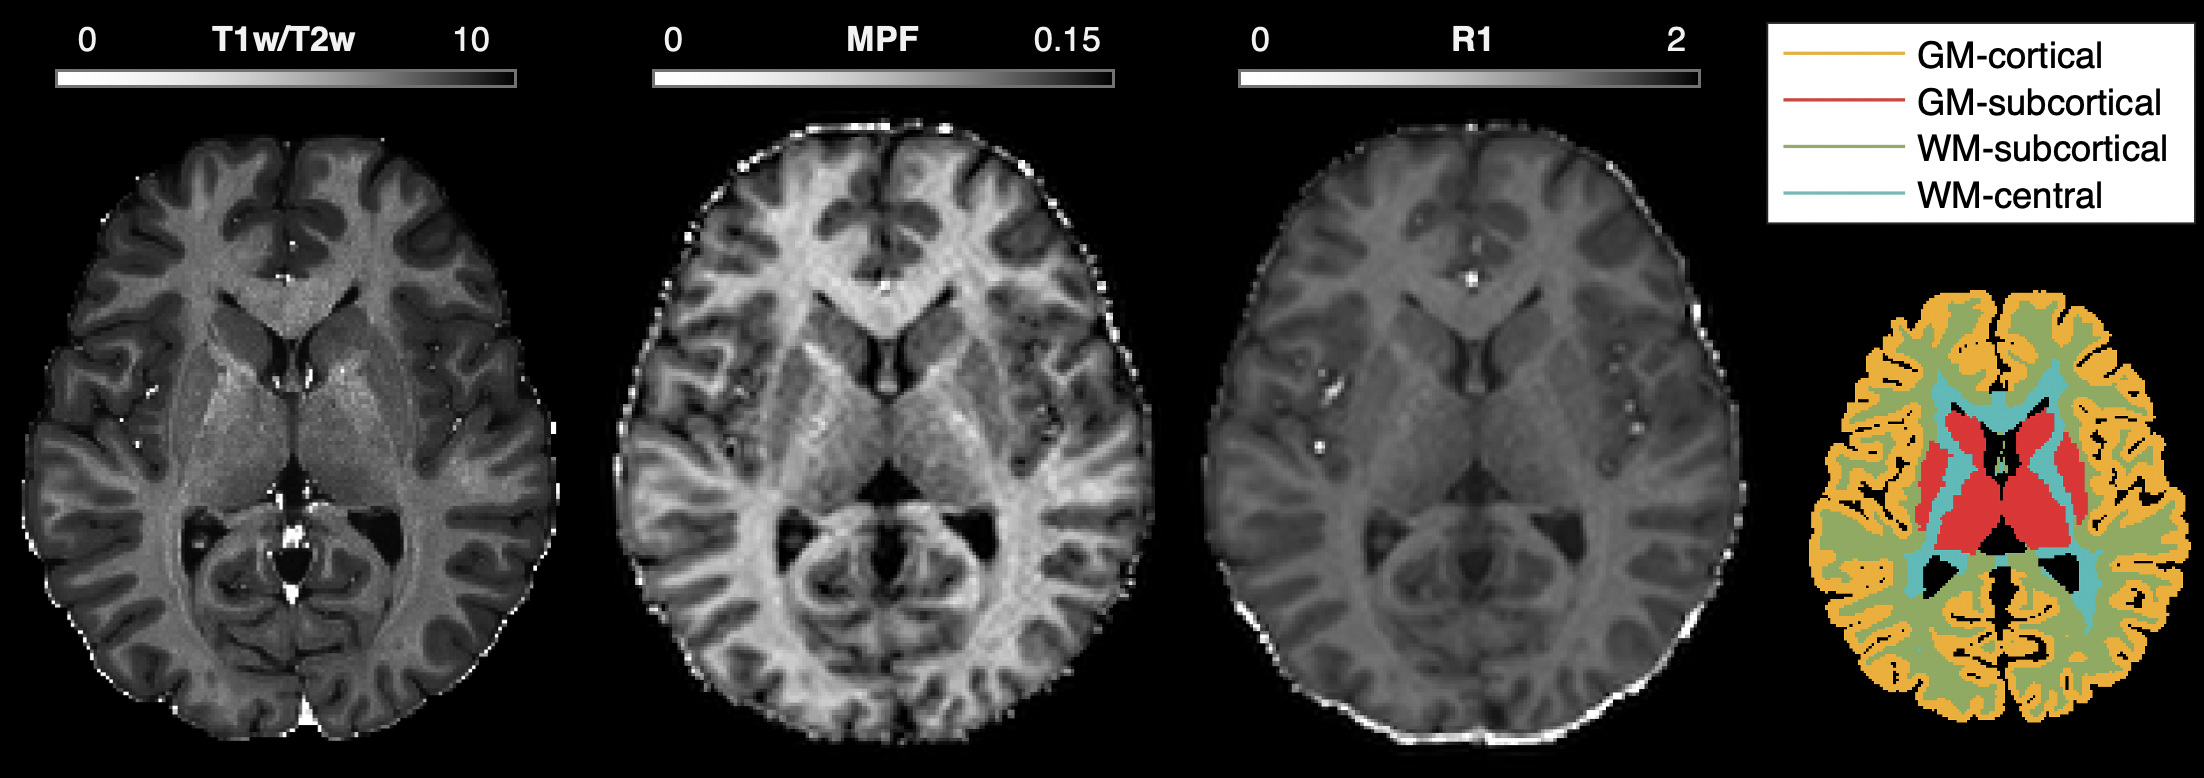
The FreeSurfer (Desikan-Killiany/aseg) and multimodal parcellation (MMP) [12] schemes were adopted for segmenting regions of interest (ROIs) across the brain and in cerebral cortex, respectively. Four tissue types were further examined, cortical and subcortical grey matter (GM), and subcortical and deep/central white matter (WM) (Fig.1). Regional average MPF, R1, and T1w/T2w were extracted. Pearson’s correlation and multivariate regression were used to compare metrics across regions and subjects.
Results
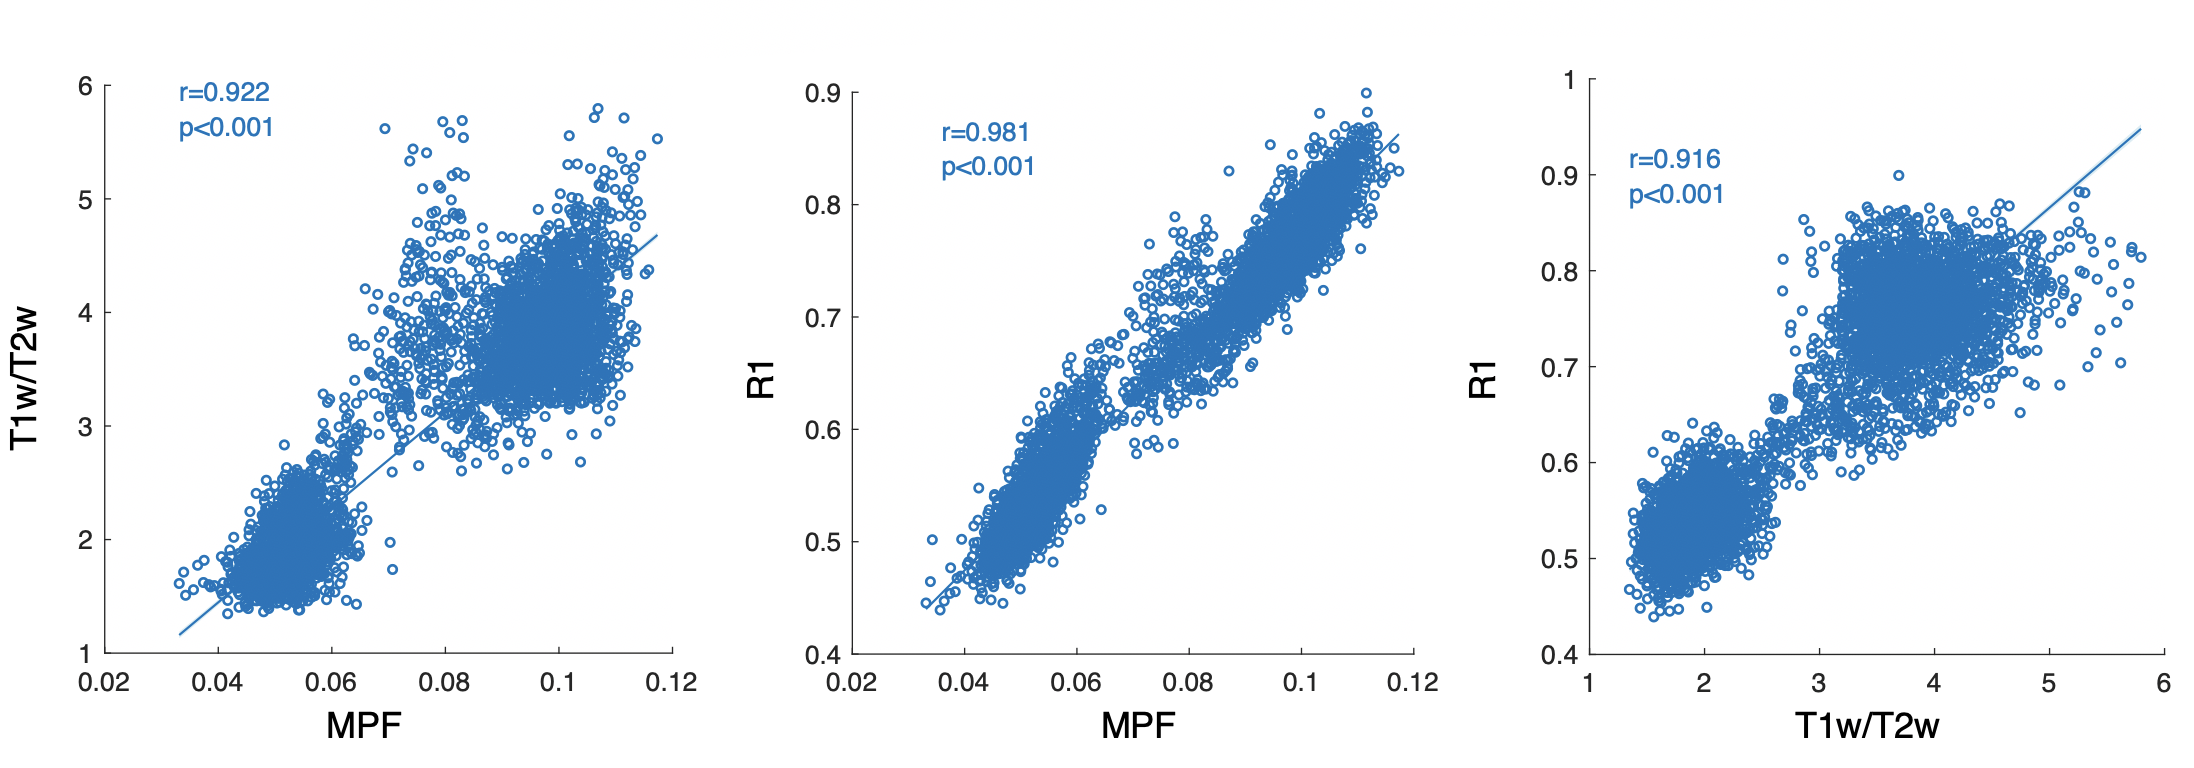
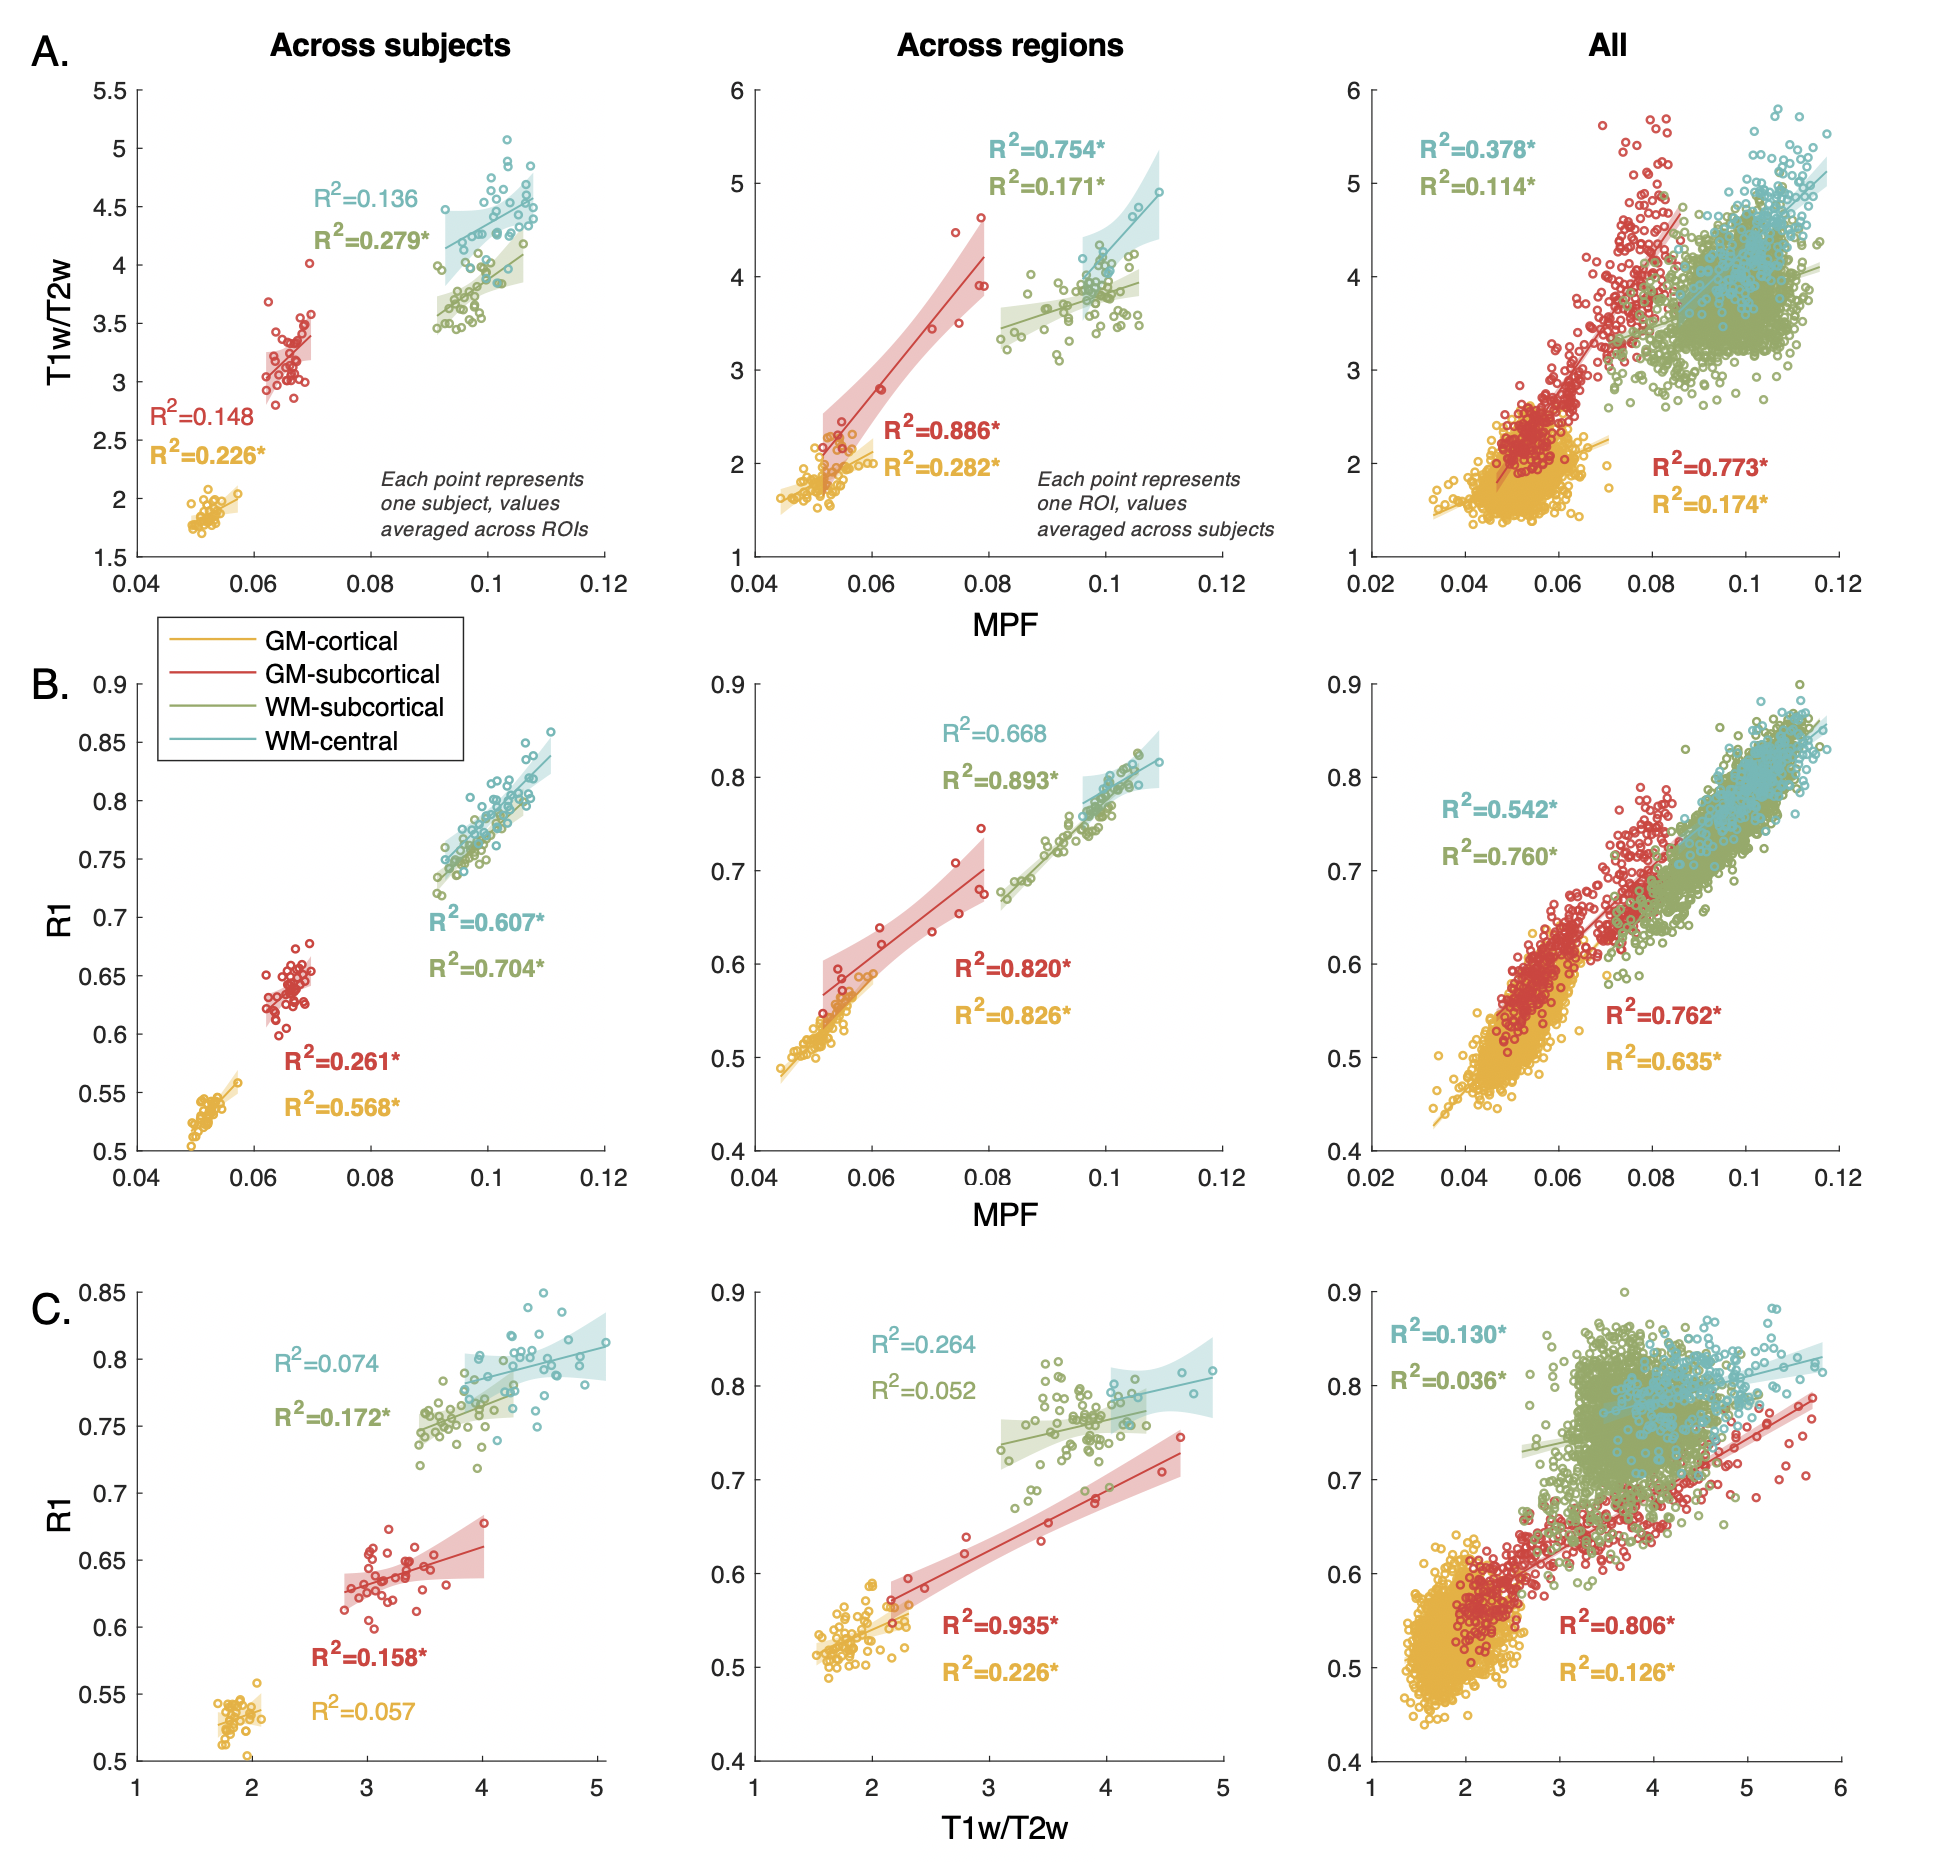
Across FreeSurfer defined ROIs over the whole brain, both R1 and T1w/T2w showed strong correlations with MPF and between each other (Fig.2).Analyses by tissue types revealed similarly strong associations between R1 and MPF across GM and WM regions, with comparable linear fitting line slopes. In comparison, T1w/T2w showed lower correlations with MPF and R1, particularly across subjects in subcortical GM structures and central WM, with varying linear fitting slopes across tissue types (Fig.3).
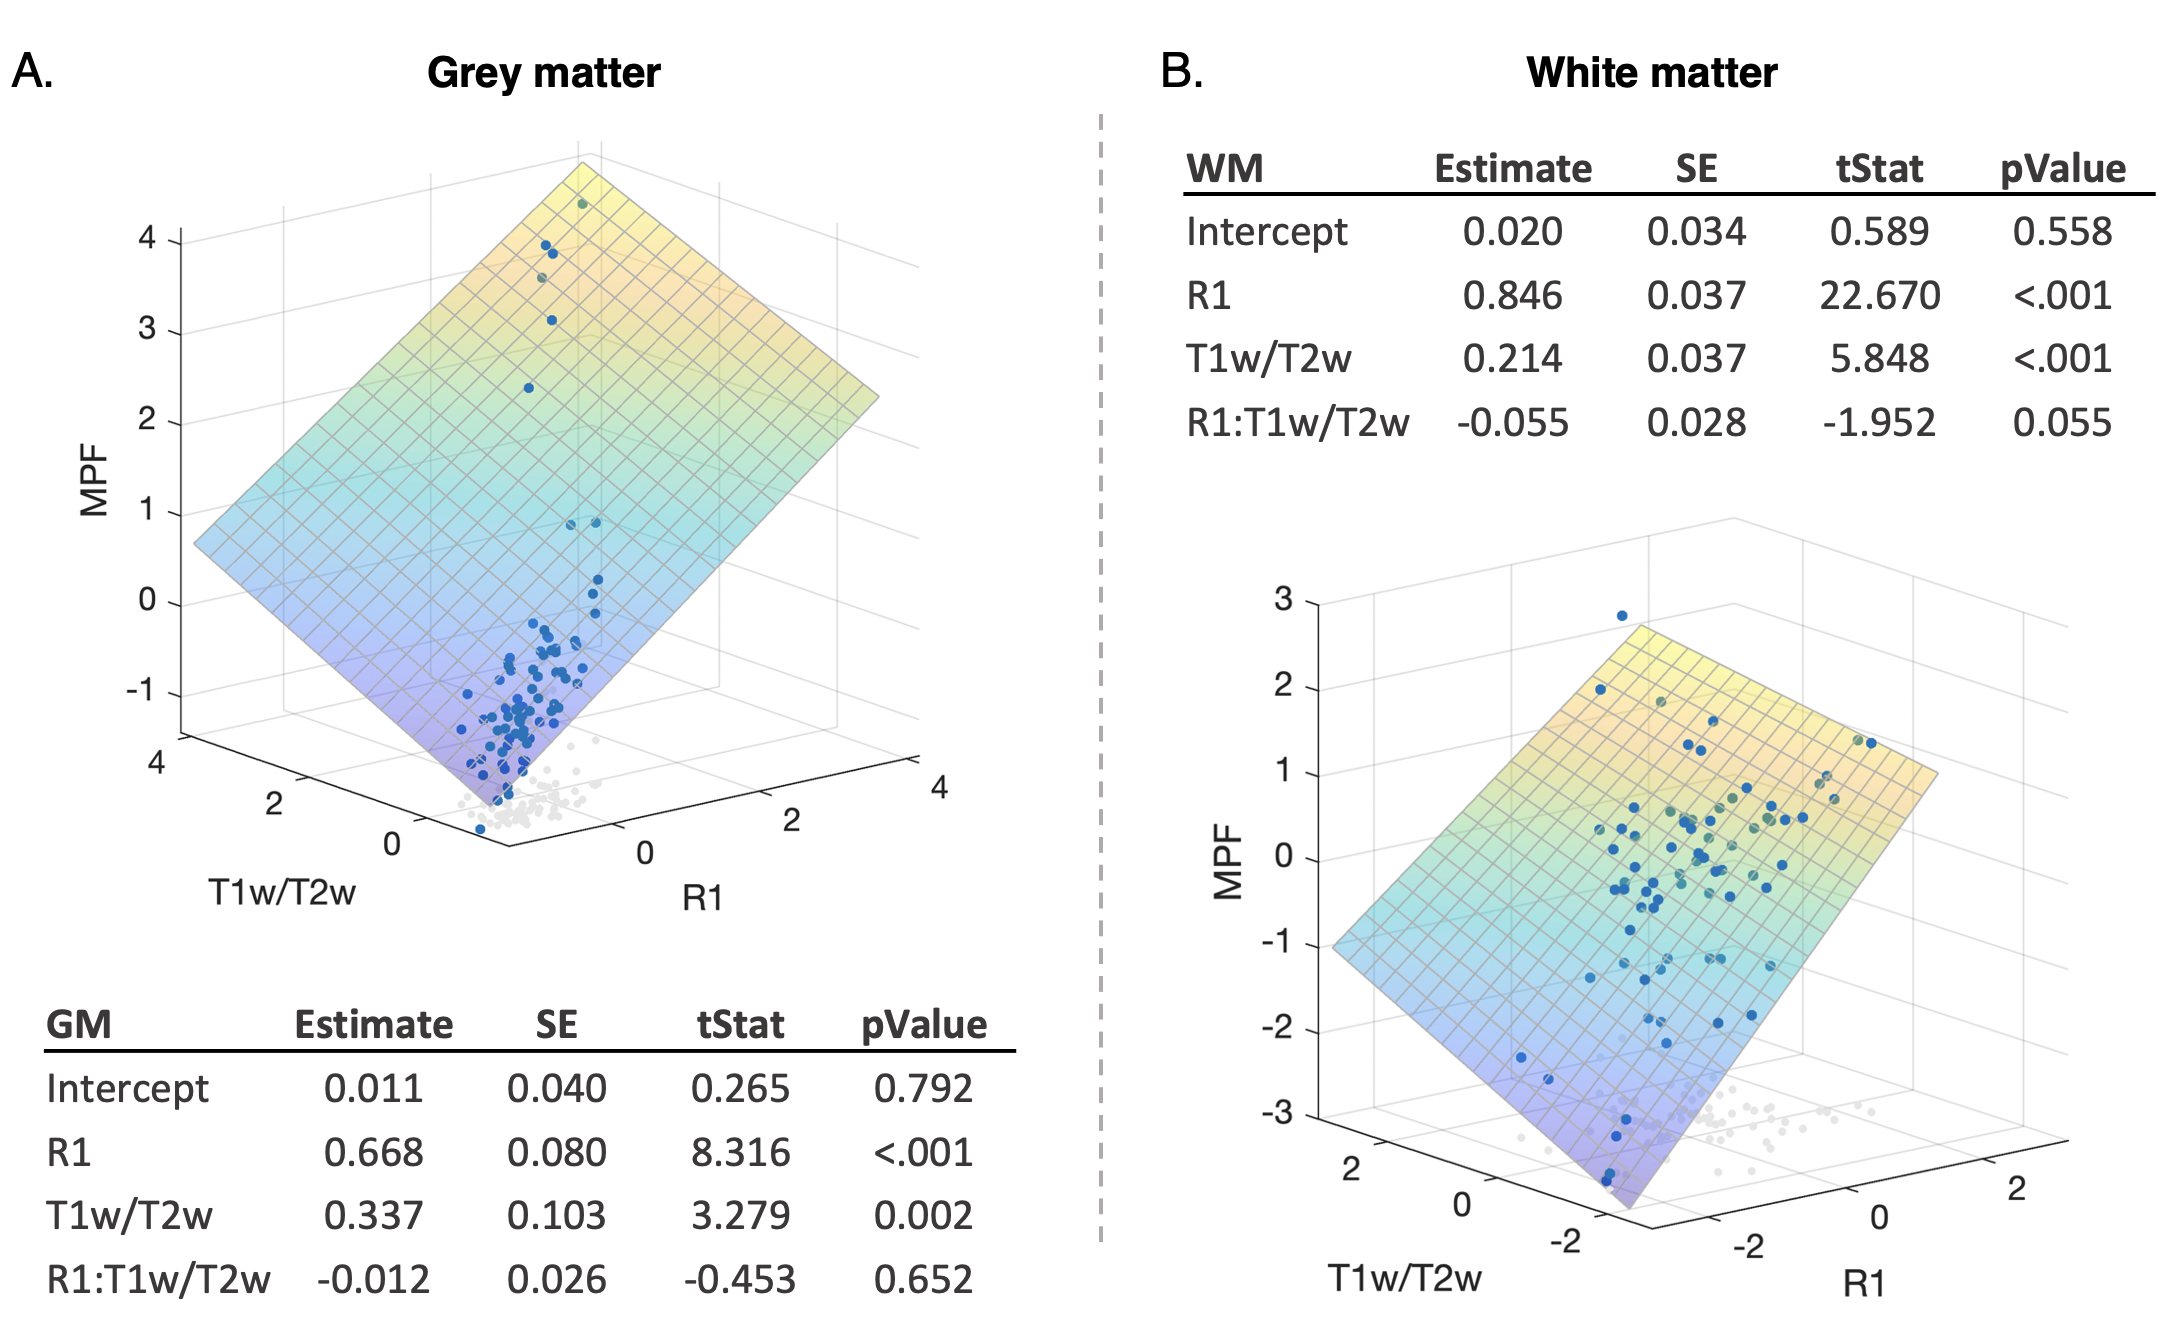
Multivariate regression further demonstrated that R1 shared more variance with MPF than T1w/T2w in all tissue types, particularly in WM regions (Fig.4A-B). A trend-level interaction effect was observed between R1 and T1w/T2w in white matter (p = 0.055), visualized by the warped multivariate fitting plane in Figure 4B.
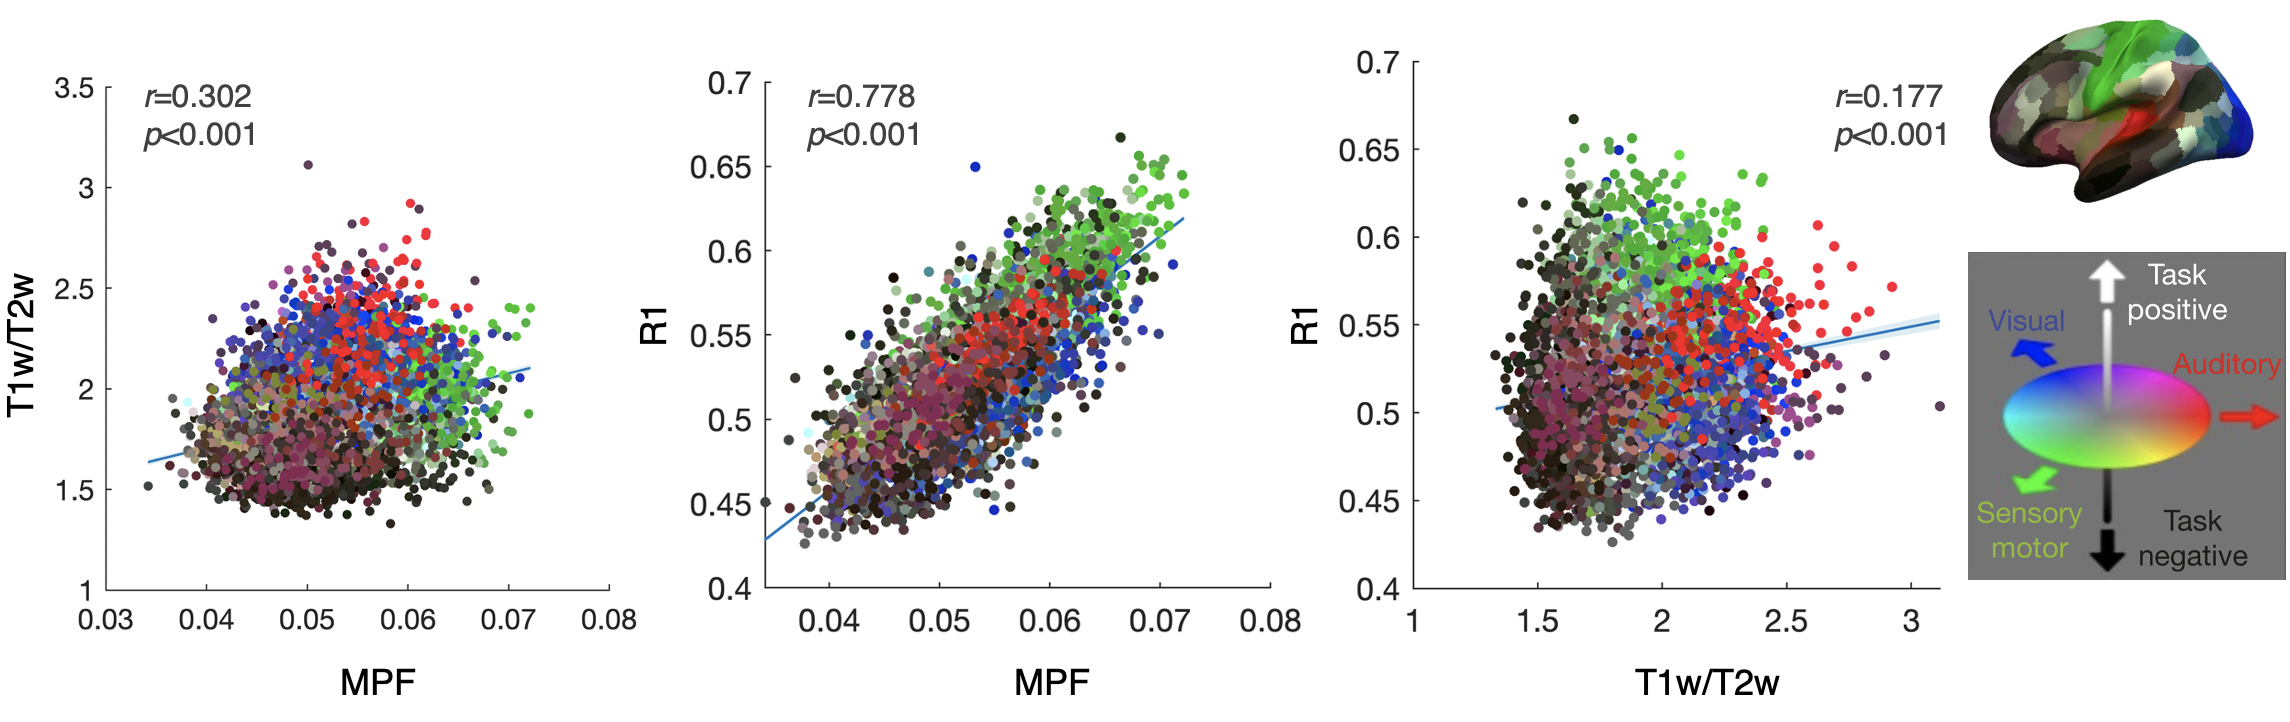
Lastly, across cortical GM ROIs segmented by the MMP, we saw overall good correspondence in all metrics with previous literature [13, 14]: primary regions (e.g., sensory motor, visual areas) showed higher myelin content compared to association areas (Fig.5). Consistently, correlation with MPF was much stronger for R1 than T1w/T2w.
Discussion
Both R1 and T1w/T2w shared a great amount of variance with MPF across the whole brain. When separating grey and white matter tissue types, the association between T1w/T2w and MPF varies as indicated by visible differences in fitting line slopes and the multivariate regression interaction effect in white matter. This suggests that T1w/T2w may be affected by various chemical and microstructural properties other than myelin, depending on the tissue type. In contrast, R1 showed overall good concordance with MPF, and the comparable line slopes further showcased R1’s reliability across the brain.In summary, R1 appears to be a robust marker of myelin across brain tissue types while T1w/T2w is reasonably reliable in cortical grey matter and adjacent (subcortical) white matter. As iron is known to affect T2 more than T1 [4], T1w/T2w may bear more confounds as a myelin measure. Nevertheless, both can be influenced by the presence of non-heme brain iron, therefore the colocalization of iron and myelin in the cortex [15] may also contribute to the concordance observed among metrics. The current interpretation is made under the assumption that MPF provides an accurate measurement of myelin . Future studies comparing measurements from other modalities will be important to confirm these findings.
Acknowledgements
This work was supported by the NIH awards R01 MH108962 and R01 EB027087 and was performed under the rubric of the Center for Advanced Imaging Innovation and Research (CAI2R, www.cai2r.net), an NIBIB National Center for Biomedical Imaging and Bioengineering (NIH P41 EB017183). We thank all participants for their contribution to the study.References
1. Mancini, M., et al., An interactive meta-analysis of MRI biomarkers of myelin. Elife, 2020. 9.
2. Yarnykh, V.L., et al., Fast whole-brain three-dimensional macromolecular proton fraction mapping in multiple sclerosis. Radiology, 2015. 274(1): p. 210-20.
3. Samsonov, A.A., et al., Quantitative MR imaging of two-pool magnetization transfer model parameters in myelin mutant shaking pup. Neuroimage, 2012. 62(3): p. 1390-8.
4. Stuber, C., et al., Myelin and iron concentration in the human brain: a quantitative study of MRI contrast. Neuroimage, 2014. 93 Pt 1: p. 95-106.
5. Glasser, M.F. and D.C. Van Essen, Mapping human cortical areas in vivo based on myelin content as revealed by T1- and T2-weighted MRI. J Neurosci, 2011. 31(32): p. 11597-616.
6. Glasser, M.F., et al., The minimal preprocessing pipelines for the Human Connectome Project. Neuroimage, 2013. 80: p. 105-24.
7. Yarnykh, V.L., Time-efficient, high-resolution, whole brain three-dimensional macromolecular proton fraction mapping. Magn Reson Med, 2016. 75(5): p. 2100-6.
8. Yarnykh, V.L., Fast macromolecular proton fraction mapping from a single off-resonance magnetization transfer measurement. Magn Reson Med, 2012. 68(1): p. 166-78.
9. Samsonov, A.A., et al., High Resolution, Motion Corrected Mapping of Macromolecular Proton Fraction (MPF). Clinically Acceptable Time Using 3D Undersampled Radials, in In Proc of ISMRM. 2014. p. 3337.
10. Mossahebi, P., V.L. Yarnykh, and A. Samsonov, Analysis and correction of biases in cross-relaxation MRI due to biexponential longitudinal relaxation. Magn Reson Med, 2014. 71(2): p. 830-8.
11. Henkelman, R.M., et al., Quantitative interpretation of magnetization transfer. Magn Reson Med, 1993. 29(6): p. 759-66.
12. Glasser, M.F., et al., A multi-modal parcellation of human cerebral cortex. Nature, 2016. 536(7615): p. 171-178.
13. Glasser, M.F., et al., Trends and properties of human cerebral cortex: correlations with cortical myelin content. Neuroimage, 2014. 93 Pt 2: p. 165-75.
14. Nieuwenhuys, R., The myeloarchitectonic studies on the human cerebral cortex of the Vogt-Vogt school, and their significance for the interpretation of functional neuroimaging data. Brain Struct Funct, 2013. 218(2): p. 303-52.
15. Fukunaga, M., et al., Layer-specific variation of iron content in cerebral cortex as a source of MRI contrast. Proc Natl Acad Sci U S A, 2010. 107(8): p. 3834-9.
Figures