2916
Multi-Site Harmonization of Xe-129 MRI of Gas-Exchange & Ventilation: Clinical Study with E-Cigarette Users1Radiology & Medical Imaging, University of Virginia, Charlottesville, VA, United States, 2Radiology, Duke University, Durham, NC, United States, 3Medicine, University of Virginia, Charlottesville, VA, United States
Synopsis
Keywords: Lung, Hyperpolarized MR (Gas)
Motivation: Study on the effects of e-cigarette use is needed to understand its damaging effects on the pulmonary system.
Goal(s): Anticipating a need for multi-center clinical trials in the future this study, performed for the first time, studied the repeatability of Xe-129 gas-exchange MRI of the same subjects at two centers.
Approach: Same subjects were imaged at University of Virginia and Duke University to directly assess technique harmonization and repeatability of Xe-129 metrics.
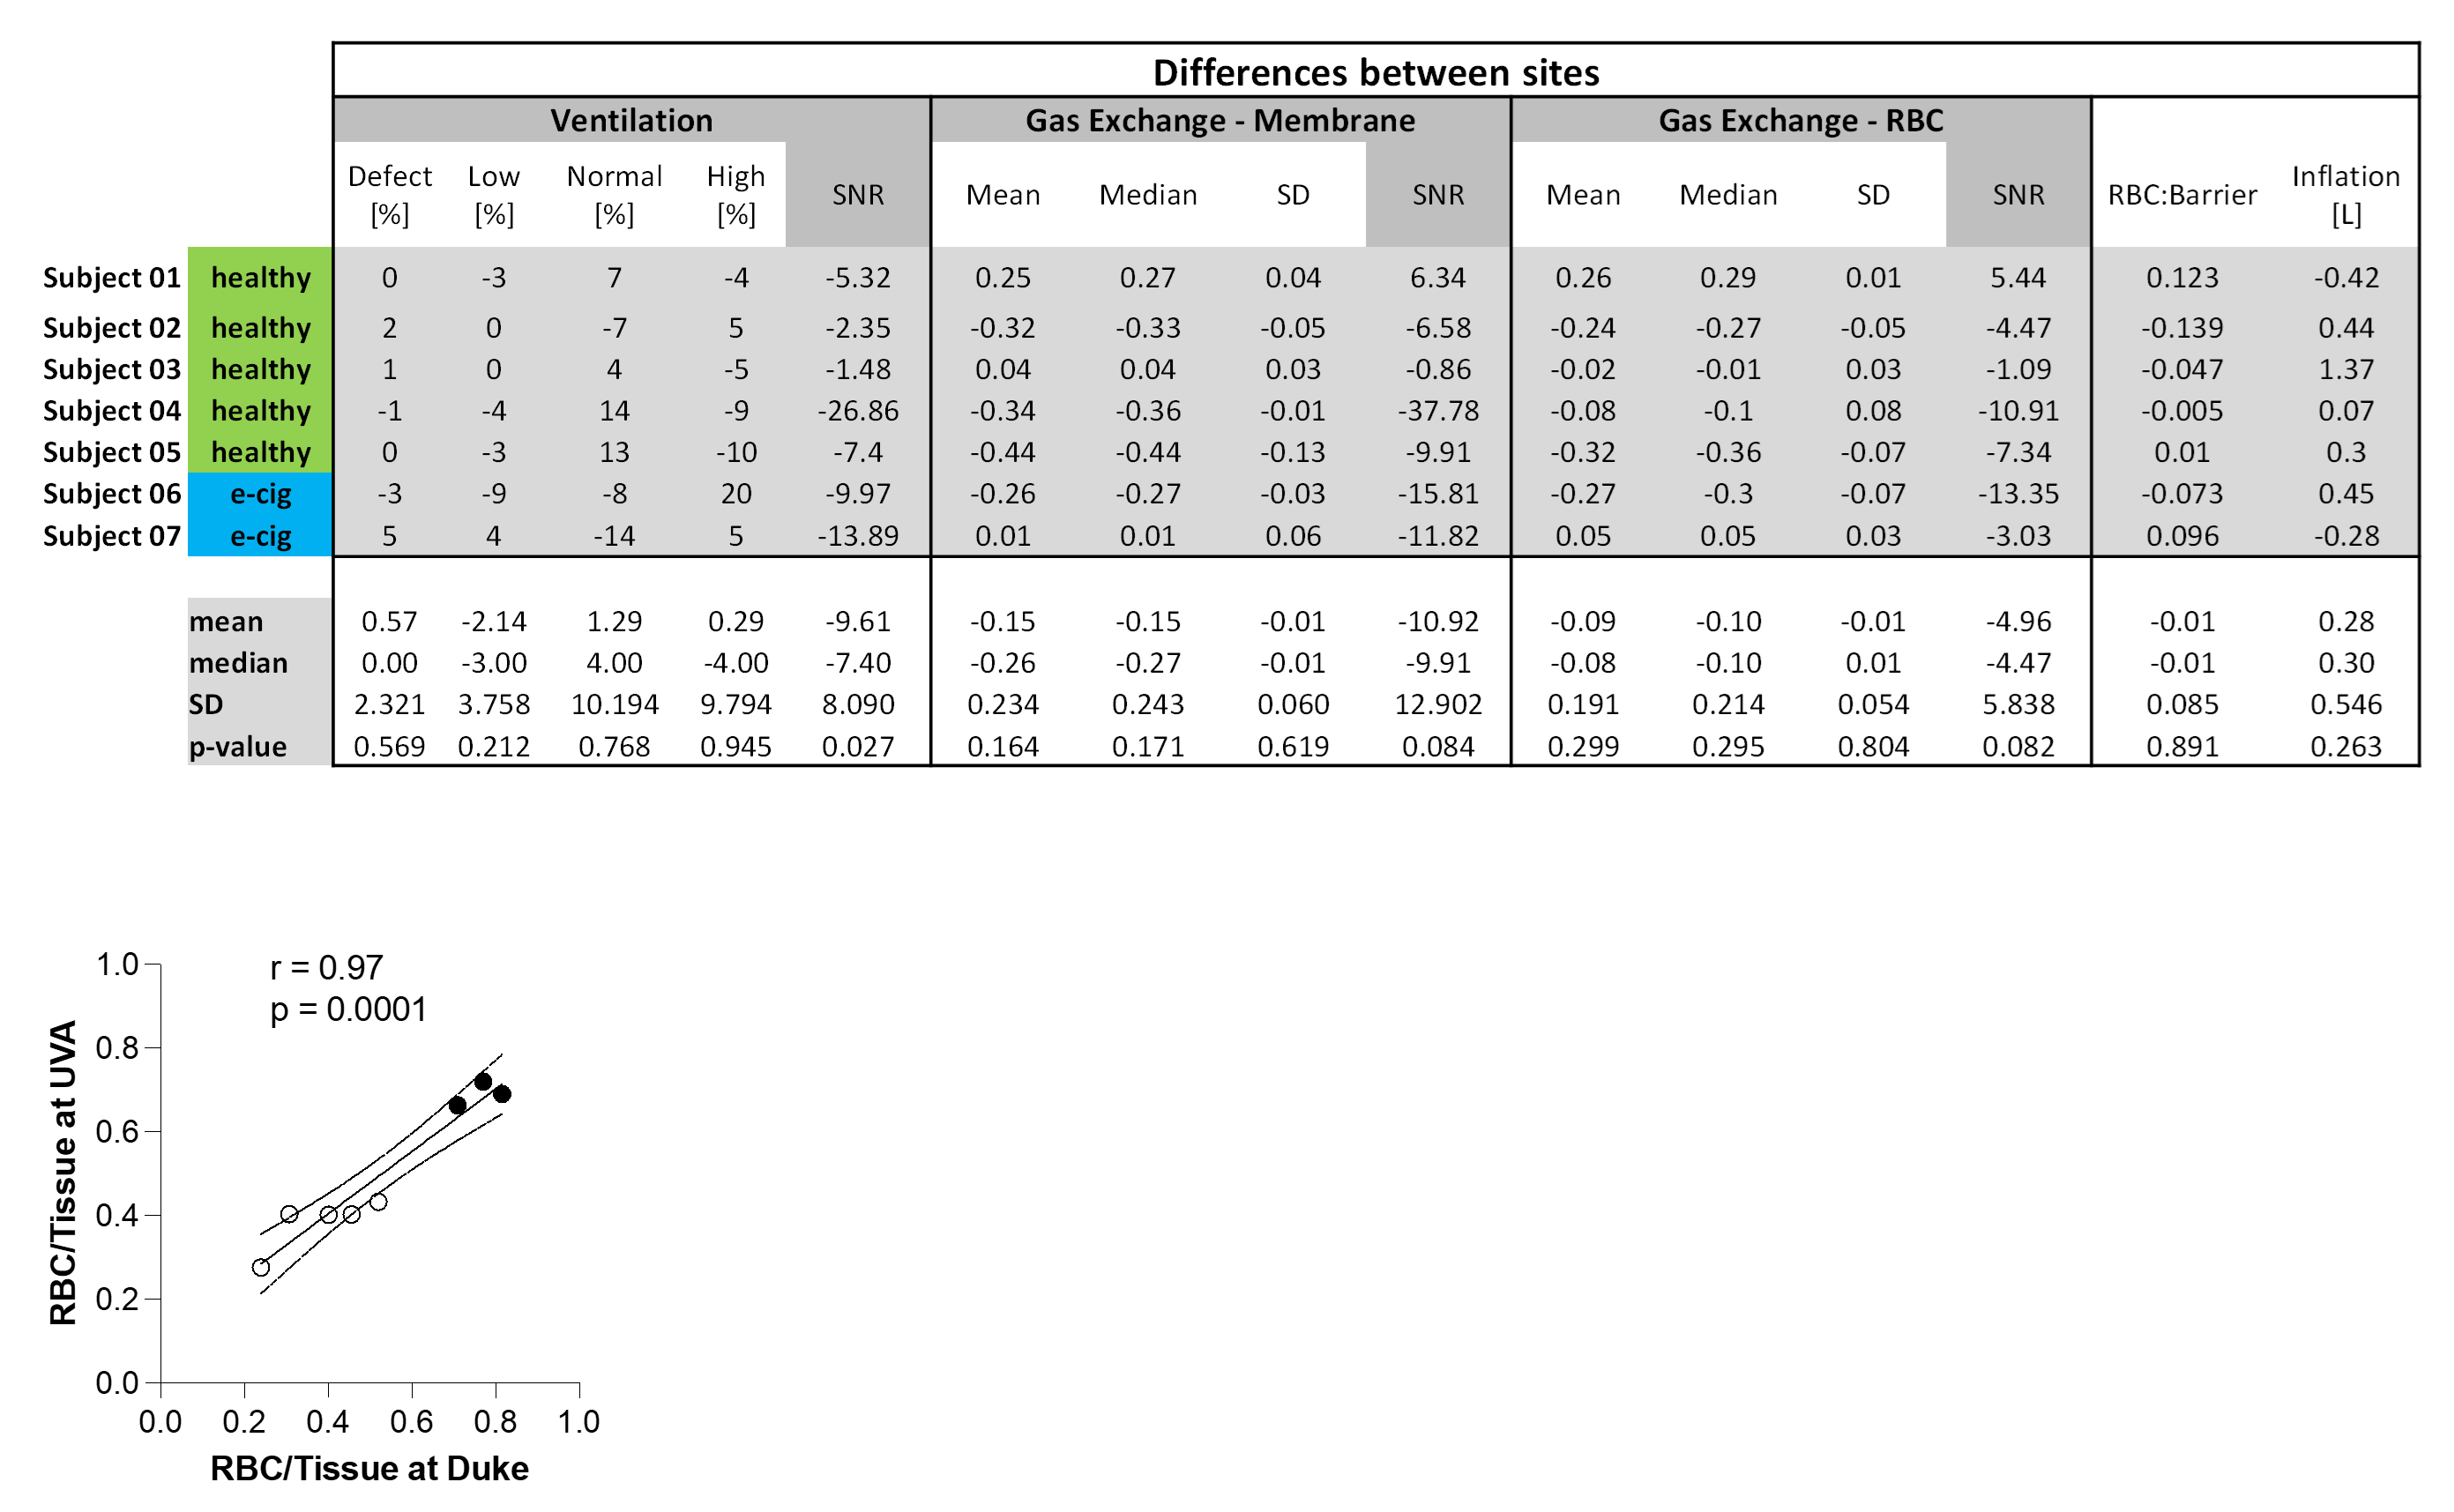
Results: Note the statistically insignificant differences for each subject, for ventilation and gas-exchange, with signal-to-noise ratio for ventilation scans being the only statistically significant parameter (p=0.027) to differ between the sites.
Impact: Harmonization of Xe-129 MRI gas-exchange and ventilation imaging methodology among the two sites was successfully achieved, opening the way for a large clinical trial with these two institutions.
Introduction
Electronic-cigarette (e-cigarette) use is classified by the Centers for Disease Control and Prevention as unsafe and is associated with outbreaks of severe lung injury1. Besides nicotine, which is highly addictive, e-cigarettes contain harmful unregulated substances. A detailed study on the effects of e-cigarette use is needed to understand its damaging effects on the pulmonary system. MRI using hyperpolarized xenon-129 (Xe-129) gas is an FDA-approved, emerging technology capable of providing, in a single breath-hold, detailed ventilation images of the lungs as well as physiological maps of Xe-129 distribution into multiple lung compartments (gas-exchange imaging), specifically into lung parenchyma (membrane) and red-blood-cells (RBC)2,3,4. Xe-129 MRI studies in healthy subjects and “healthy smokers” discriminated between these two groups before spirometry detected loss of lung function5, suggesting that Xe-129 MRI is a sensitive tool for detecting early-stage lung disease. The current study is the first step to exploit the potential of Xe-129 MRI ventilation and gas-exchange parameters to detect lung disease occurring in the early days of e-cigarette use. Anticipating a need for multi-center clinical trials in the future, this study performed for the first time, repeatability studies of Xe-129 gas-exchange MR imaging of the same subjects at two centers.Methods & Materials
This two-site clinical trial used Xe-129 MRI for ventilation and gas-exchange imaging to probe multiple lung compartments (air spaces, membrane and RBC). The same subjects were imaged at the University of Virginia and Duke University to directly assess technique harmonization and repeatability of Xe-129 metrics. Five healthy volunteers (three females and two males; 25.2±2.8 years) and two e-cigarette users (one female and one male; 19.5±0.5 years) underwent Xe-129 MRI studies at both institutions. Each healthy volunteer was rescanned within two months and each e-cigarette user within a month. E-cigarette users had used e-cigarettes on a regular basis (minimum of one pod per week) for at least 12 months. MRI techniques for scanner calibration (repeated acquisition of free-induction-decays), ventilation imaging (multi-slice Cartesian gradient echo) and three-dimensional gas-exchange imaging (1-point Dixon spectroscopic imaging) were implemented as recommended by the 129Xe MRI Clinical Trials Consortium6. To facilitate harmonization, each technique was implemented by an investigator at one institution for the two MR scanners involved (Duke University: Siemens Prisma Fit, software Numaris/X VA30A; University of Virginia: Siemens Prisma Fit, software Numaris/4 VE11C). To maximize consistency, the same source-code base was used for the implementation at both sites, even though the software levels were different. Ventilation and gas-exchange imaging post-processing, using the binning method, was performed at Duke University. Secondary statistical analyses were done at the University of Virginia, using paired t-test for the comparisons. Each site polarized Xe-129 using a commercial polarizer (model Xe9820, Polarean Inc, USA), achieving polarizations of 25-30%, and employed identical commercially available RF vest-coils tuned to the Xe-129 frequency at 3 Tesla (Clinical MR Solutions, USA). The total volume of Xe-129 gas mixed with nitrogen was approximately 20% of the subject’s forced vital capacity, measured by spirometry immediately prior to the MRI scan.Results
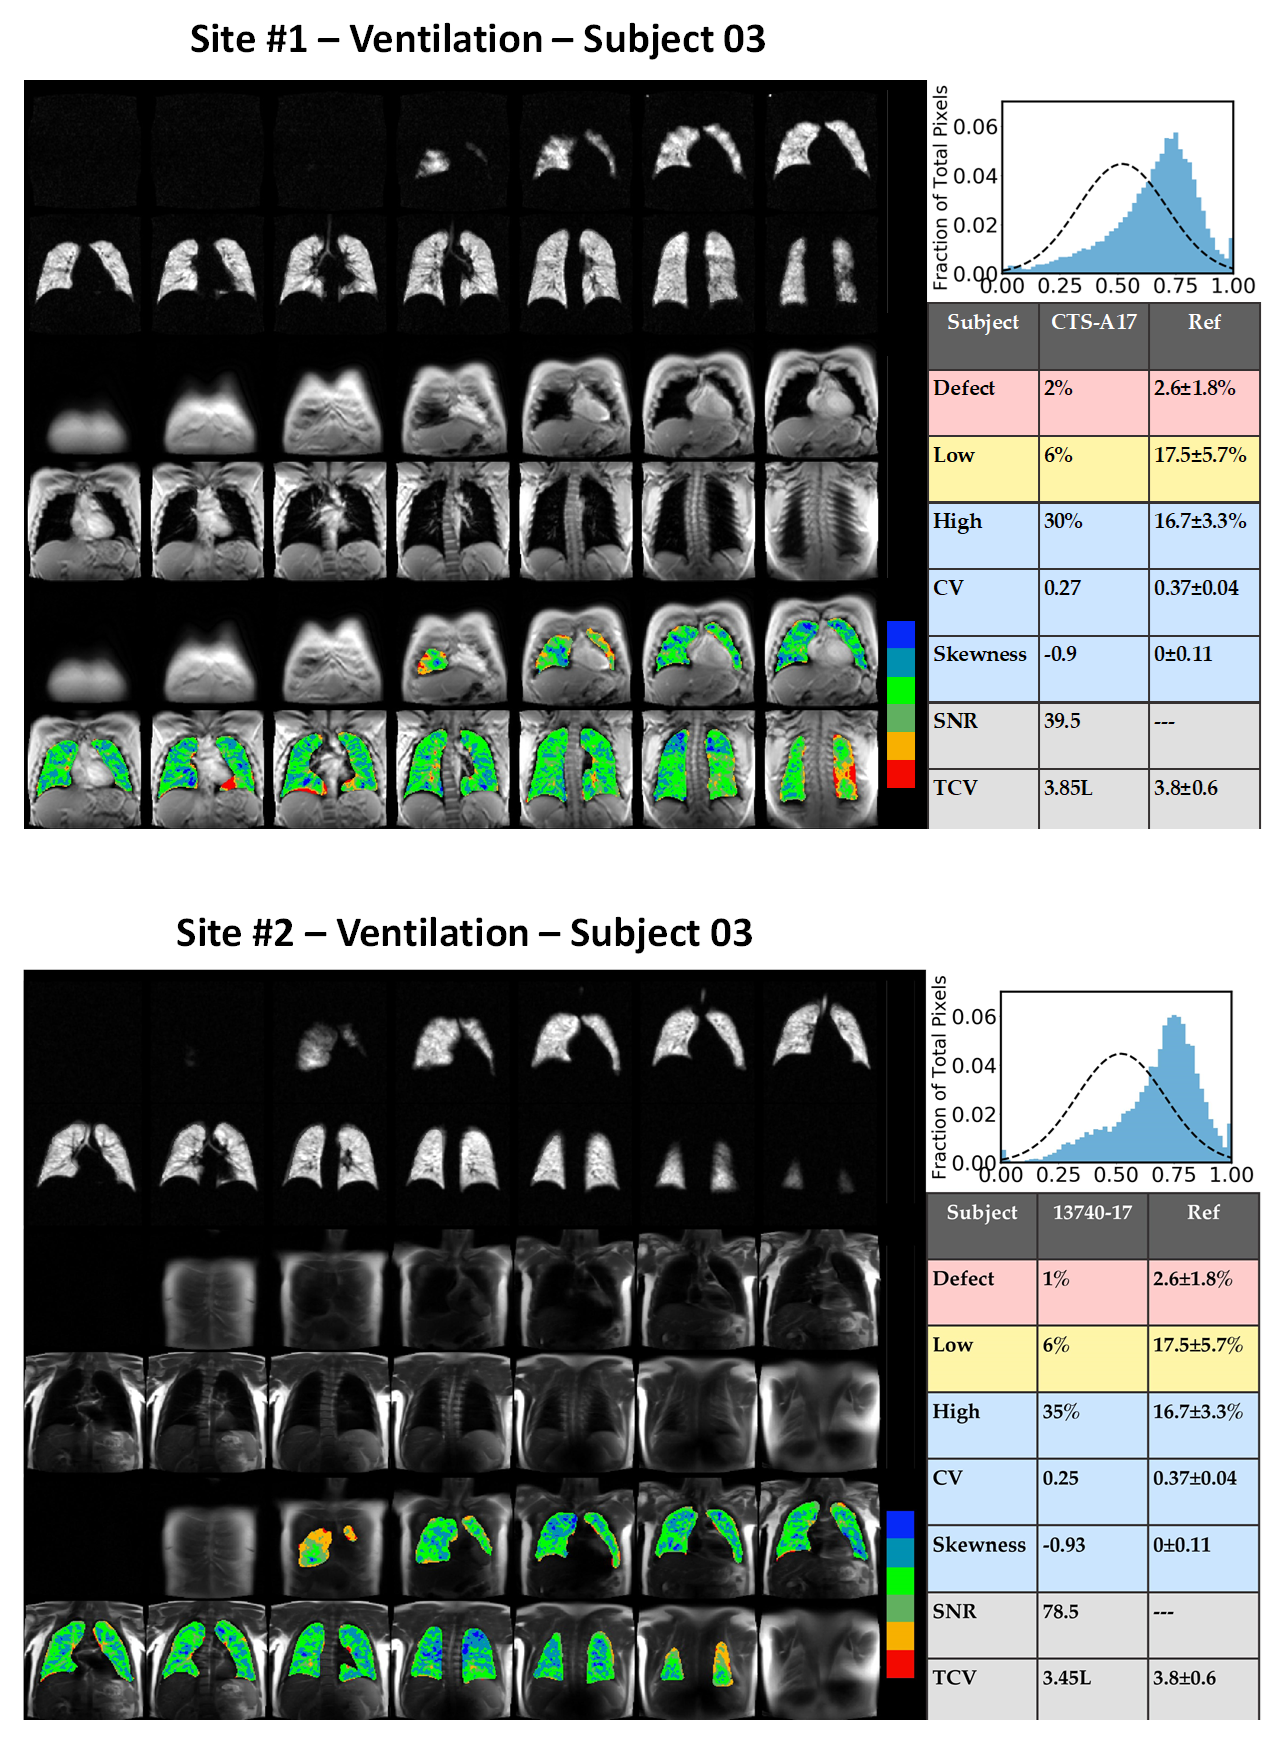
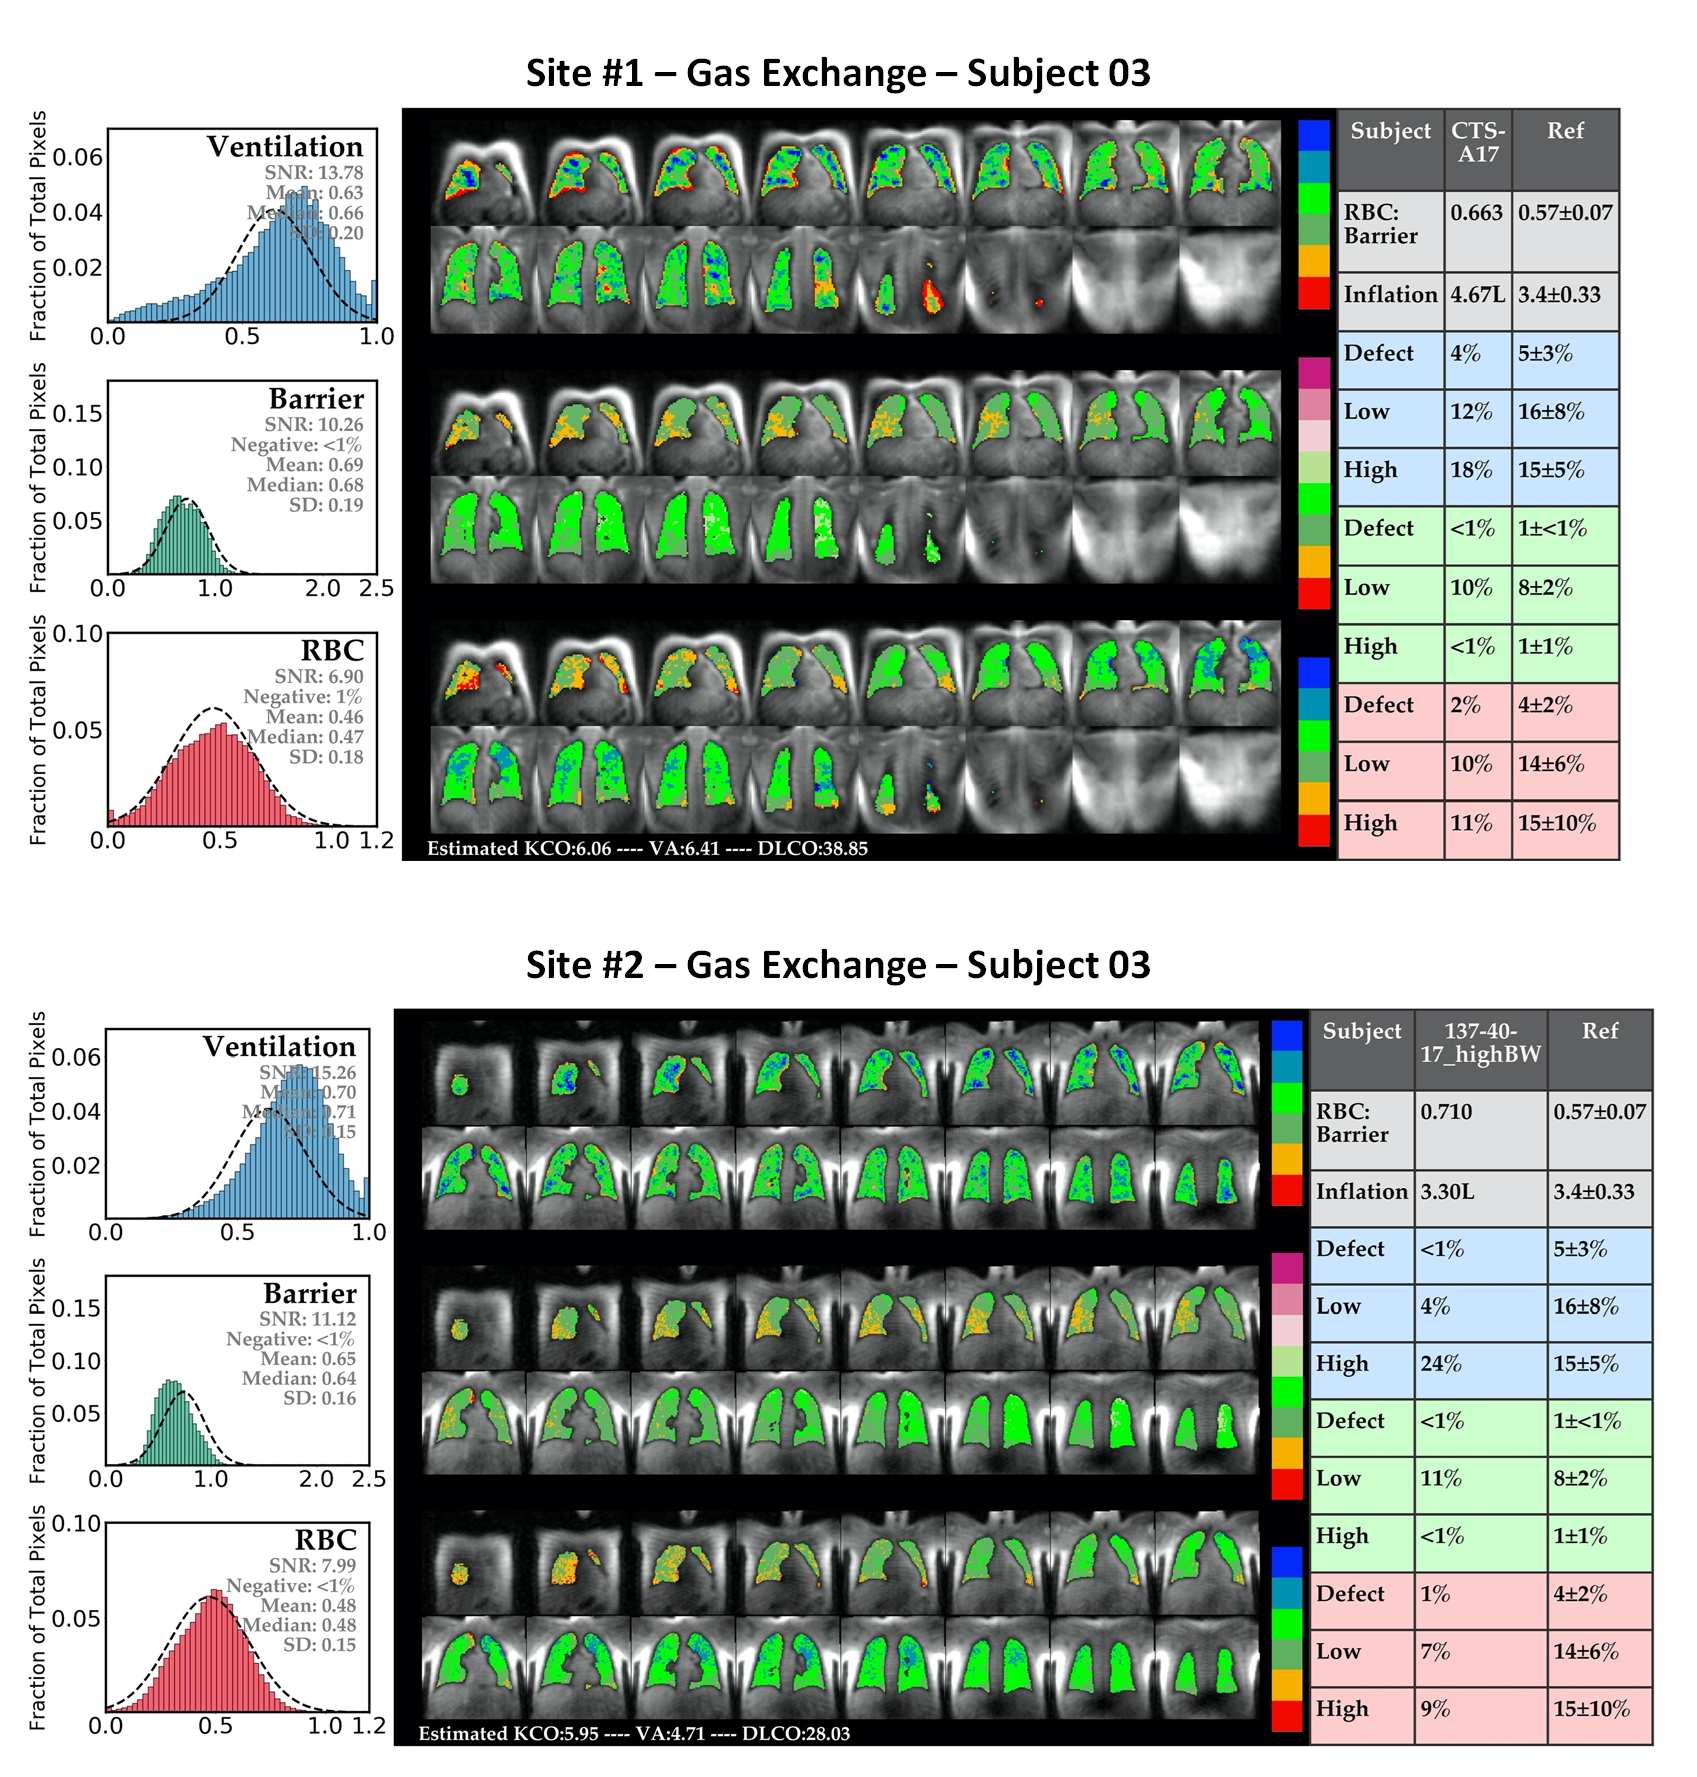
Figures 1 and 2 show ventilation and gas-exchange results, respectively, for the same subject from both sites, including detailed global analyses. Note the very similar values and images from both sites. The table in Figure 3 shows the quantitative differences between global-analysis metrics from each site for each subject (value from Duke University subtracted from value from University of Virginia). Note the statistically insignificant differences for each subject, for ventilation and for gas-exchange, with signal-to-noise ratio for the ventilation scans being the only statistically significant parameter (p=0.027) to differ between the sites. While differences between the two sites were small, consistent bias of gas exchange parameters were noted (plot in Figure 3), with Duke University values being higher than those from University of Virginia. This might be explained by differences in lung-inflation level; for 5 of 7 subjects, the lung inflation level was higher at the University of Virginia.Conclusion
Harmonization of Xe-129 MRI gas-exchange and ventilation imaging methodology among the two sites was successfully achieved, opening the way for a large clinical trial with these two institutions.Acknowledgements
The authors would like to thank all our nurses, research coordinators, MRI technologists and other staff for their work.References
1- https://www.cdc.gov/tobacco/basic_information/e-cigarettes/Quick-Facts-on-the-Risks-of-E-cigarettes-for-Kids-Teens-and-Young-Adults.html
2-Driehuys B, Martinez-Jimenez S, Cleveland Z, et al. Safety and tolerability of hyperpolarized 129Xe MR imaging in healthy volunteers and patients. Radiology 2012;262:279-89.
3-Joseph G. Mammarappallil, EM, et al. Identification of gas exchange phenotypes using hyperpolarized 129Xe MRI in patients with chronic obstructive pulmonary disease (COPD). Am J Respir Crit Care Med 2019; 199:A1122.
4- Guan S, Tustison N, Qing K, et al. 3D Single-Breath Chemical Shift Imaging Hyperpolarized Xe-129 MRI of Healthy, CF, IPF, and COPD Subjects. Tomography 2022; 8(5):2574-2587.
5- Qing K, Tustison NJ, Mugler JP III, et al. Probing changes in lung physiology in COPD using CT, perfusion MRI, and hyperpolarized Xenon-129 MRI. Acad Radiol 2019; 26:326-34.
6- Niedbalski PJ, Hall CS, Castro M, et al. Protocols for multi-site trials using hyperpolarized 129Xe MRI for imaging of ventilation, alveolar-airspace size, and gas exchange: A position paper from the 129Xe MRI clinical trials consortium. Magn Reson Med 2021; 86:2966-2986.
Figures