2913
129Xe lung ventilation imaging in patients with long COVID without prior respiratory disease1The University of Sheffield, Sheffield, United Kingdom, 2National Institute for Health Research (NIHR) Sheffield Biomedical Research Centre (BRC), Sheffield Teaching Hospitals, Sheffield, United Kingdom, 3The University of Manchester, Manchester, United Kingdom
Synopsis
Keywords: Lung, COVID-19
Motivation: It is unclear the extent to which abnormal lung ventilation is present in long COVID subjects without prior respiratory diseases.
Goal(s): Evaluate 129Xe lung ventilation imaging in a cohort without prior respiratory disease, consisting of patients with long COVID (with and without dyspnea) and controls.
Approach: 60 patients with long COVID (53 with dyspnea, 7 without dyspnea) and 20 controls underwent successful ventilation imaging and were included in analysis.
Results: 129Xe ventilation imaging metrics did not find significant differences between controls and patients with long COVID, however a subset of long COVID patients with dyspnea had lung ventilation defects despite normal PFTs.
Impact: Impact (40 words): The majority of patients with long COVID have normal 129Xe lung ventilation imaging. 129Xe ventilation imaging may be able to identify candidates with long COVID who may be candidates for treatments targeted at airways disease.
Introduction
Persistent symptoms after COVID-19, known as long COVID, have been widely reported and dyspnoea is one of the most reported pulmonary symptoms1. 129Xe ventilation MRI can visualise and quantify lung ventilation abnormalities. Ventilation defects have been found in patients who were hospitalised due to COVID-192, with higher ventilation defect percentage (VDP) found in patients who were hospitalised compared to those who were not hospitalised3. Improvements in VDP in participants with post-acute COVID-19 syndrome have been found to correlate with improved exercise capacity4. However it is unclear the extent to which abnormal lung ventilation is present in long COVID subjects without prior respiratory disease4,5.In this work, we evaluate 129Xe lung ventilation imaging in a cohort without prior respiratory disease, consisting of:
i) non hospitalised patients with long COVID and dyspnea
ii) non hospitalised patients with long COVID without dyspnea
iii) controls who had no ongoing symptoms at 12 weeks after COVID-19 infection.
Methods
Non-hospitalised long COVID patients were recruited from post-COVID clinics in Sheffield and Manchester. Control subjects who had had COVID-19 and fully recovered were also recruited. Subjects with smoking history >10 years, previous respiratory illness or with lung abnormalities on CT imaging were excluded. Subjects were recruited as part of the EXPLAIN study (COV-LT2-0049). Patients had same day PFTs, where possible.129Xe ventilation imaging was acquired using a 3D bSSFP sequence at 1.5T following the inhalation of a 1L dose comprising a 50:50 129Xe:N2 gas mixture, inhaled from functional residual capacity6. A structural 1H scan was acquired following inhalation of a bag of air.
Metrics of ventilation defect percentage (VDP), low ventilation percentage (LVP), normal ventilation percentage (NVP), and hyper-ventilated percentage (HVP) were calculated using linear binning analysis7. Ventilation heterogeneity index (VHI) was also calculated8. VDP in the peripheral and proximal lung was calculated by splitting the lung cavity mask into a peripheral and proximal mask9,10, with each mask comprising 50% of the total number of voxels.
Groupwise statistical tests were performed using SPSS 28 (IBM SPSS Statistics) using Kruskal-Wallis tests or Mann-Whitney U tests. Differences in the proportion of subjects with abnormal ventilation were calculated a Chi-Square test. Correlations were tested using Spearman’s correlation coefficient and data from all subjects.
Results
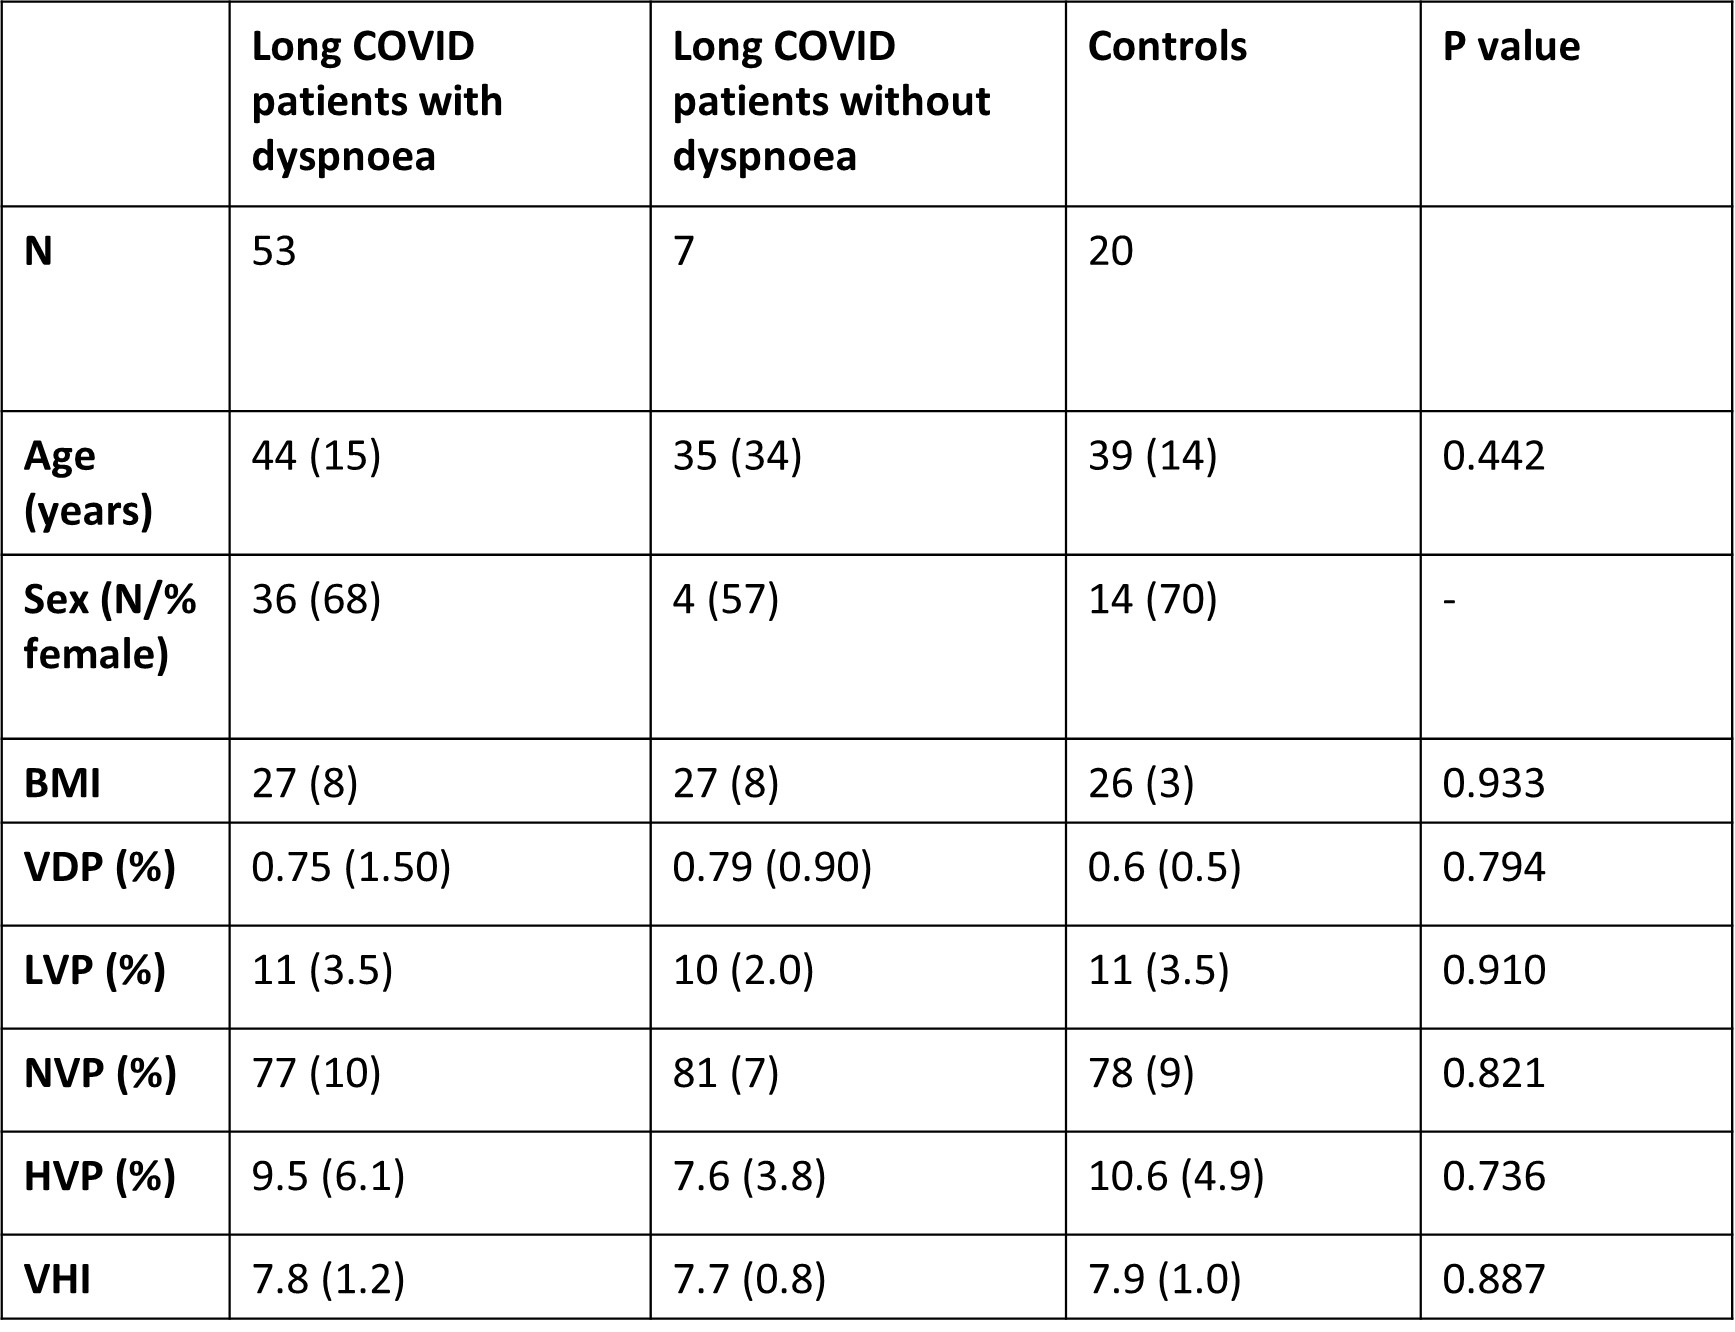
60 patients with long COVID (53 with dyspnoea, 7 without dyspnoea) and 20 controls underwent successful ventilation imaging and were included in this analysis. Median (IQR) time between COVID-19 infection and MRI was 380(495) days.No significant differences in ventilation metrics were found between groups (Table 1).
A significant correlation between VDP and age was found (r=0.332, p=0.007). When split by patient group, a significant correlation between VDP and age was found in patients with long COVID and dyspnea (p=0.014) but not in long COVID patients without breathlessness or controls (p=0.337, p=0.599). All subjects had a smoking history <10 pack years (median 1.75 pack years, n=16), and subjects with a smoking history did not have significantly higher VDP than those without.
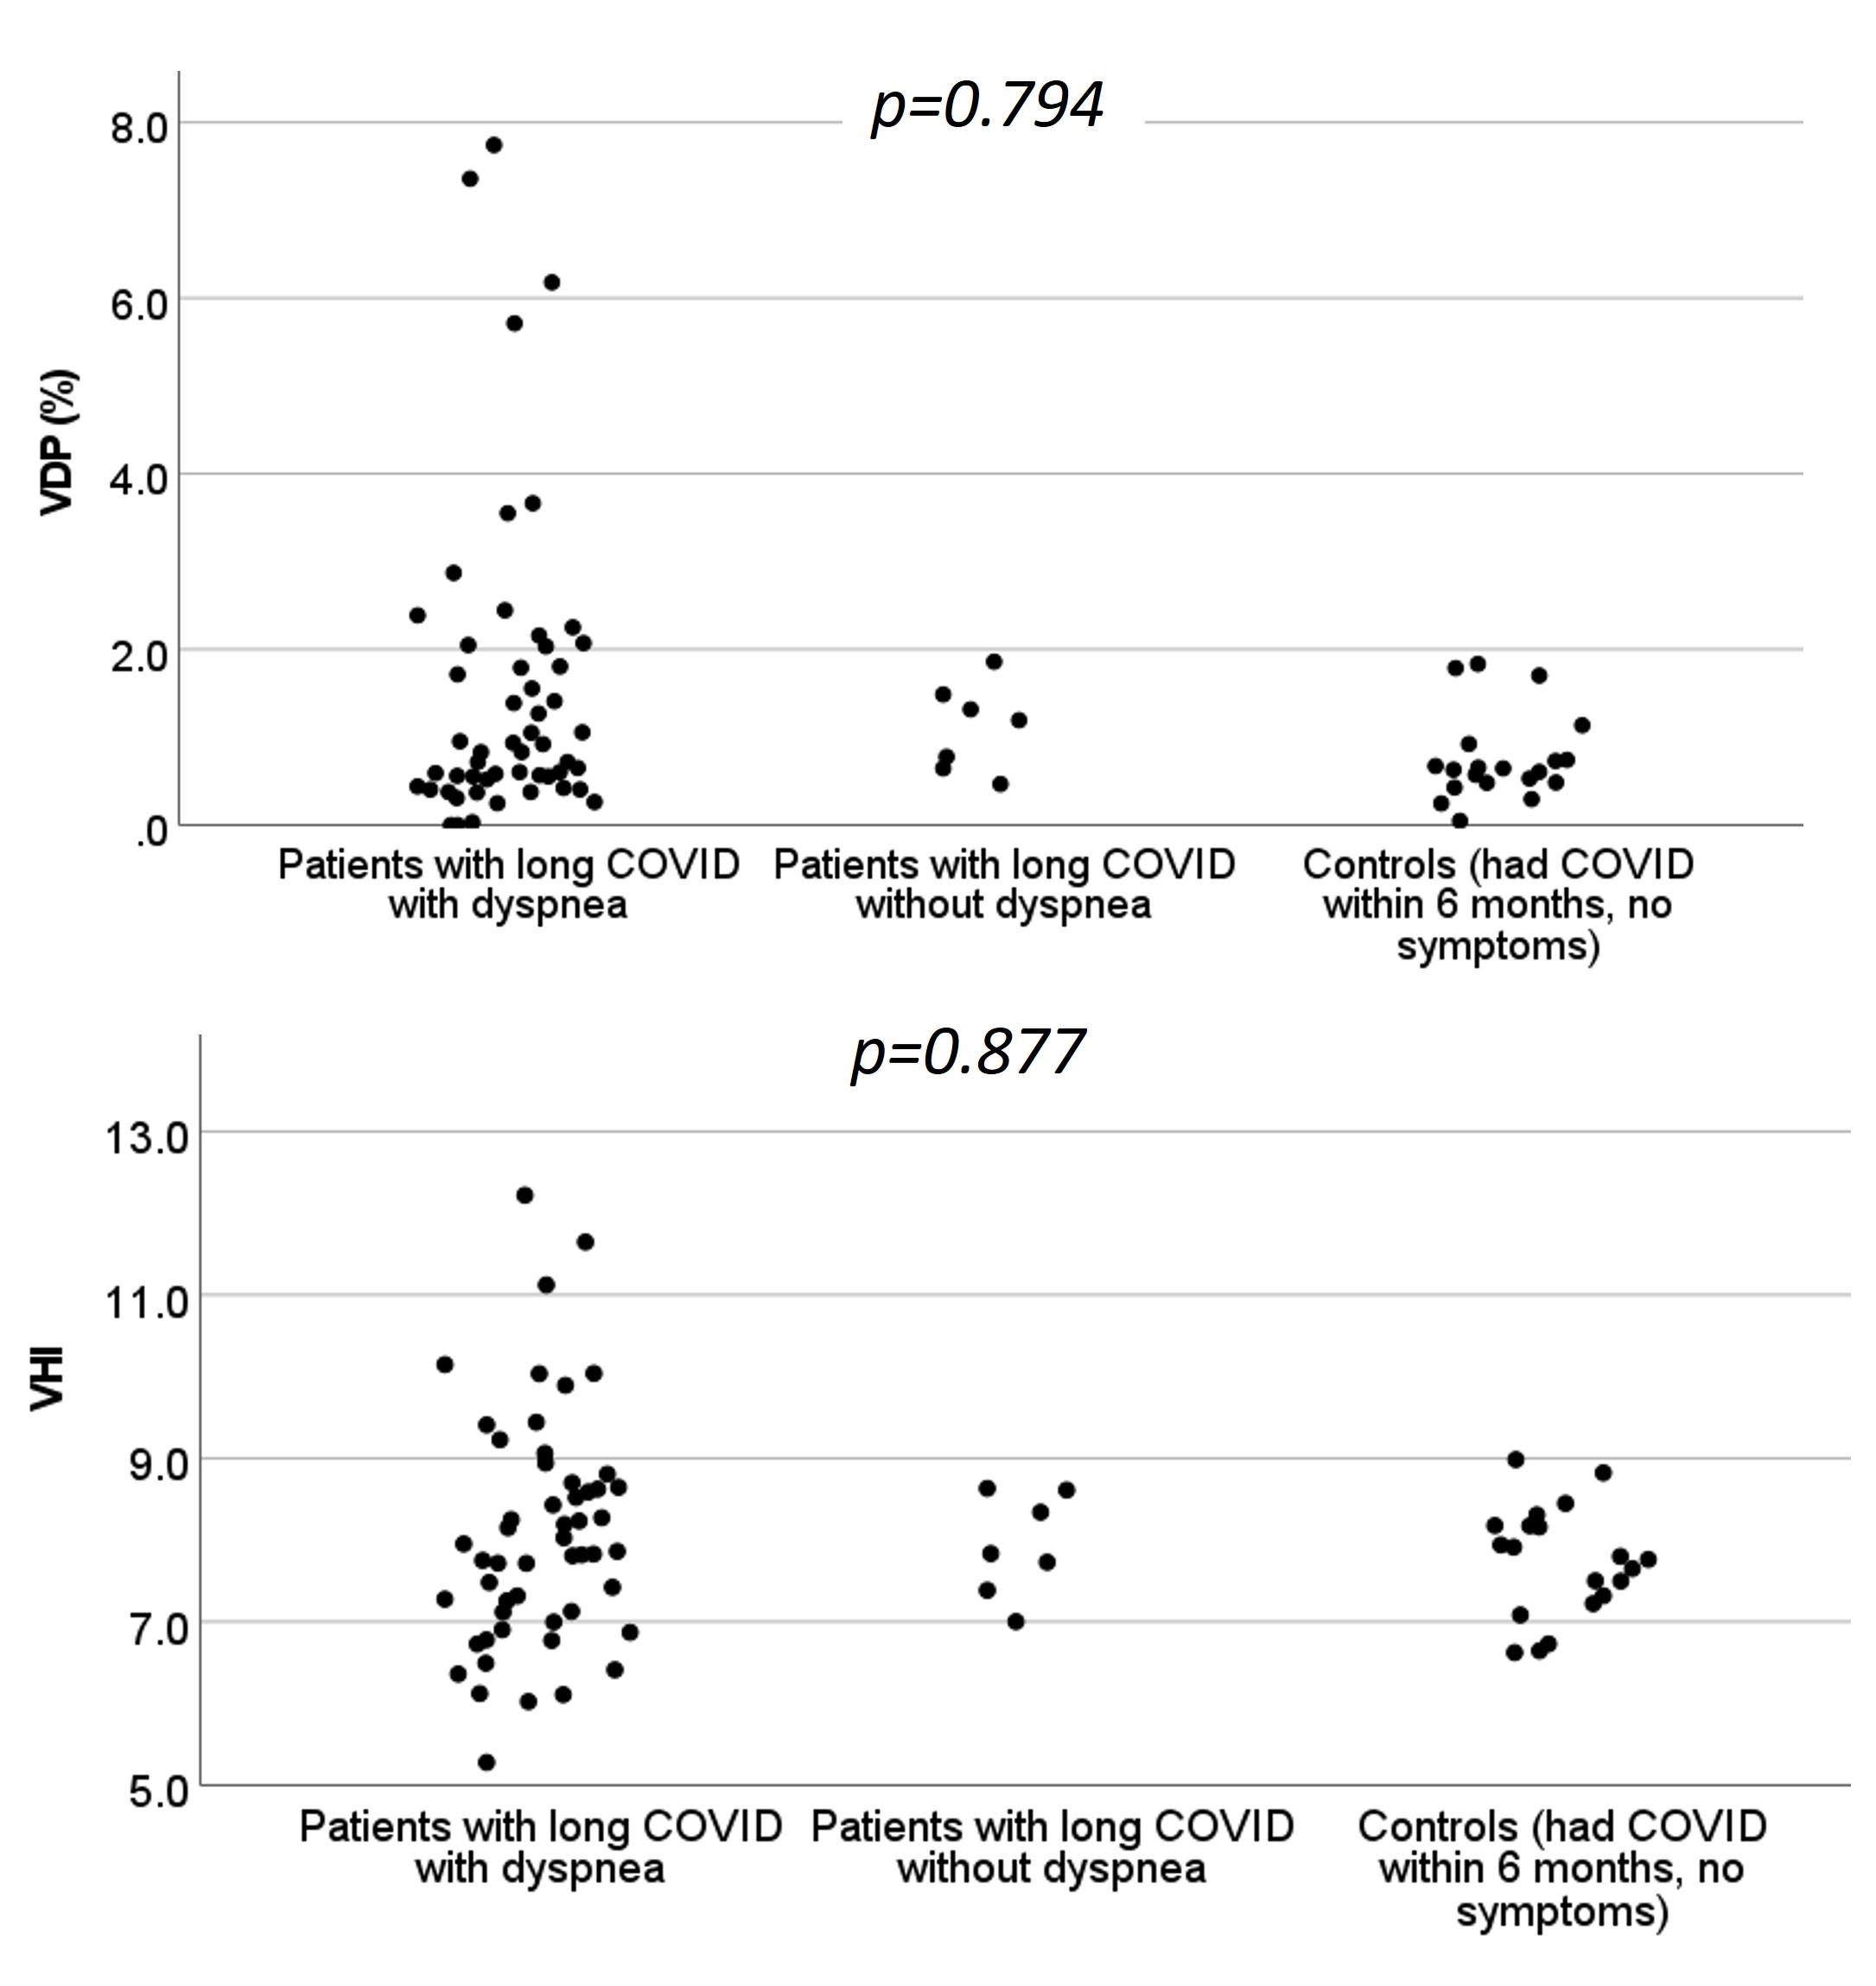
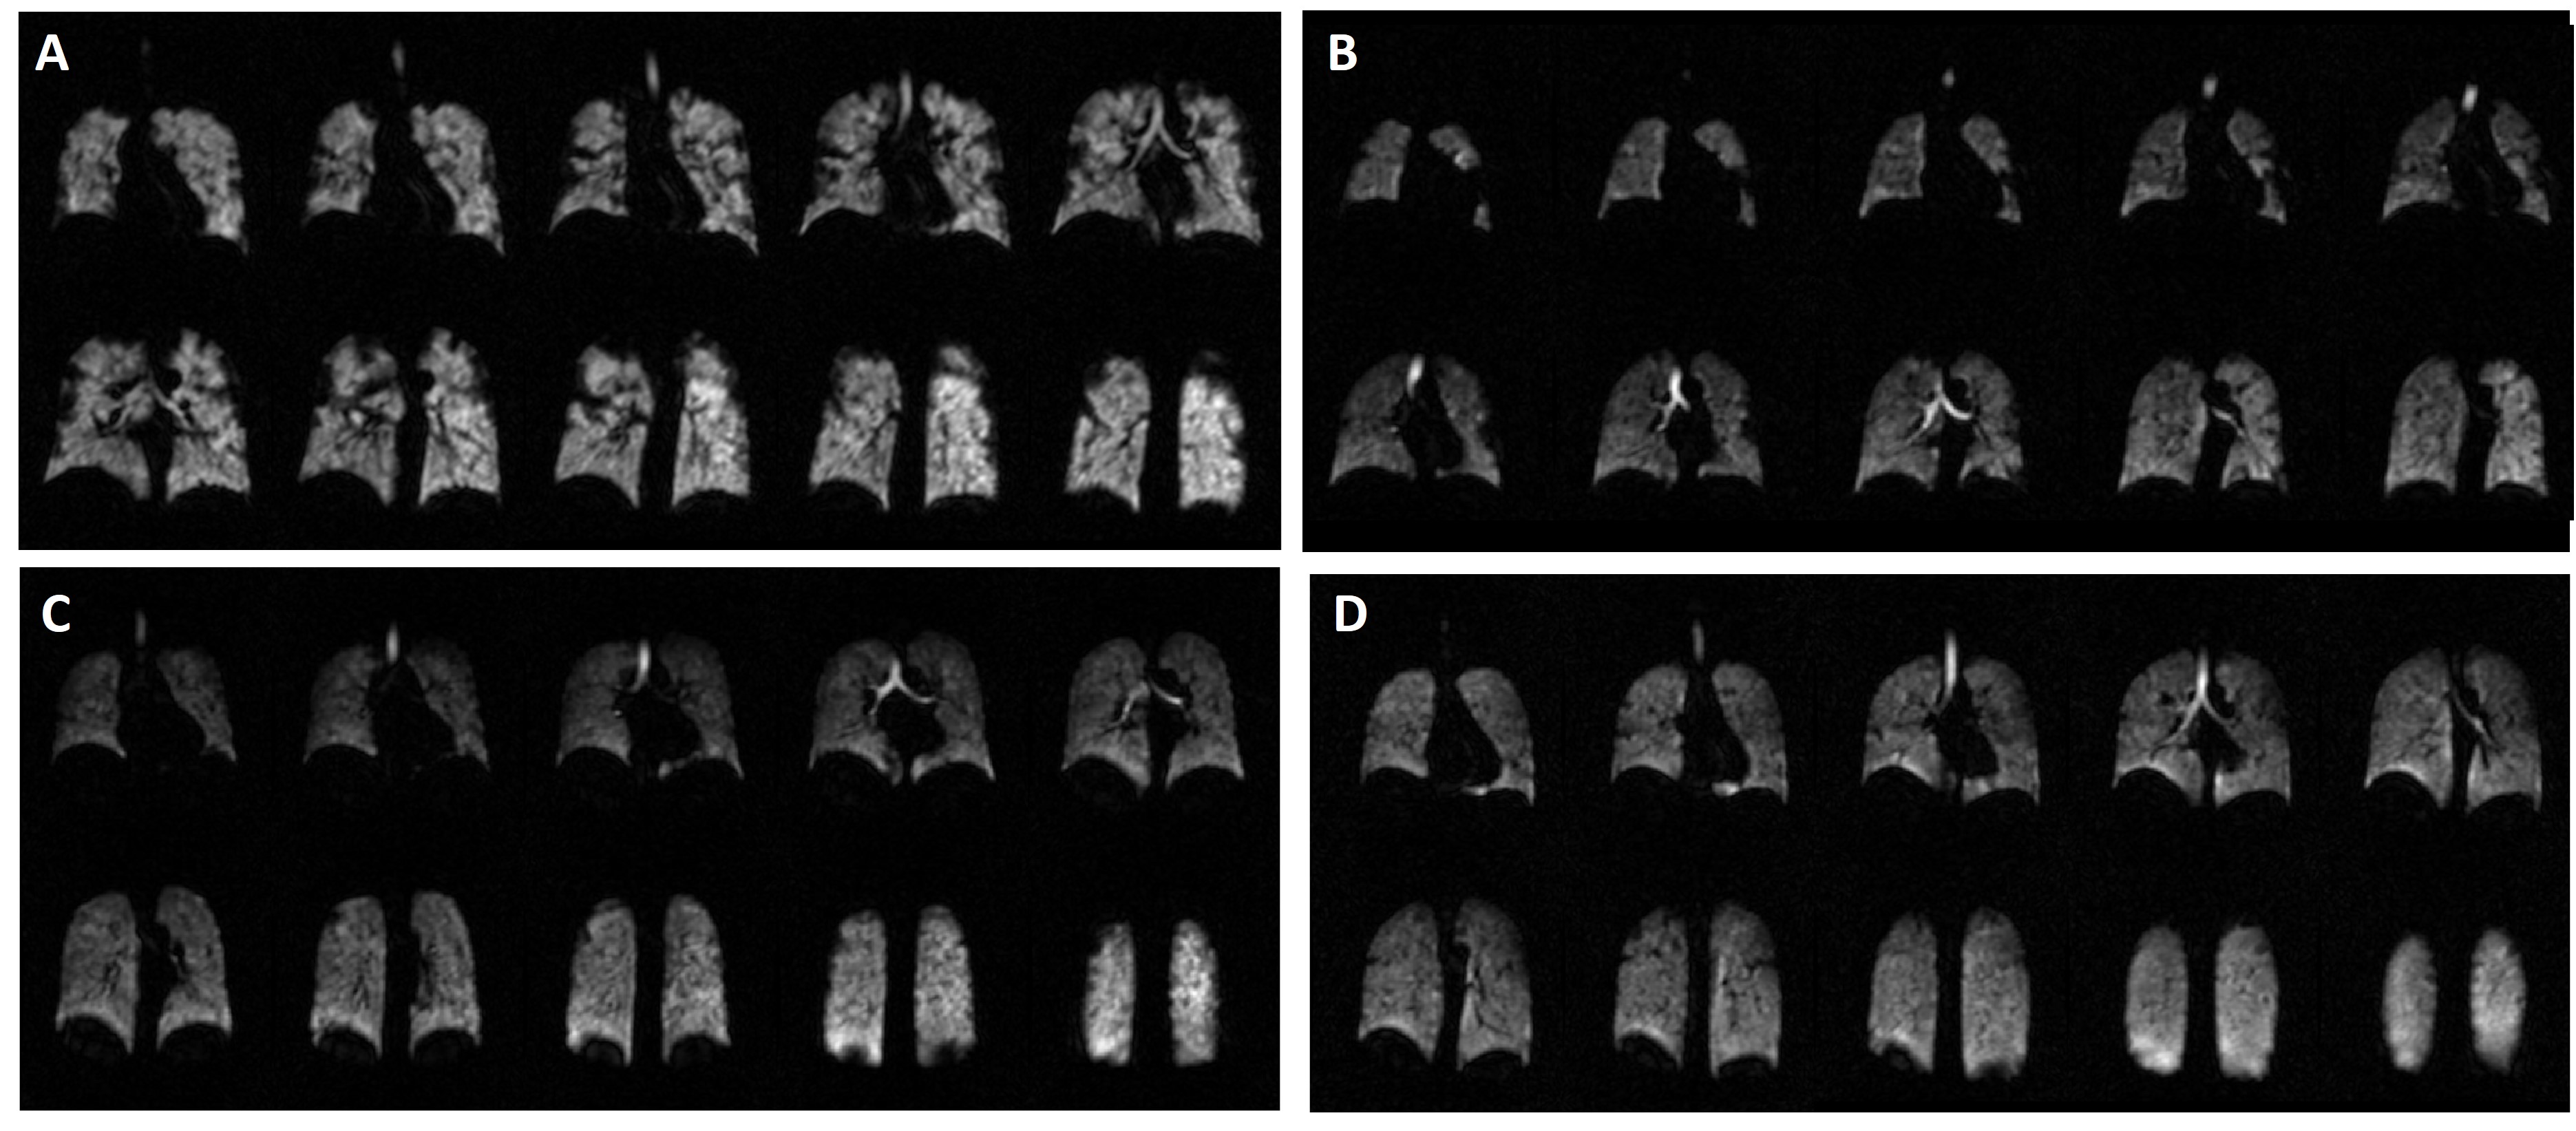
12 patients with long COVID and dyspnea had abnormal VDP (VDP>2%11), no control subjects or subjects without dyspnea had VDP>2% (Figures 1 and 2). Patients with long COVID and dysnpea had a higher proportion of people with abnormal VDP than the other groups (p=0.027). Ventilation defects were predominantly peripheral, with VDP in the peripheral lung higher than VDP in the proximal lung (p<0.001, all subjects).
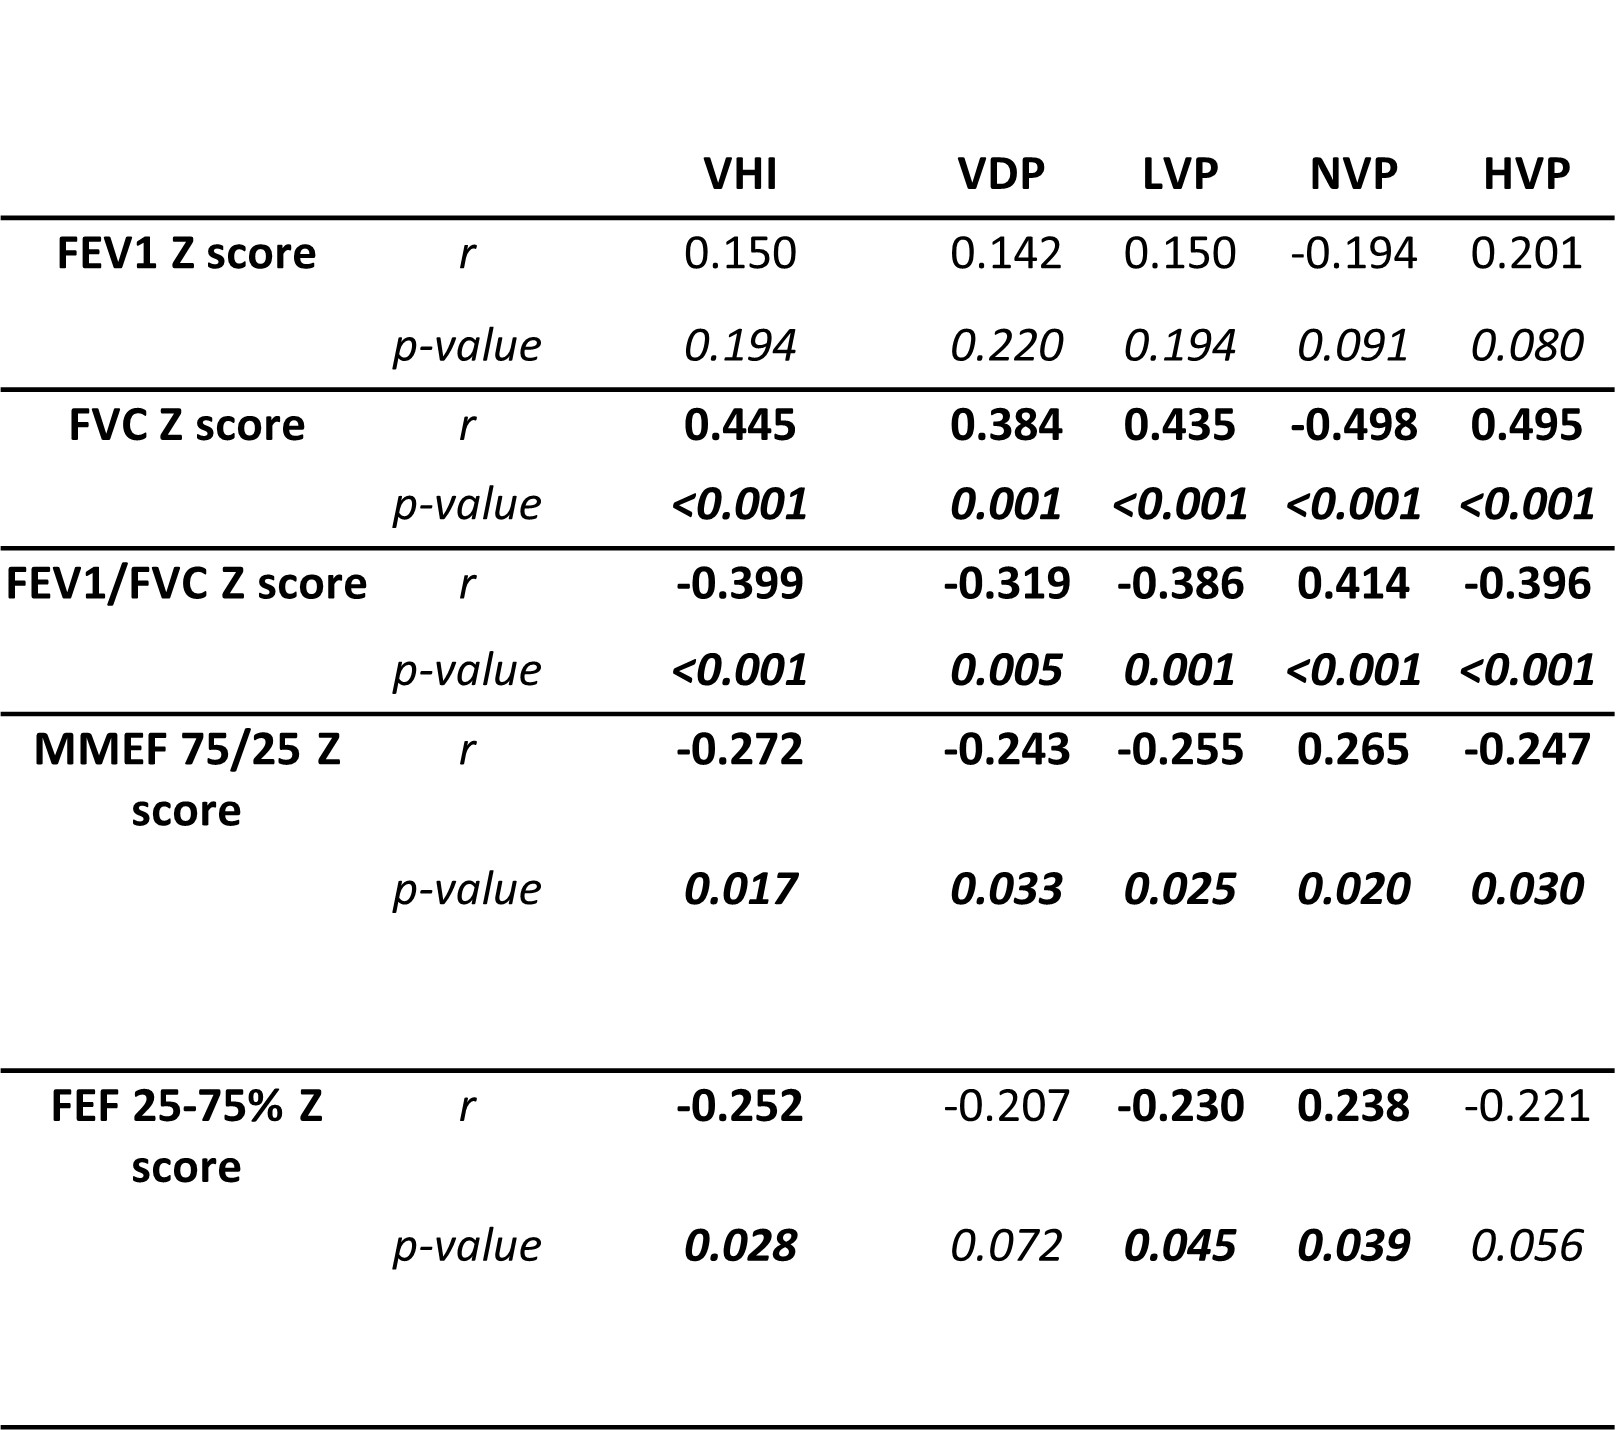
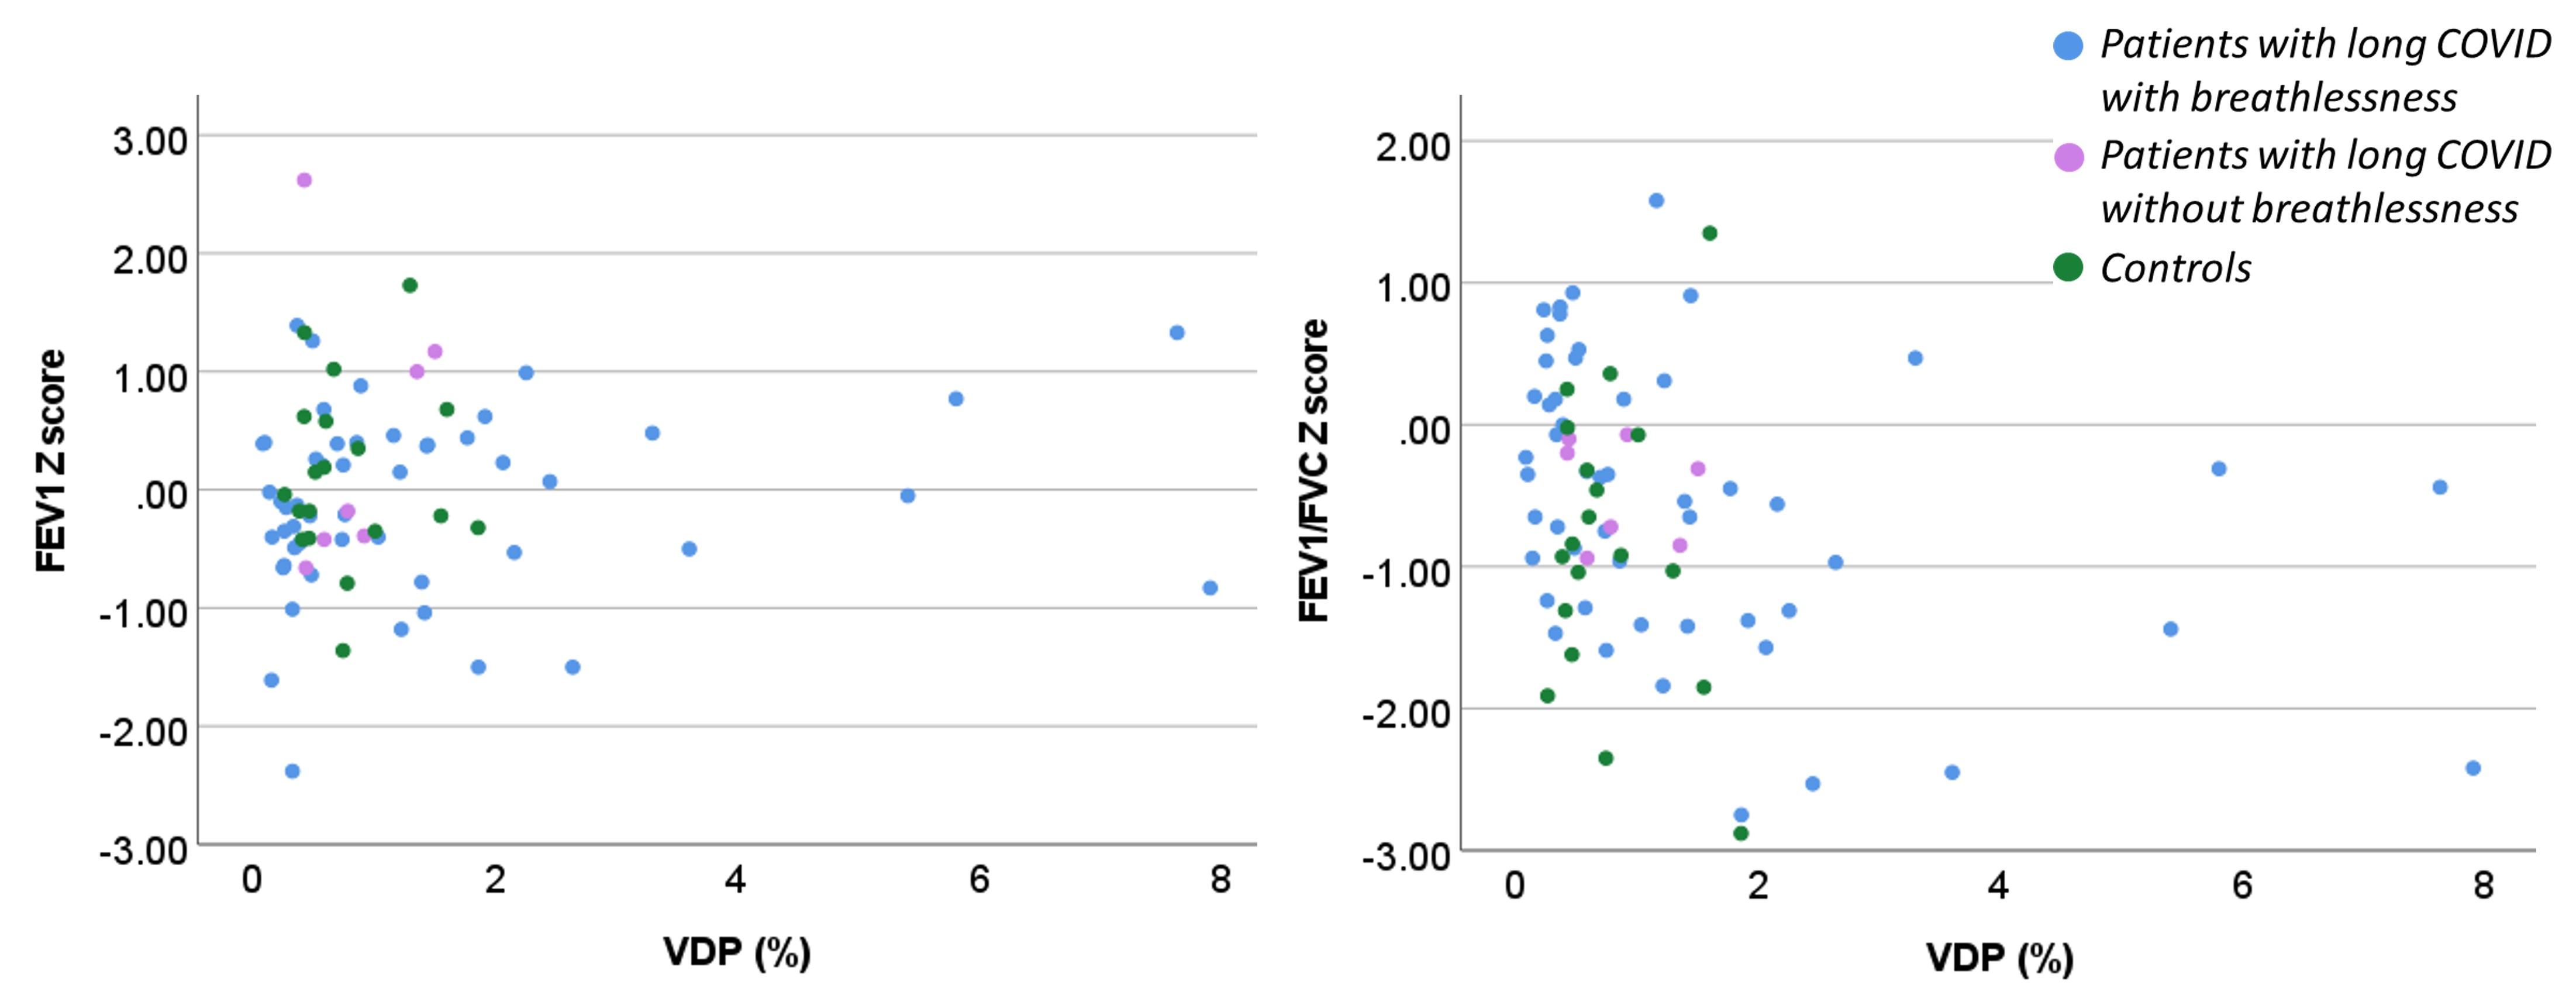
11/12 patients with abnormal VDP were able to complete spirometry successfully. 3/11 of those patients had abnormal FEV1/FVC Z score, see Figure 3.
FEV1/FVC Z score correlated negatively with VDP (r=-0.319, p<0.001) although this appears to be primarily driven by the small number of patients with high VDP (Figure 3).
Discussion
No significant differences in lung ventilation between patients with long COVID and dyspnea, patients with long COVID without dyspnea and controls were found in this cohort of subjects. The majority of patients with long COVID and dyspnea (77%) had normal lung ventilation. This is consistent with previously published work which did not find a significant VDP difference between never-hospitalised post-COVID patients and never-COVID controls3.23% of long COVID patients with dyspnea had VDP>2%, the majority of those had normal spirometry. 129Xe ventilation imaging is able to identify small, peripheral, airways abnormalities not identified by PFTs.
Conclusion
There was not a significant difference in ventilation metrics between controls and patients with long COVID without prior respiratory disease and normal CT imaging, however a subset of long COVID patients with dyspnea had lung ventilation defects despite normal PFTs, indicating that 129Xe ventilation imaging may be able to identify candidates for treatments targeted at airways disease.Acknowledgements
NIHR BRC Im Eng theme. INSIGNEO. MRC grant MR/M008894/1. EXPLAIN NIHR COV-LT2-0049. This study/research is funded by the National Institute for Health and Care Research (NIHR) Sheffield Biomedical Research Centre (NIHR203321). The views expressed are those of the author(s) and not necessarily those of the NIHR or the Department of Health and Social Care.References
1. Nalbandian A, Sehgal K, Gupta A, et al. Post-acute COVID-19 syndrome. Nat Med. Apr 2021;27(4):601-615. doi:10.1038/s41591-021-01283-z
2. Saunders LC, Collier GJ, Chan HF, et al. Longitudinal Lung Function Assessment of Patients Hospitalized With COVID-19 Using (1)H and (129)Xe Lung MRI. Chest. Sep 2023;164(3):700-716. doi:10.1016/j.chest.2023.03.024
3. Kooner HK, McIntosh MJ, Matheson AM, et al. (129)Xe MRI ventilation defects in ever-hospitalised and never-hospitalised people with post-acute COVID-19 syndrome. BMJ Open Respir Res. May 2022;9(1)doi:10.1136/bmjresp-2022-001235
4. Kooner HK, McIntosh MJ, Matheson AM, Svenningsen S, Parraga G. More Data about (129)Xe MRI Ventilation Defects in Long COVID-19. Radiology. May 2023;307(4):e230479. doi:10.1148/radiol.230479
5. Vogel-Claussen J. Ventilation Defects at (129)Xe MRI in Postacute COVID-19 Syndrome: Back to Normal after 1 Year? Radiology. Apr 2023;307(2):e230113. doi:10.1148/radiol.230113
6. Stewart NJ, Norquay G, Griffiths PD, Wild JM. Feasibility of human lung ventilation imaging using highly polarized naturally abundant xenon and optimized three-dimensional steady-state free precession. Magn Reson Med. Aug 2015;74(2):346-52. doi:10.1002/mrm.25732
7. Collier G. Linear binning maps for image analysis of pulmonary ventilation with hyperpolarized gas MRI: transferability and clinical applications. . presented at: International Society for Magnetic Resonance in Medicine; 2018 2018; Paris.
8. Smith LJ, Collier GJ, Marshall H, et al. Patterns of regional lung physiology in cystic fibrosis using ventilation magnetic resonance imaging and multiple-breath washout. Eur Respir J. Nov 2018;52(5)doi:10.1183/13993003.00821-2018
9. Marshall H, Kenworthy JC, Horn FC, et al. Peripheral and proximal lung ventilation in asthma: Short-term variation and response to bronchodilator inhalation. J Allergy Clin Immunol. Jun 2021;147(6):2154-2161 e6. doi:10.1016/j.jaci.2020.11.035
10. He M, Driehuys B, Que LG, Huang YT. Using Hyperpolarized (129)Xe MRI to Quantify the Pulmonary Ventilation Distribution. Acad Radiol. Dec 2016;23(12):1521-1531. doi:10.1016/j.acra.2016.07.014
11. McIntosh MJ, Biancaniello A, Kooner HK, et al. (129)Xe MRI Ventilation Defects in Asthma: What is the Upper Limit of Normal and Minimal Clinically Important Difference? Acad Radiol. Apr 7 2023;doi:10.1016/j.acra.2023.03.010
Figures