2908
Measurement of in vivo T2* of inhaled perfluoropropane gas and its dependence on lung microstructure.1Newcastle Magnetic Resonance Centre, Newcastle University, Newcastle upon Tyne, United Kingdom, 2Translational and Clinical Research Institute, Newcastle University, Newcastle upon Tyne, United Kingdom
Synopsis
Keywords: Lung, Lung
Motivation: The T2* of inhaled perfluoropropane gas is determined by lung microstructure due to its dependence on the magnetic susceptibility of airway and tissue components, granting the potential to report on lung pathophysiology.
Goal(s): To implement a robust measurement of the T2* of inhaled perfluoropropane, to lead to early detection of structural alterations from lung pathologies.
Approach: We’ve acquired spatially localized 19F-MRS T2* measurements of perfluoropropane in healthy volunteers at different inhalation depths.
Results: We observed a 12% variation in T2* between maximum and minimum inhalation, demonstrating T2*’s sensitivity to physiological change, and potential for early detection of microstructural change associated with lung disease.
Impact: A spatially localized measurement of perfluoropropane T2* has sensitivity to change in lung microstructure due to physiological change. These data show the potential of 19F-MRI to report on pathology-driven microstructural change, which may allow for early detection of lung disease.
Introduction
Pulmonary T2* measurements are sensitive to lung microstructure due to their dependency on magnetic susceptibility differences at boundaries between air and tissue at the mesoscopic level. These cause localized field gradients, where signal from MR-detectable nuclei within these gradients experience rapid de-phasing and thus exhibit a short transverse relaxation rate (T2*)1. Therefore, pulmonary T2* measurements are sensitive to structural changes associated with lung physiology (e.g., depth of inspiration) or pathophysiology (i.e., structural change associated with disease) and may allow for early detection of diseases such as emphysema, cystic fibrosis, and chronic bronchitis. Our research focuses on 19F-MRI of inhaled perfluoropropane (PFP) to assess lung ventilation properties, and the assessment of lung microstructural influences on relaxation properties of this MR-visible gas. Previous T2* measurements of inhaled PFP have either lacked spatial information2 or high confidence3, and our experience with T2* mapping highlighted challenges due to low confidence in T2* values calculated from 19F-MRI data with relatively low SNR. Therefore, we employed image selected in vivo spectroscopy (ISIS)4 to acquire spatially-localised T2* measurements with high SNR. A slice selective 1D-ISIS sequence was used for spatial localisation of signal from PFP, accommodating its rapid in vivo T1 relaxation (T1 ~ 12.4 ms)5. These spectroscopic data show the sensitivity of inhaled PFP’s T2* to microanatomical change at different inhalation depths in healthy volunteers, as well as provide an accurate localized T2* measurement for validation of 19F-MRI T2* mapping.Methods
Scans were performed on a Philips Achieva 3T using a Rapid 19F transmit/receive chest birdcage coil. Spectra were acquired into 64 datapoints over an 8 kHz bandwidth, 50 mm slice thickness and NSA = 124, with a total acquisition time of 5s. The healthy volunteer was recruited under local research ethical approval and instructed to inhale a 79% PFP/ 21% O2 gas mixture. Three deep inhalations were performed prior to initial scanning for sufficient wash in of the fluorocarbon gas. The first scanning session involved four consecutive 1D-ISIS scans acquired from the peripheral 5cm of the right lung (Figure 1) at maximum inhalation, maximum expiration, under free breathing, and at tidal volume. The second scanning session acquired two 1D-ISIS scans within a single breath hold at max inhalation, located at the lung periphery and main airways respectively (Figure 1). T2* was calculated by fitting a decaying exponential function (Equation 1, where So is initial signal, t is the sample time and C is noise) to the ISIS time domain data.$$$S(t) = S_{o} e^{ \frac{-t}{ T^{*}_{2}}} + C$$$
Results
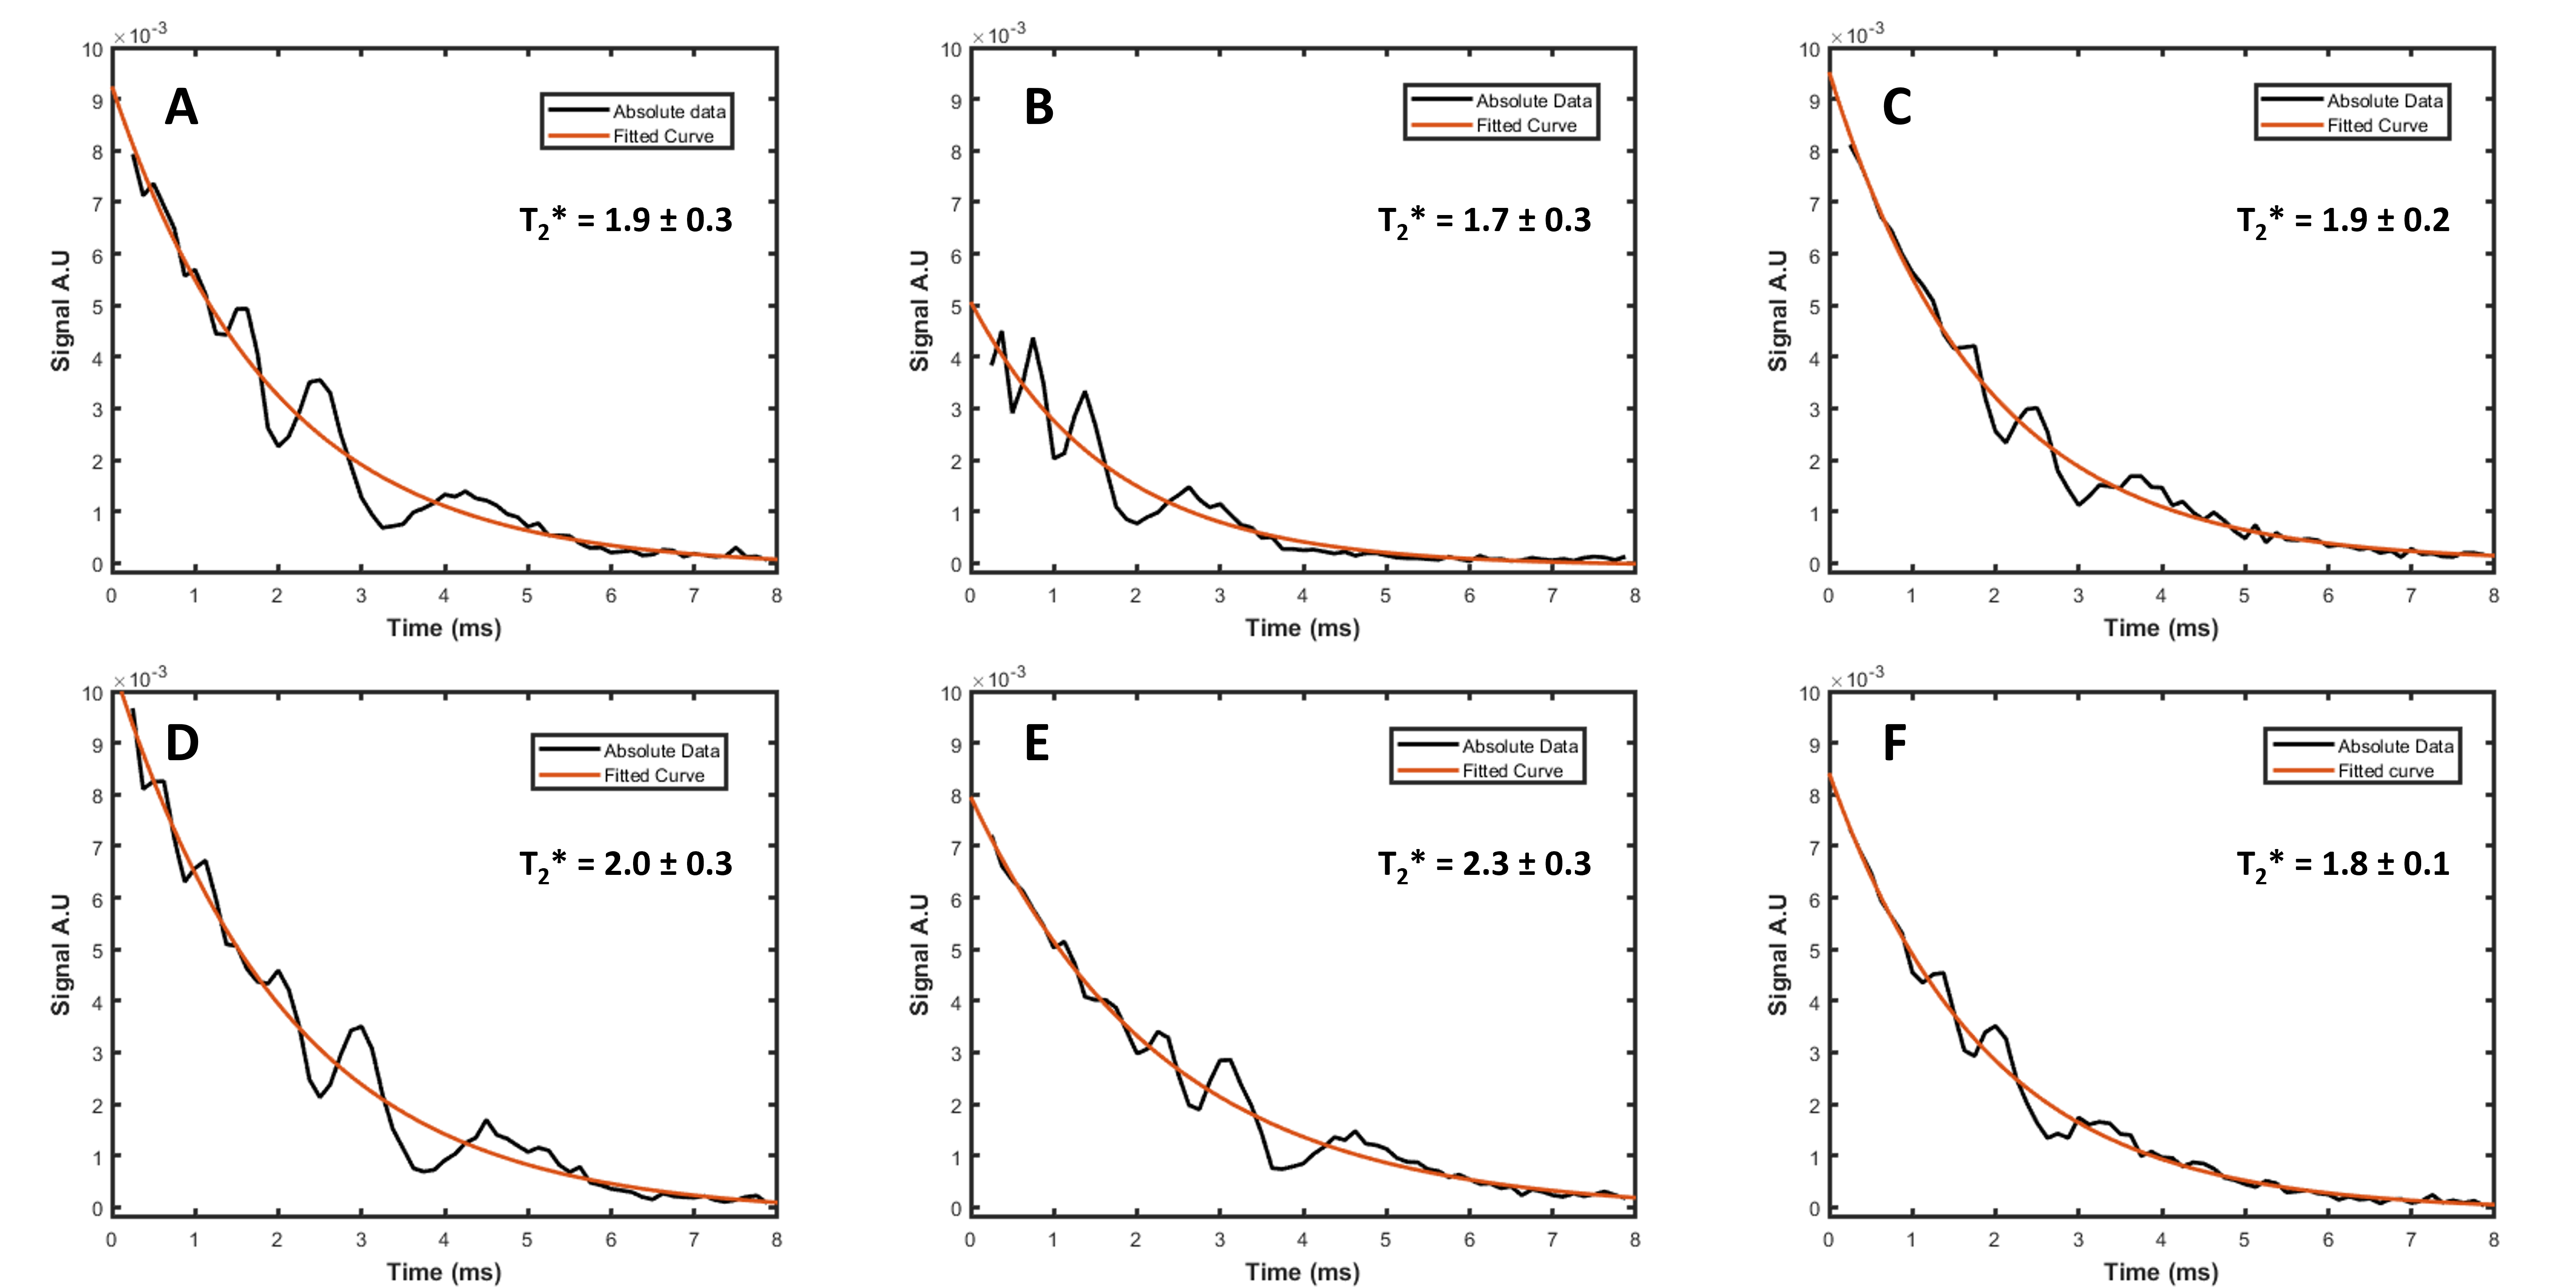
Average SNR was 122.2 ± 57.2 (SD). The T2* of inhaled PFP in the peripheral region of the right lung was 1.9 ± 0.3 ms (95% CI) at maximum inhalation and free breathing, 1.7 ± 0.3 ms at minimum inhalation and 1.8± 0.1 ms at tidal volume inhalation. The T2* of the inhaled PFP in regions predominantly containing central airways was 2.3 ± 0.3 ms at max inhalation and 2.0 ± 0.3 at the lung periphery in scan session 2. Figure 2 shows ISIS scan time domain data and exponential fits.Discussion
The observed change in PFP’s T2* over the respiratory cycle reflects a sensitivity to change in pulmonary physiology and microstructure. Measurements of T2* of lung periphery at max inhalation show close agreement from each scanning session, demonstrating repeatability in our protocol for an identical slice selection and breath hold regime. Measured T2* across the major airways was shorter than anticipated, likely caused by the large volume of interest (VOI) spanning multiple generations of the tracheobronchial tree, reducing the mean T2*. This limitation arises from our decision to employ slice selective ISIS due to the short T1 relaxation of in vivo PFP. However, calculated SNR shows sufficient signal to further reduce VOI slice thickness, potentially mitigating the reduction of mean T2*. These data provide the ability to discriminate physiological/structural pulmonary change in a measurement with high SNR and narrow confidence intervals, and therefore could highlight PFP 19F-MRI’s potential for early detection of microstructural alterations arising from lung disease.Conclusion
Our data demonstrate that spatially localised 19F-MRS measurements can be used to measure the T2* of inhaled PFP, and that T2* is sensitive to change in lung microstructure at different inhalation depths and to regional differences in lung structure. Measurement of the T2* of inhaled PFP has potential to report on microstructural changes due to lung pathology and may allow for early detection of lung diseases. This technique will also contribute to the development of our 19F-MRI T2* mapping by providing accurate localized measurements for which to validate our T2* maps.Acknowledgements
This project is funded by the UK Engineering and Physical Sciences Research Council’s Centre for Doctoral Training in Molecular Sciences for Medicine. The authors acknowledge assistance from the radiography team at the Newcastle Magnetic Resonance Centre, for help with data acquisition.
References
References
1. Wild, J.M., et al., MRI of the lung (1/3): methods. Insights into Imaging, 2012. 3(4): p. 345-353.
2. Neal, M.A., et al., Dynamic susceptibility contrast 19 F‐MRI of inhaled perfluoropropane: a novel approach to combined pulmonary ventilation and perfusion imaging. Magnetic Resonance in Medicine, 2020. 83(2): p. 452-461.
3. Maunder, A., et al., MR properties of <sup>19</sup>F C<sub>3</sub>F<sub>8</sub> gas in the lungs of healthy volunteers: and apparent diffusion coefficient at 1.5T and at 3T. Magnetic Resonance in Medicine, 2021. 85(3): p. 1561-1570.
4. Ordidge, R.J., A. Connelly, and J.A.B. Lohman, Image-selected in Vivo spectroscopy (ISIS). A new technique for spatially selective nmr spectroscopy. Journal of Magnetic Resonance (1969), 1986. 66(2): p. 283-294.
5. Couch, M.J., et al., Pulmonary ultrashort echo time 19F MR imaging with inhaled fluorinated gas mixtures in healthy volunteers: feasibility. Radiology, 2013. 269(3): p. 903-9.
Figures
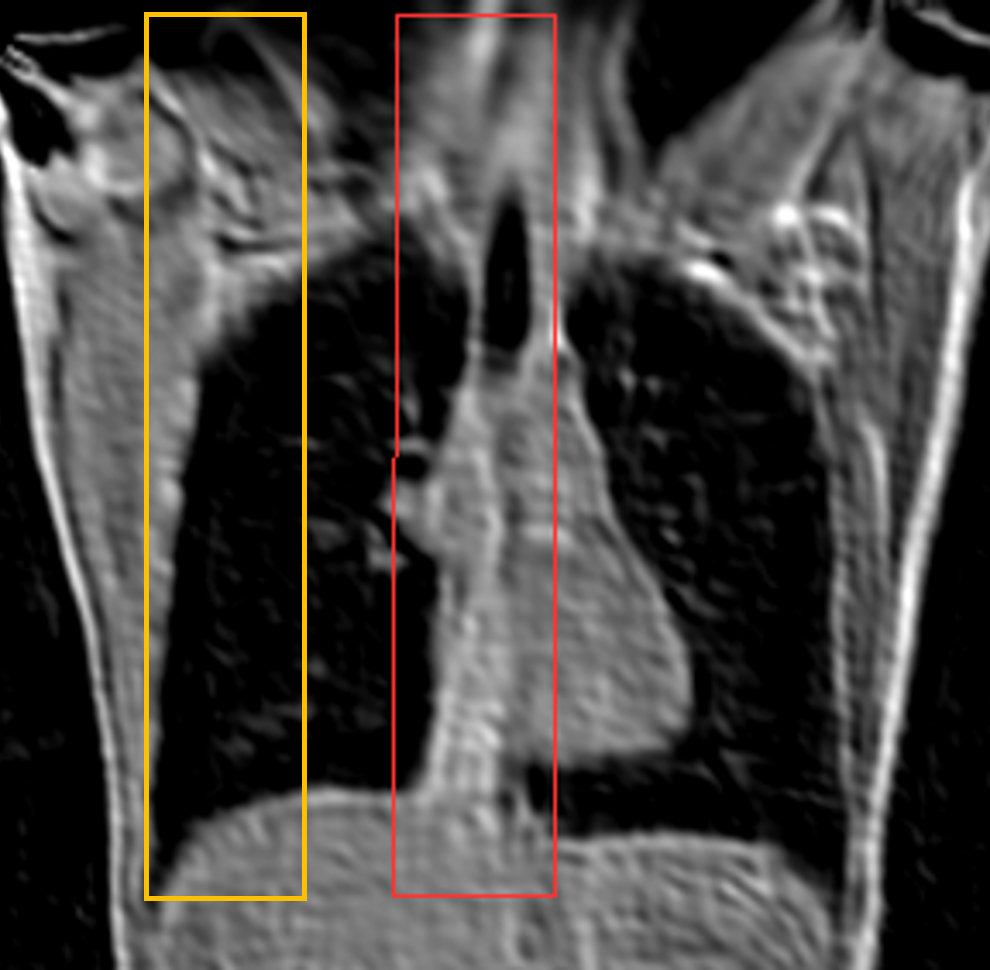
Figure 1 Central slice of a 1H-MRI survey scan of our healthy volunteer at maximum inspiration, showing 19F-MR ISIS slab locations in regions of lung periphery (yellow) and major airways (red).