2907
Quantitative Lung T1 and T2* Mapping with Upright 0.5T MR: investigating the effect of gravity on lung regions under low-field strength1Sir Peter Mansfield Imaging Center, University of Nottingham, Nottingham, United Kingdom, 2University of Nottingham, Nottingham, United Kingdom
Synopsis
Keywords: Lung, Low-Field MRI, Quantitative parametric mapping, Upright MRI, Gravity on Lung
Motivation: Quantitative lung parametric mapping can characterise morphometric and functional changes in pulmonary disorders. Higher field lung-MRIs suffer from field inhomogeneity, and supine MRI does not replicate physiology during daily tasks and is not suitable for some lung patients.
Goal(s): Use low-field, upright-MR, quantify T1 and T2* of different lung regions and investigate how gravity impacts these parameters while seated.
Approach: A 0.5T ASG MROpen scanner was used to acquire breath-hold images using multi-TE GE (T2*) and variable flip angle method (T1); linear regression extracted the relaxation times.
Results: Although supine position showed similar T1 and T2*, gravity incurred a cranial-caudal gradient while seated.
Impact: Our low-field, upright-MR parametric mapping mitigates the limitations of higher-field lung-MRI and explores how relaxations change with gravity. Using the proposed methods, clinicians can characterise pathologies like COPD as well as get crucial functional information of lungs during diurnal postures.
Introduction
Quantitative mapping of lung T1 and T2* can provide non-invasive measurement of morphometric changes in alveolar geometry, characterise chronic obstructive disorders1, pulmonary edema, cystic fibrosis and emphysema2,3, and aid identification of stages of interstitial lung disease1,2,4.However, lung parametric maps obtained from typical supine or prone MR might not represent their actual values during daily tasks while sitting or standing, and can be difficult to perform on patients with specific lung conditions (e.g. COPD). Thus, quantifying T1 and T2* in upright posture at low field can provide crucial information about lung function in a clinically relevant posture, and the effect of gravity on our lungs. Low field strength can overcome some of the problems of inhomogeneous local fields at 1.5 and 3T and allow better characterisation of T1 changes4.
In this study, we used the 0.5T ASG MROpen scanner to quantify T1 and T2* of different peripheral regions of lung. Moreover, we investigated the effect of gravity by comparing values obtained from supine and upright posture. Here, we report the preliminary results of our ongoing study that aims at understanding the impact of gravity on lung physiology, structure, function, ventilation, and perfusion at variety of positions: sitting (at different angles), standing, inverted, supine and prone.
Methods
Five healthy volunteers (3 males) were scanned with the 0.5T ASG MROpen scanner at University of Nottingham, UK. Each image was acquired during a 16s breath hold (complete expiration) in both supine and seated (at 80°) postures. T2* was measured using a single echo gradient echo2 acquisition at 18 echo times (TE) ranging from 2-20 ms, TR=100 ms, FA 10°. T1 was measured using the variable flip angle (VFA) approach, acquiring gradient echo images at 12 FAs ranging from 10-50°, TR/TE=100/2 ms, FOV 320 mm; slice thickness 10 mm; matrix size 64 × 64.After groupwise deformable registration of the breath-hold images5, T2* values were calculated by fitting log(signal intensity) versus TE pixel-wise using a weighted linear regression fit (in MATLAB); later echoes where the magnitude signal had fallen below a manually-determined noise floor threshold were removed from the fit. Robust linear regression6 of linear representation of SPGR Bloch equation was used to extract T1 by dividing the TR by the negative of the slope of the signal intensity/sin (FA) versus signal intensity/tan (FA) plot.
To investigate superior-inferior gradient of T1 and T2* at supine and upright posture, three ROIs were placed in the cranial (ROITop), middle (ROIMiddle), and caudal (ROIBottom) regions of the lungs avoiding pulmonary vessels. We calculated the T1 and T2* for the signal averaged over each ROI; the standard deviation over each ROI was measured from voxel-wise lung parametric maps.
Results
Figure 1 and 2 show typical linear fits with parametric maps for supine and upright position for one 41-year-old healthy male subject. Figure 3(a-b) and 4(a-b) show bar-charts of T2* and T1 data for all subjects. T1 values were generally similar across the lung in the supine position and decreased from ROITop to ROIBottomin the seated position. A slight trend was observed for T2* though this needs further investigation.Discussion
The values of T1 and T2* at supine position are somewhat lower than the range suggested in literature for supine 0.55T (T1= 971±62 and T2*= 10±2 ms )7,8.The values varied in the upright position and more subjects will be scanned to analyse this fully. Gravity is likely to cause reduced alveolar volume, increased tissue density and increased arterial inflow (reducing T110) and possibly pooling of venous blood (reducing T2*) at the bottom of the lung. The effect of these changes on relaxation times will be further analysed. Future work should explore the extent to which T1 and T2* vary across the lung in an Anterior Posterior direction for supine subjects.
For seated ROITop, T2* measurements were suboptimal because the low SNR caused signals to fall below the noise threshold, leaving less data points for fitting (especially, for subject 5 with a larger lung). This could be due to lower proton density in top of the lung while in sitting posture but may also be influenced by positioning of the receiver coil. Future work will explore whether positioning of the body coil can resolve this.
Furthermore, the systematic variation around the T2* decay curves suggests some effect of gross field inhomogeneities and we will attempt to correct for this in future9.
Conclusion
This preliminary study reports quantitative maps of T1 and T2* for different lung regions at low-field, and their variation under gravity.These maps will aid clinicians to identify and characterise pathology, whilst avoiding the limitations of typical 1.5T or 3T lung imaging, and will assist in optimizing sequences for other measures such as oxygen-enhanced lung imaging and ventilation analyses. Moreover, the upright lung scanning can facilitate examining how different lung regions are perform during daily tasks like sitting, standing, talking and exercising.
It will also aid characterising chronic obstructive pulmonary disorder, for which supine MR is particularly problematic.
Acknowledgements
No acknowledgement found.References
1. Li B, Lee NG, Cui SX, Nayak KS. Lung parenchyma transverse relaxation rates at 0.55 T. Magnetic resonance in medicine. 2023;89(4):1522-1530.
2. Hatabu H, Stock KW, Sher S, et al. Magnetic resonance imaging of the thorax. Past, present, and future. Radiol Clin North Am. 2000;38(3):593-620, x.
3. Pracht ED, Arnold JF, Wang T, Jakob PM. Oxygen-enhanced proton imaging of the human lung using T2. Magnetic resonance in medicine. 2005;53(5):1193-1196.
4. Stadler A, Stiebellehner L, Jakob PM, et al. Quantitative and o(2) enhanced MRI of the pathologic lung: findings in emphysema, fibrosis, and cystic fibrosis. Int J Biomed Imaging. 2007;2007:23624.
5. Vishnevskiy V, Gass T, Szekely G, Tanner C, Goksel O. Isotropic Total Variation Regularization of Displacements in Parametric Image Registration. IEEE Trans Med Imaging. 2017;36(2):385-395. 6. Holland PW, Welsch RE. Robust regression using iteratively reweighted least-squares. Communications in Statistics - Theory and Methods. 1977;6(9):813-827.
7. Campbell-Washburn AE, Ramasawmy R, Restivo MC, et al. Opportunities in Interventional and Diagnostic Imaging by Using High-Performance Low-Field-Strength MRI. Radiology. 2019;293(2):384-393.
8. Li, B., et al. (2023). "Lung parenchyma transverse relaxation rates at 0.55 T." Magn Reson Med 89(4): 1522-1530.
9. Peters AM, Brookes MJ, Hoogenraad FG, et al. T2* measurements in human brain at 1.5, 3 and 7 T. Magn Reson Imaging. 2007;25(6):748-753.
10. Glenny, R.W. Determinants of regional ventilation and blood flow in the lung. Intensive Care Med 35, 1833–1842 (2009).
Figures
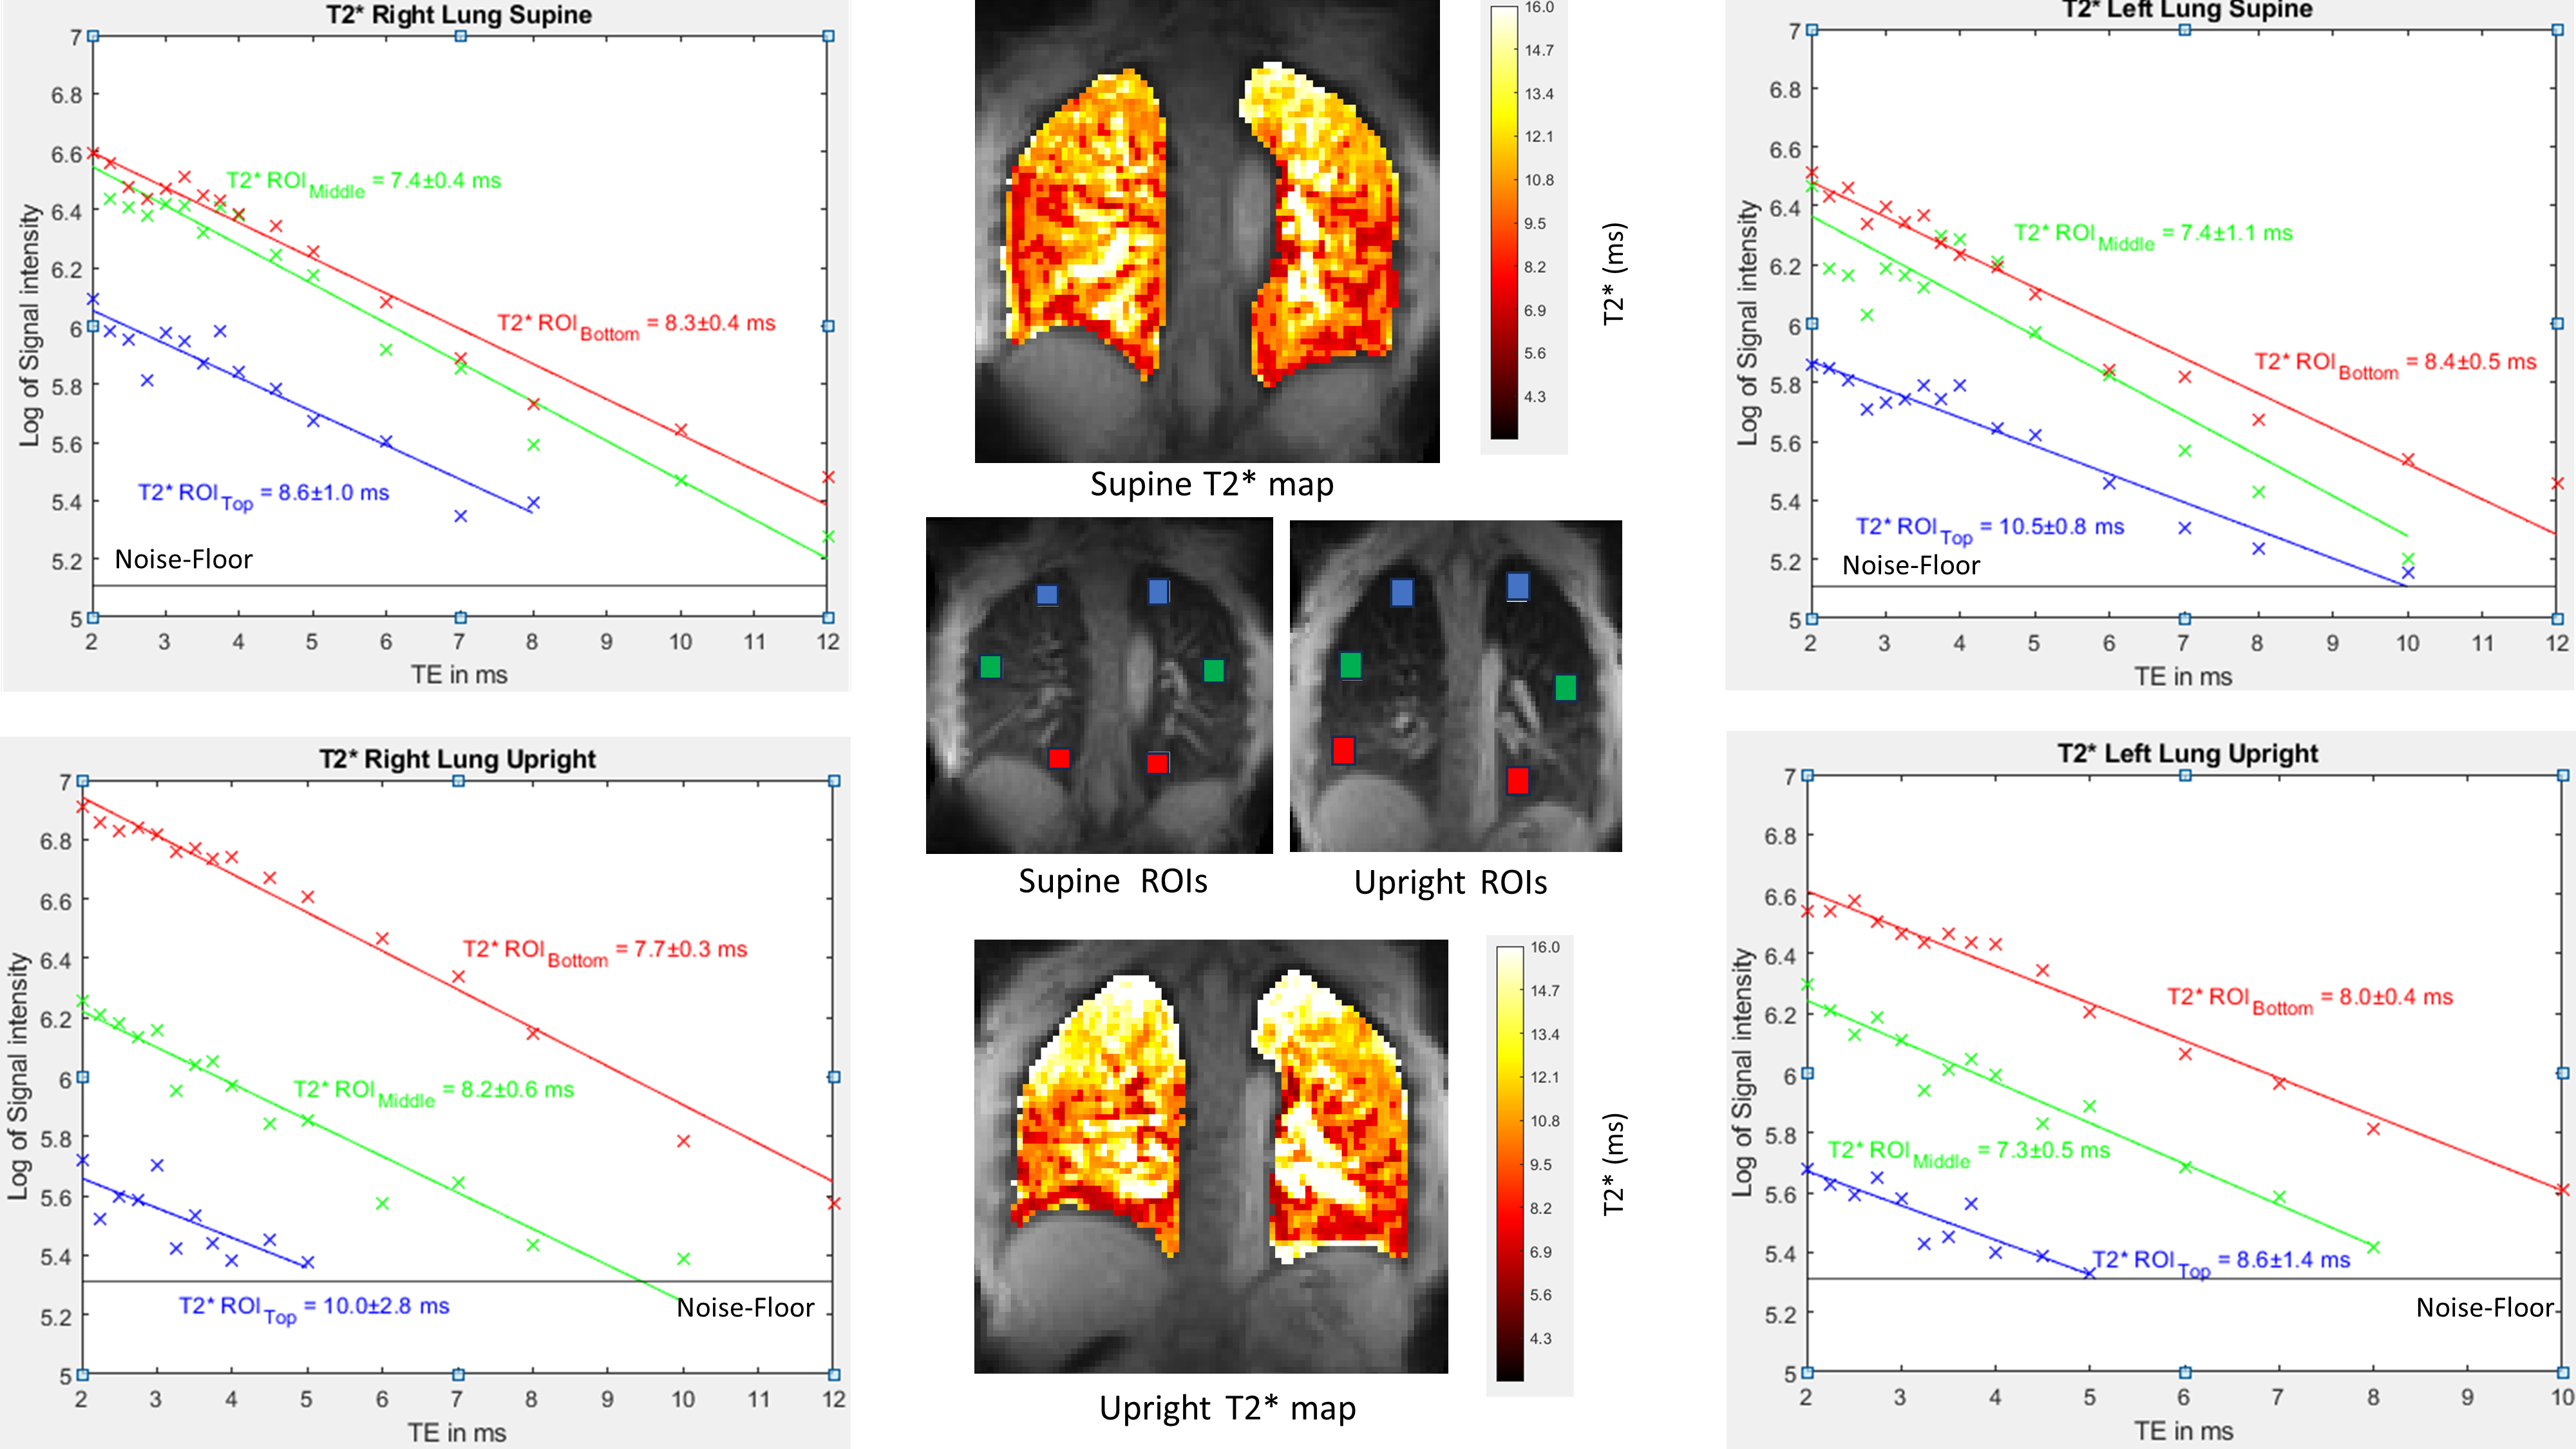
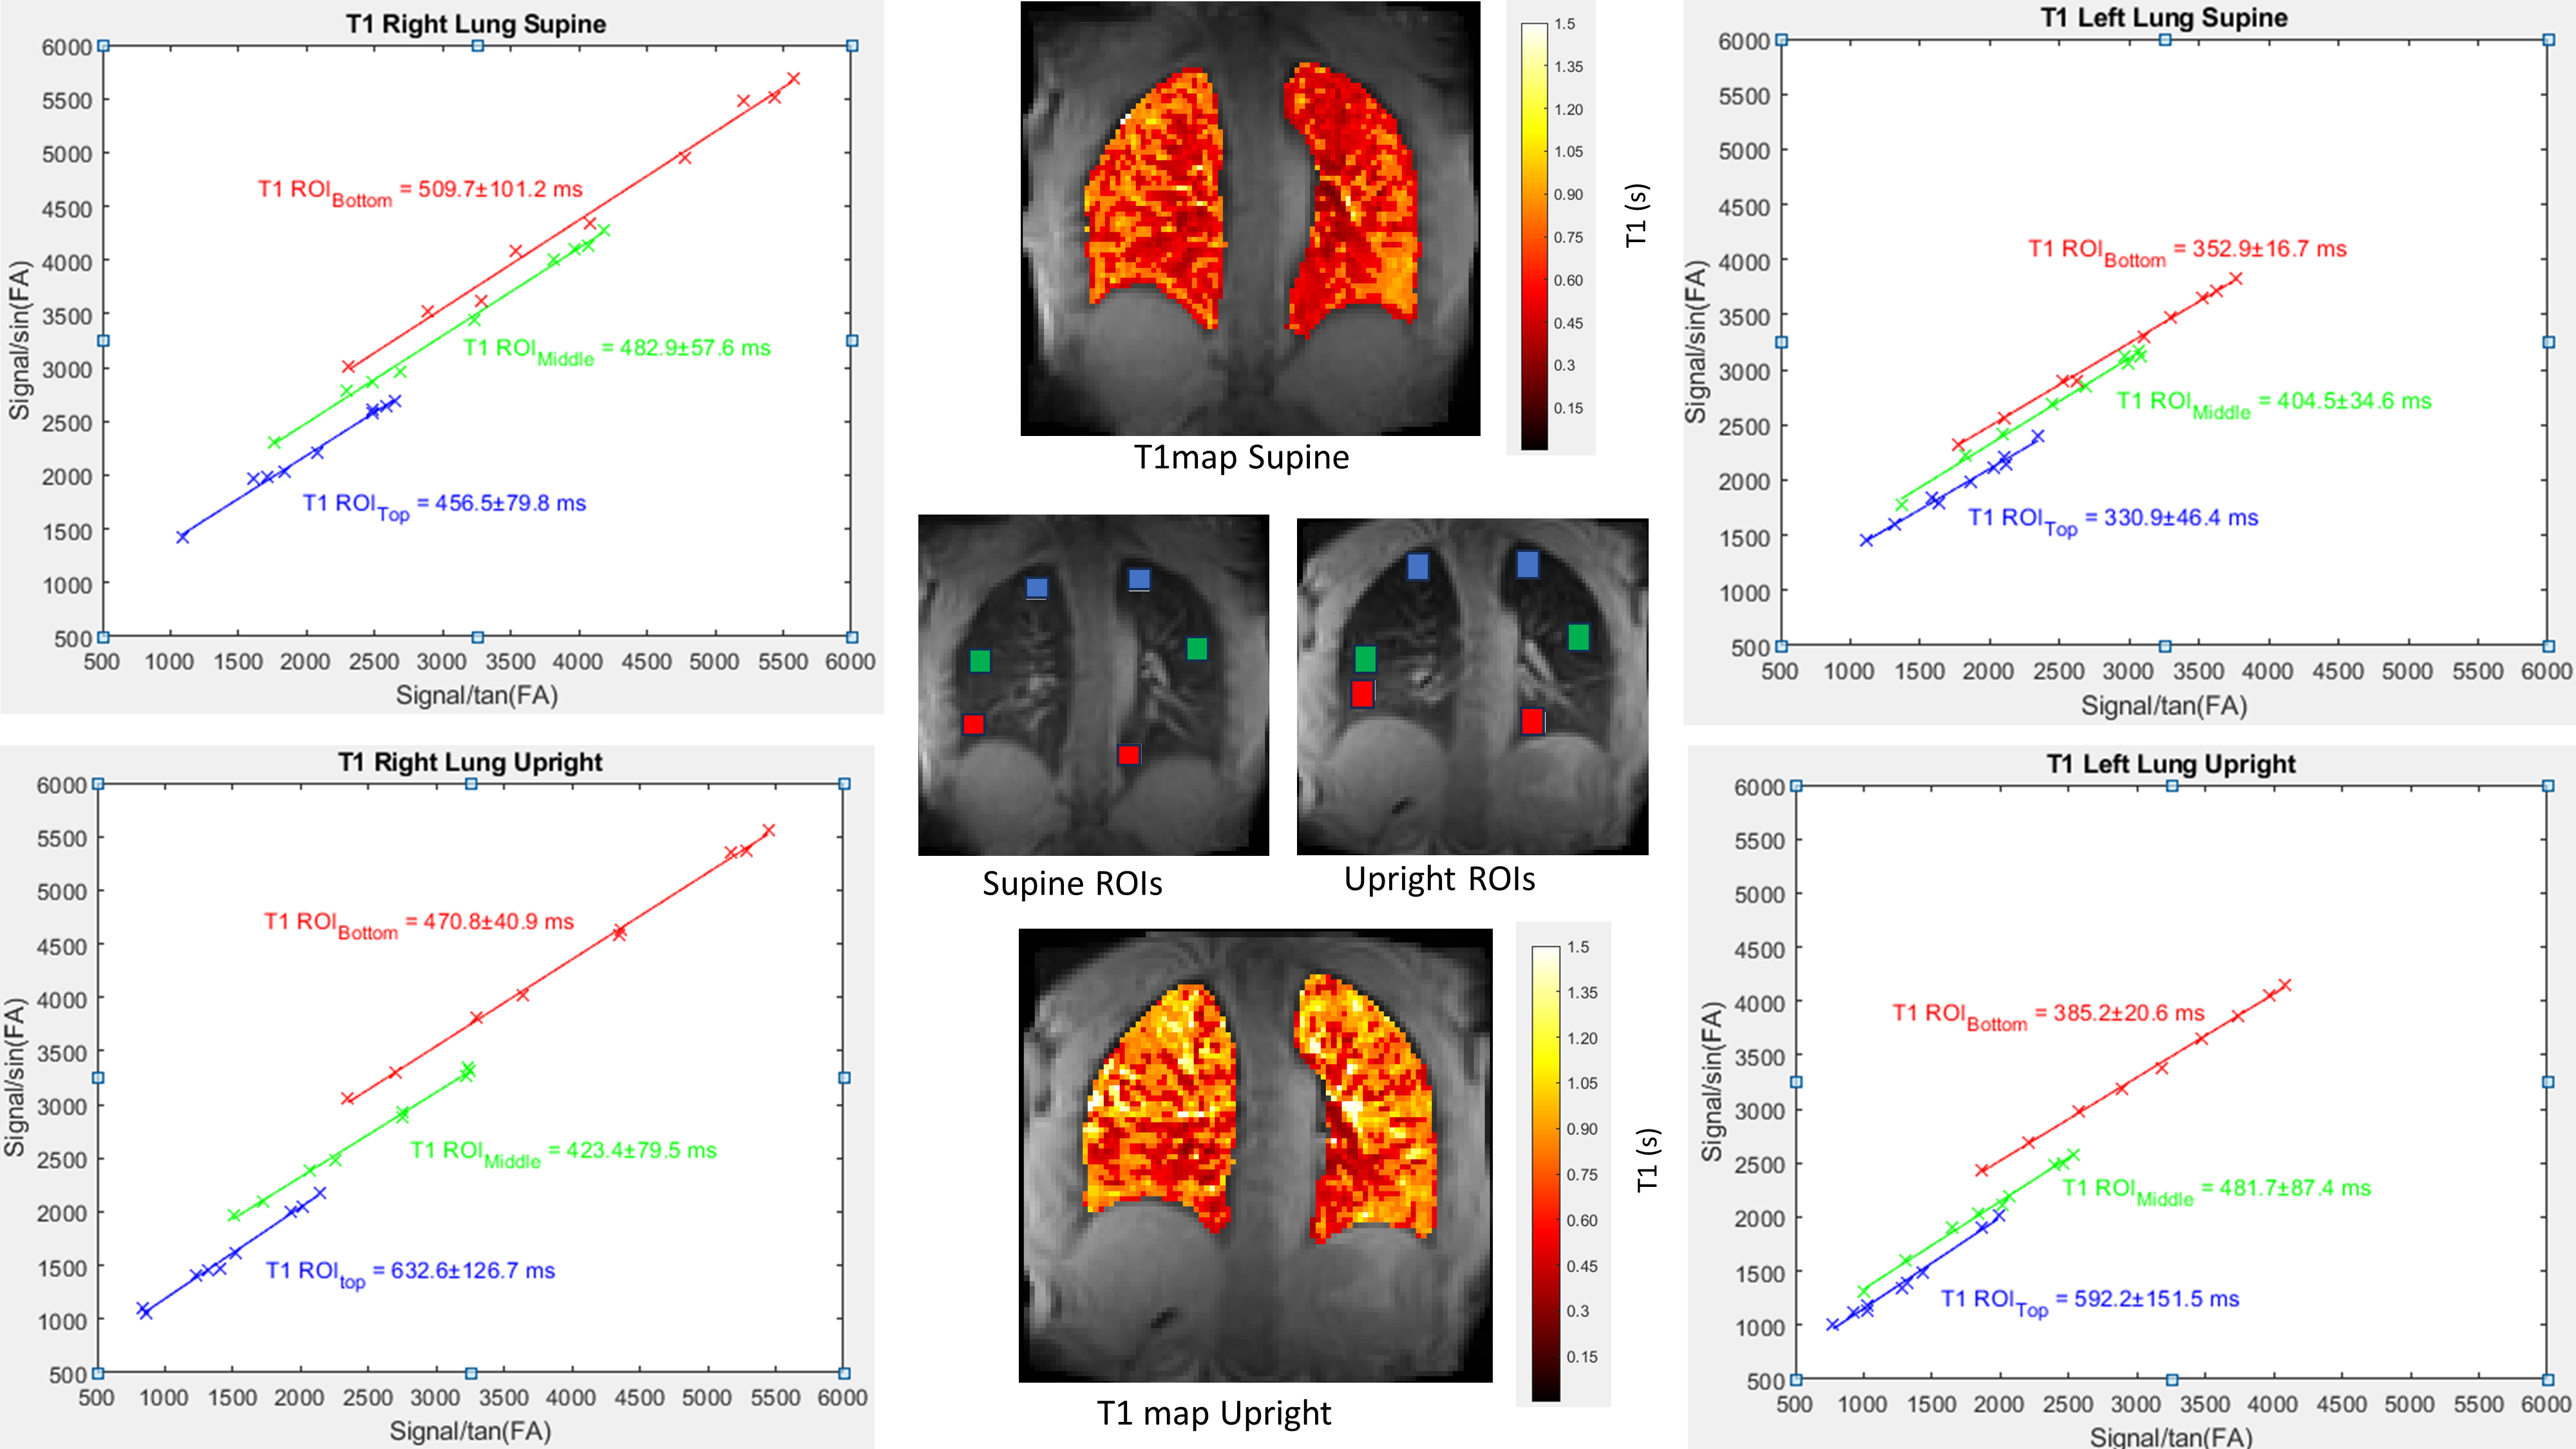
Figure 2: T1 values for top, middle and bottom ROIs (blue, green and red respectively) at (a) supine and (b) upright position for one healthy subject; along with T1 parametric maps and ROI positions. T1 was calculated from the slope of the linear fits of signal intensity/sin(FA) vs signal intensity/tan(FA) plot (T1=−TR/slope). The errors in T1 was found from combination of error from the fit.
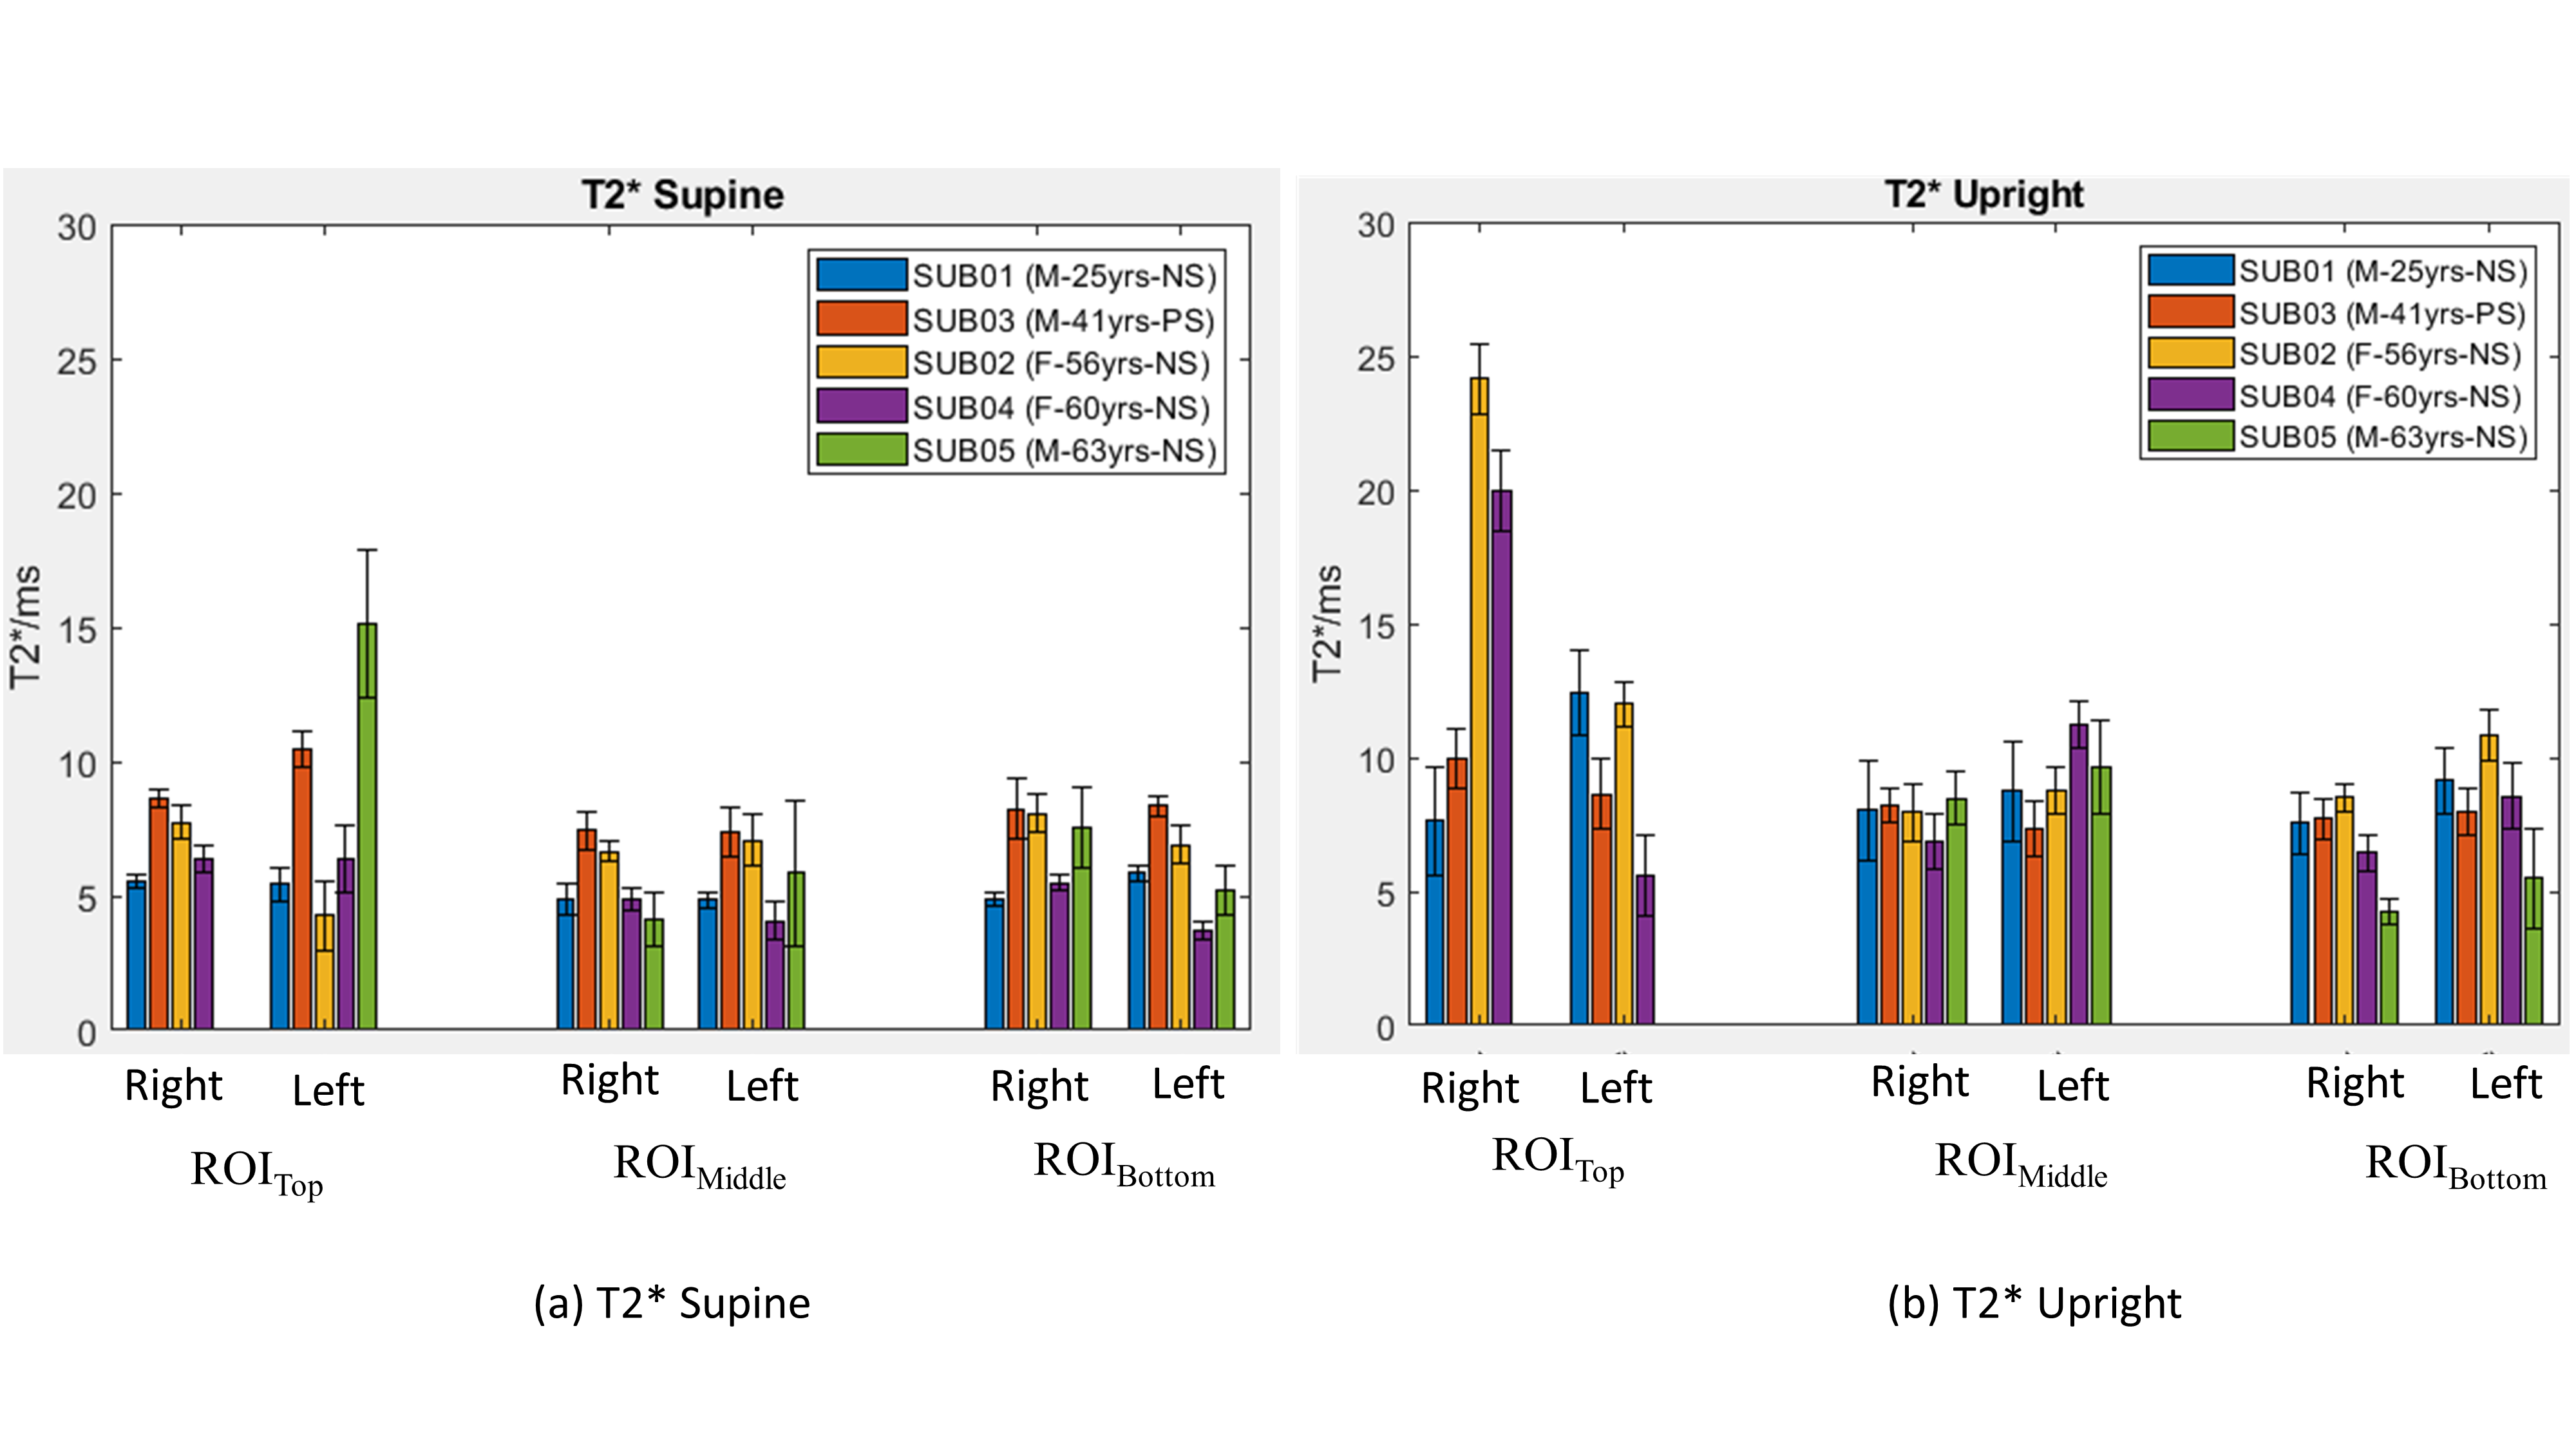
Figure 3: Bar chart showing T2* values for different ROIs at (a) supine and (b) upright posture. The error bars are calculated from standard deviation of T2* over the ROI. T2* values on top ROI show higher variability due to low SNR, especially for upright posture. Keys: M: Male; F: Female; NS (Non-smoker); PS (Previously Smoker).
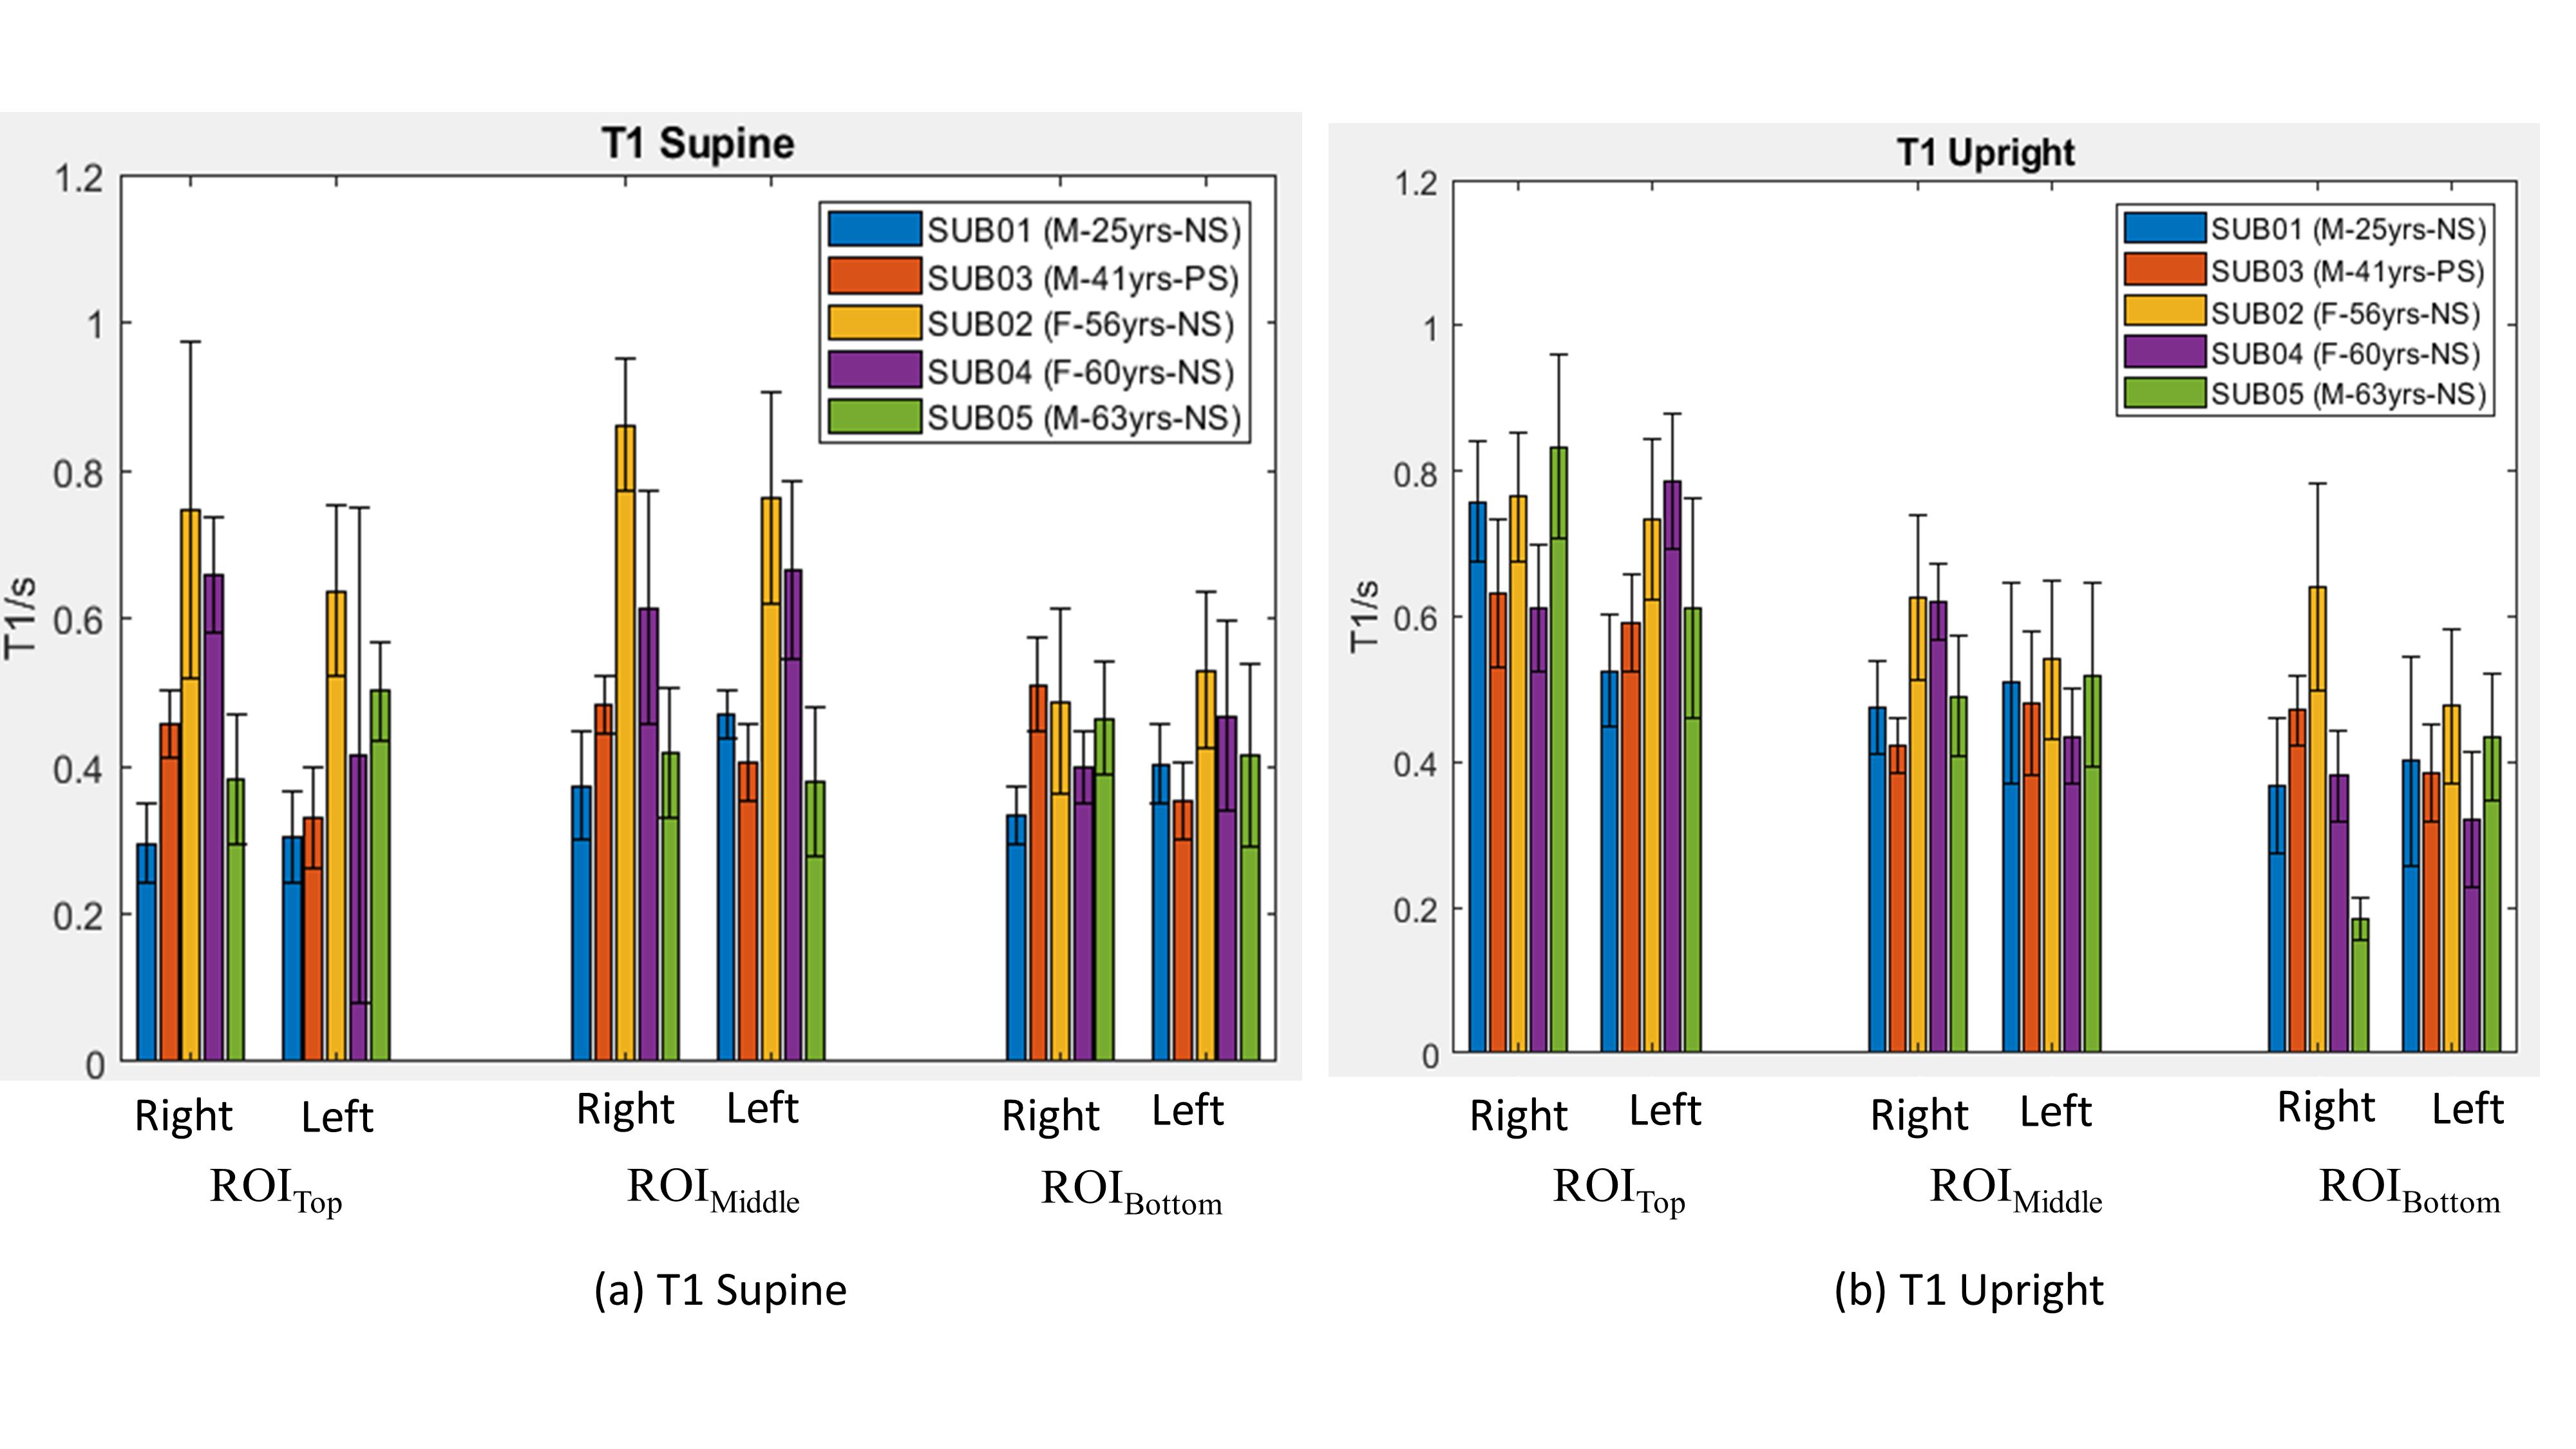
Figure 4: Bar chart showing T1 values for different ROIs at (a) supine and (b) upright posture. The error bars are calculated from standard deviation of T1 over the ROI. A superior-inferior gradient is visible for upright scanner implying the effect of gravity on T1. Keys: M: Male; F: Female; NS (Non-smoker); PS (Previously Smoker).