2905
Pulmonary function in sarcoidosis: Comparison between matrix pencil decomposition MRI at 0.55T and lung function tests1Department of Radiology, University Hospital of Basel, Basel, Switzerland, 2Division of Radiological Physics, Department of Radiology, University Hospital of Basel, Basel, Switzerland, 3Department of Biomedical Engineering, University of Basel, Allschwil, Switzerland, 4Clinic of Respiratory Medicine, University Hospital of Basel, Basel, Switzerland
Synopsis
Keywords: Lung, Lung, Low-field
Motivation: Sarcoidosis is a systemic inflammatory disease in particular affecting lung tissue, thus there is a need for non-invasive and ionizing radiation free technique to assess regional lung function.
Goal(s): To examine correlations between functional lung MRI and pulmonary lung function tests in patients with sarcoidosis.
Approach: Lung ventilation and perfusion was assessed using matrix pencil decomposition MRI at a low-field 0.55T MR-scanner in sarcoidosis patients and a control group of healthy volunteers. Conventional lung function tests in patients were performed with spirometry and body plethysmography.
Results: Strong correlations between the functional lung MRI and the metrics from conventional pulmonary function tests were observed.
Impact: To our knowledge, this is the first study focused on the evaluation of lung function using MRI in sarcoidosis patients. Our results support the use of MRI as a non-invasive diagnostic tool to assess lung function in patients with sarcoidosis.
Introduction
Sarcoidosis is an inflammatory multi-organ disease characterized by widespread development of granulomas affecting particularly the lungs and the lymphatic system. Nowadays, the gold-standard for the identification of lung involvement in sarcoidosis patients is high-resolution computed tomography. However, it is associated with non-negligible exposure to ionizing radiation and does not allow functional assessment. The lung function in sarcoidosis patients is evaluated primarily using well-established clinical techniques such as spirometry and body plethysmography. So far, only few studies focused on the morphological assessment of pulmonary sarcoidosis using MRI1-3 and to the best of our knowledge, there are no studies evaluating lung function using MRI.In this study, we compared the results obtained using conventional lung function tests and pulmonary functional matrix pencil decomposition MRI (MP-MRI)4 at 0.55T in sarcoidosis patients.
Methods
Study population and designThis was a prospective, single-center, observational study. Fifteen sarcoidosis patients (mean age=50y, 8 females, 7 males) with known lung involvement and thirty healthy volunteers (mean age=33.1y, 15 females, 15 males) were enrolled into the study. The study was approved by local Ethics Committee and written informed consent obtained.
Conventional lung function assessment
Spirometry and body plethysmography were performed in all sarcoidosis patients (Jaeger MasterScreen, CareFusion, Germany). Outcome measures were forced expiratory volume in one second (FEV1), forced vital capacity (FVC), residual volume (RV), total lung capacity (TLC) and effective specific airway resistance (sReff).
MR data acquisition
All subjects underwent lung MRI examinations. Scans were performed using a commercial whole-body 0.55T system (MAGNETOM Free.Max, Siemens Healthineers). Lung function was assessed with MP-MRI, yielding ventilation and perfusion images. MP-MRI data were acquired in free-breathing using multi-slice time-resolved ultra-fast steady-state free precession sequence5 (TE/TR = 1.1/2.7ms, TA per image = 202ms, TA/slice = 45s, field-of-view = 475×475mm2, in-plane resolution = 3.7×3.7mm2, slice thickness = 14mm, flip angle = 70°, bandwidth = 908Hz/px).
MP-MRI data evaluation
The signal distributions on the automatically segmented6 ventilation and perfusion maps obtained in healthy volunteers were used to estimate threshold values indicating functional impairment in sarcoidosis patients. Instead of employing a median threshold as in previous studies with MP MRI we used a model based on an exponentially modified Gaussian (EMG) distribution7. The probability density function is expressed as follows:
$$\mathrm{pdf}(x)=\frac{\lambda}{2}e^{\frac{\lambda}{2}(2\mu-\lambda\sigma^2-2x)}\mathrm{erfc}\left( \frac{\mu+\lambda\sigma^2+x}{\sqrt{2}\sigma^2}\right)$$
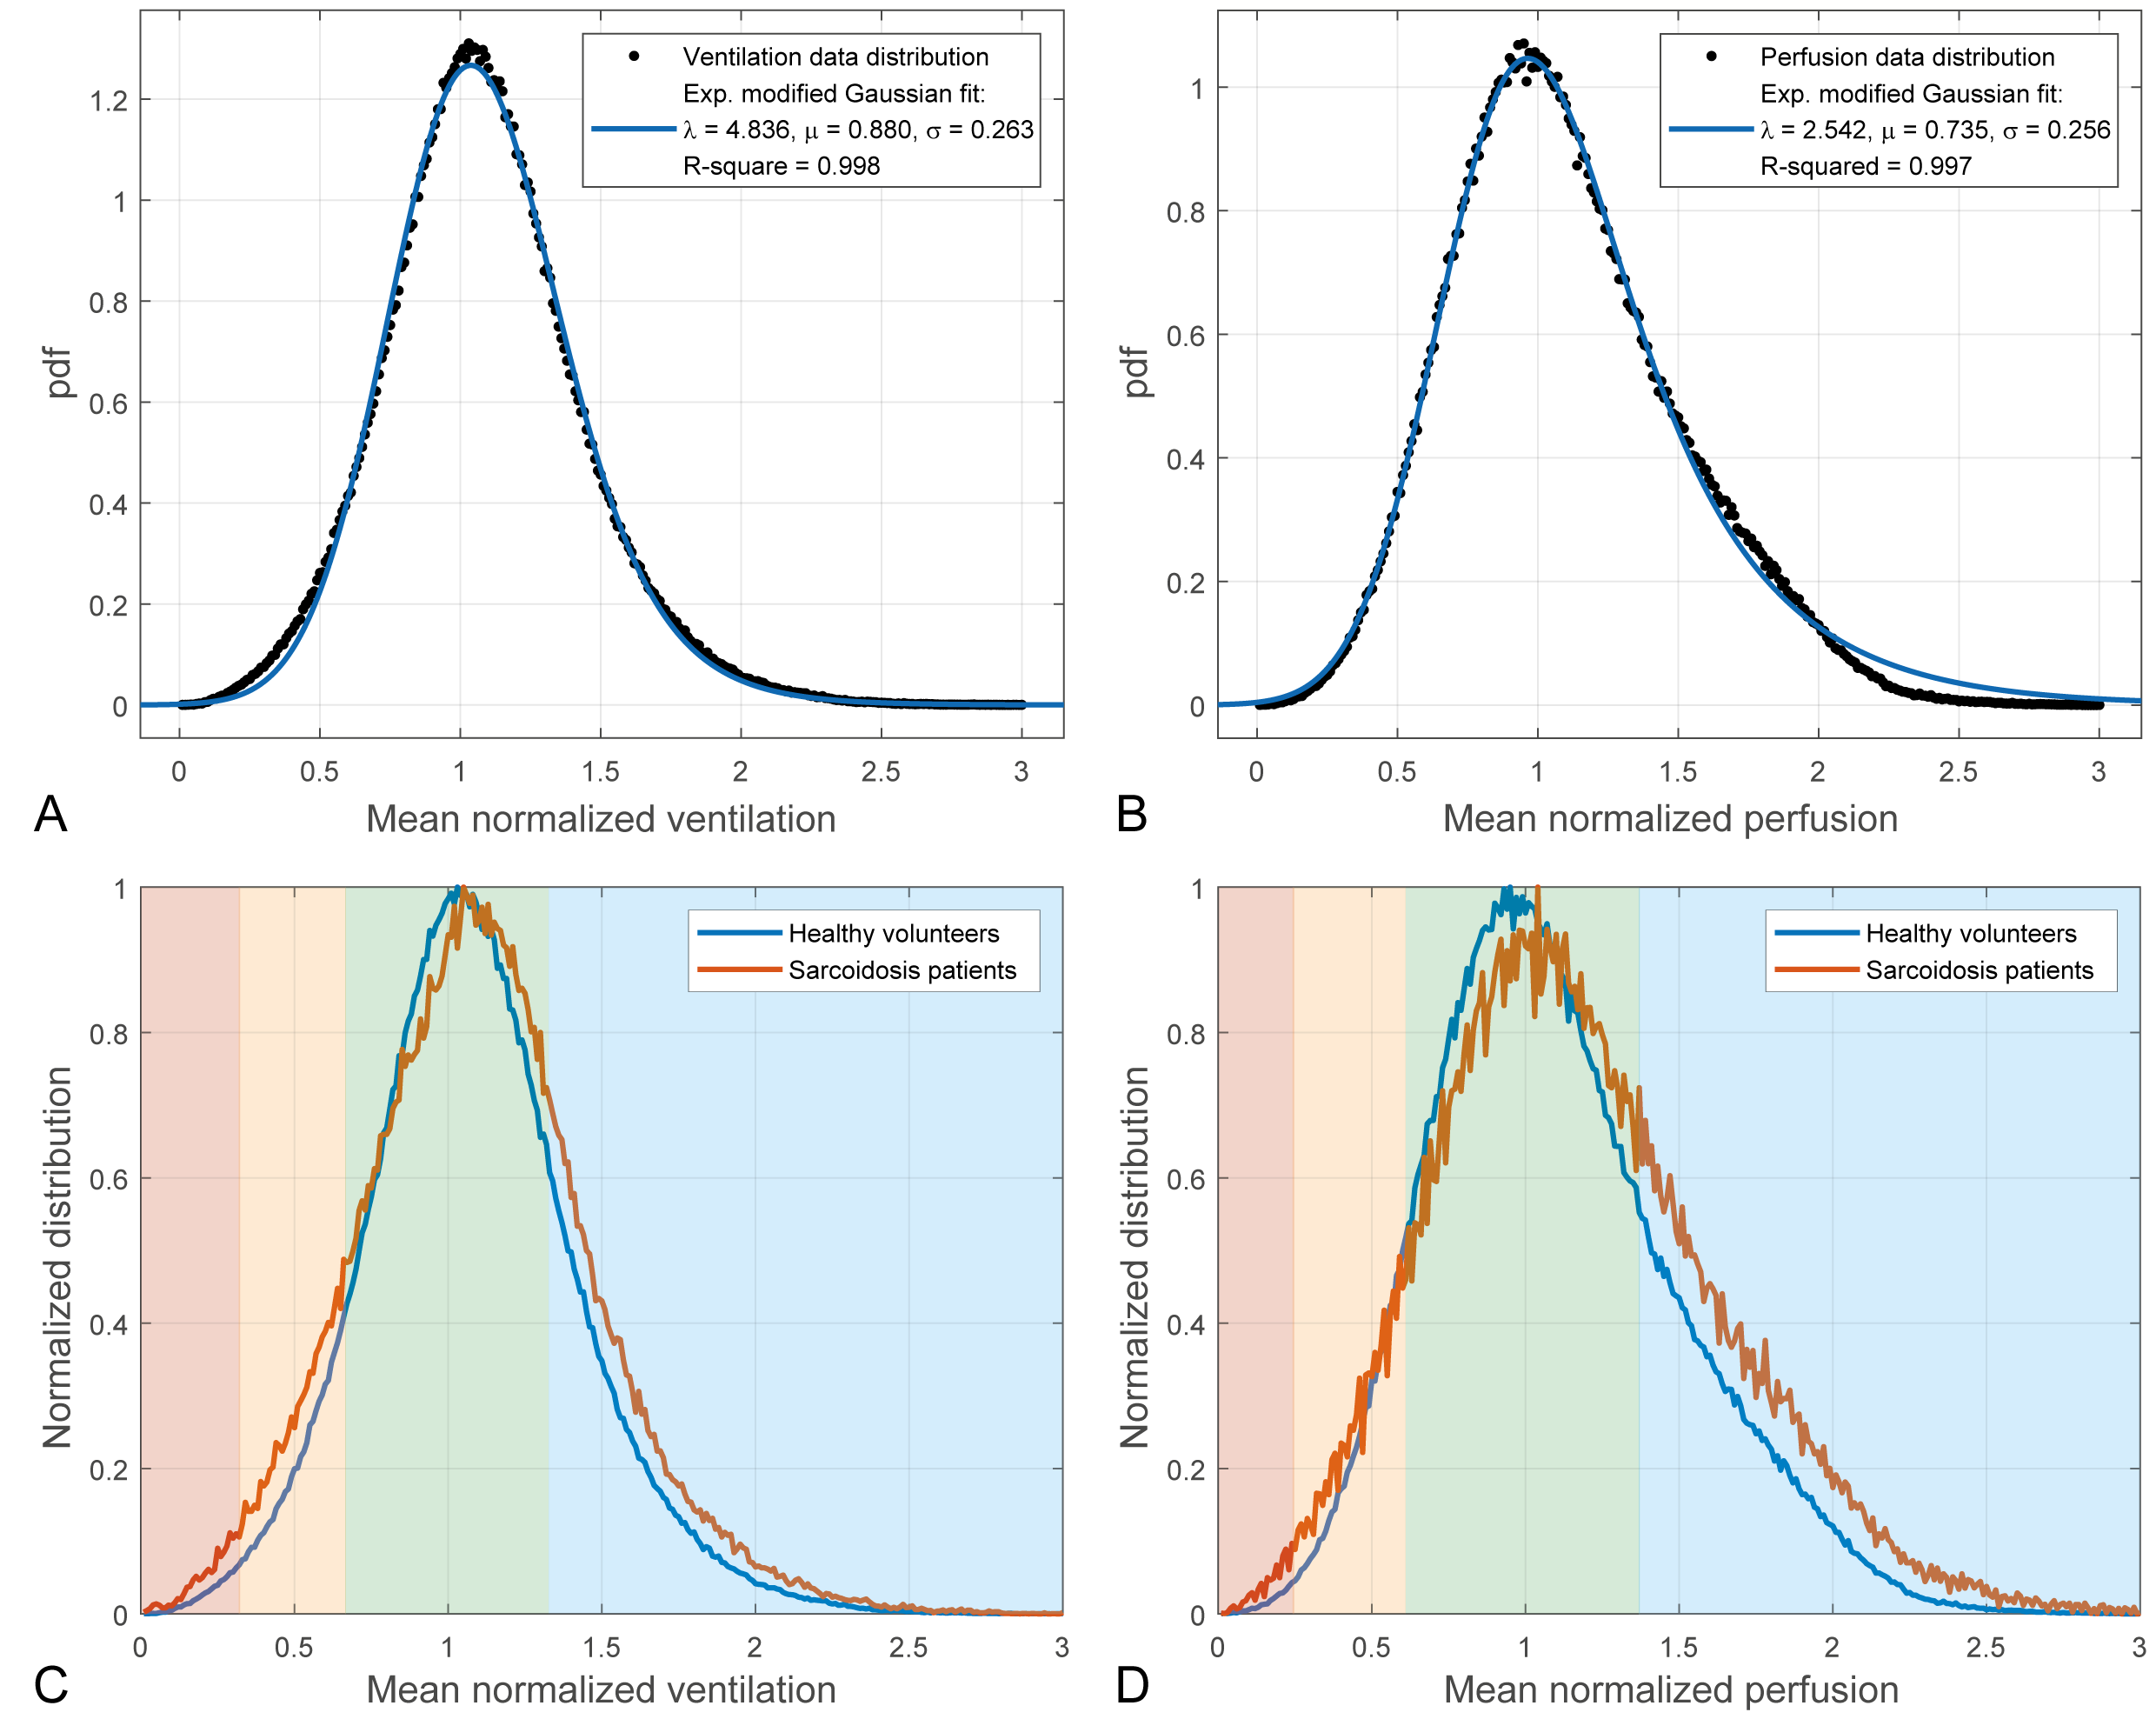
where: $$$\lambda$$$ – exponential rate, $$$\mu$$$ – mean and $$$\sigma$$$ – variance of Gaussian component. Mean of EMG is defined as: $$$\mu_{E}=\mu+1/\lambda$$$ and variance as: $$$\sigma^2_{E}=\sigma^2+1/\lambda^2$$$. Based on the EMG distribution fitted to mean normalized data from all healthy volunteer, we defined four bins corresponding to severely decreased function (SDF) $$$[0,\mu_E-2\sigma_E]$$$, decreased function (DF) $$$]\mu_E-2\sigma_E,\mu_E-\sigma_E]$$$, normal function (NF) $$$]\mu_E-\sigma_E,\mu_E+\sigma_E]$$$, elevated function (EF) $$$]\mu_E+\sigma_E,\infty[$$$.
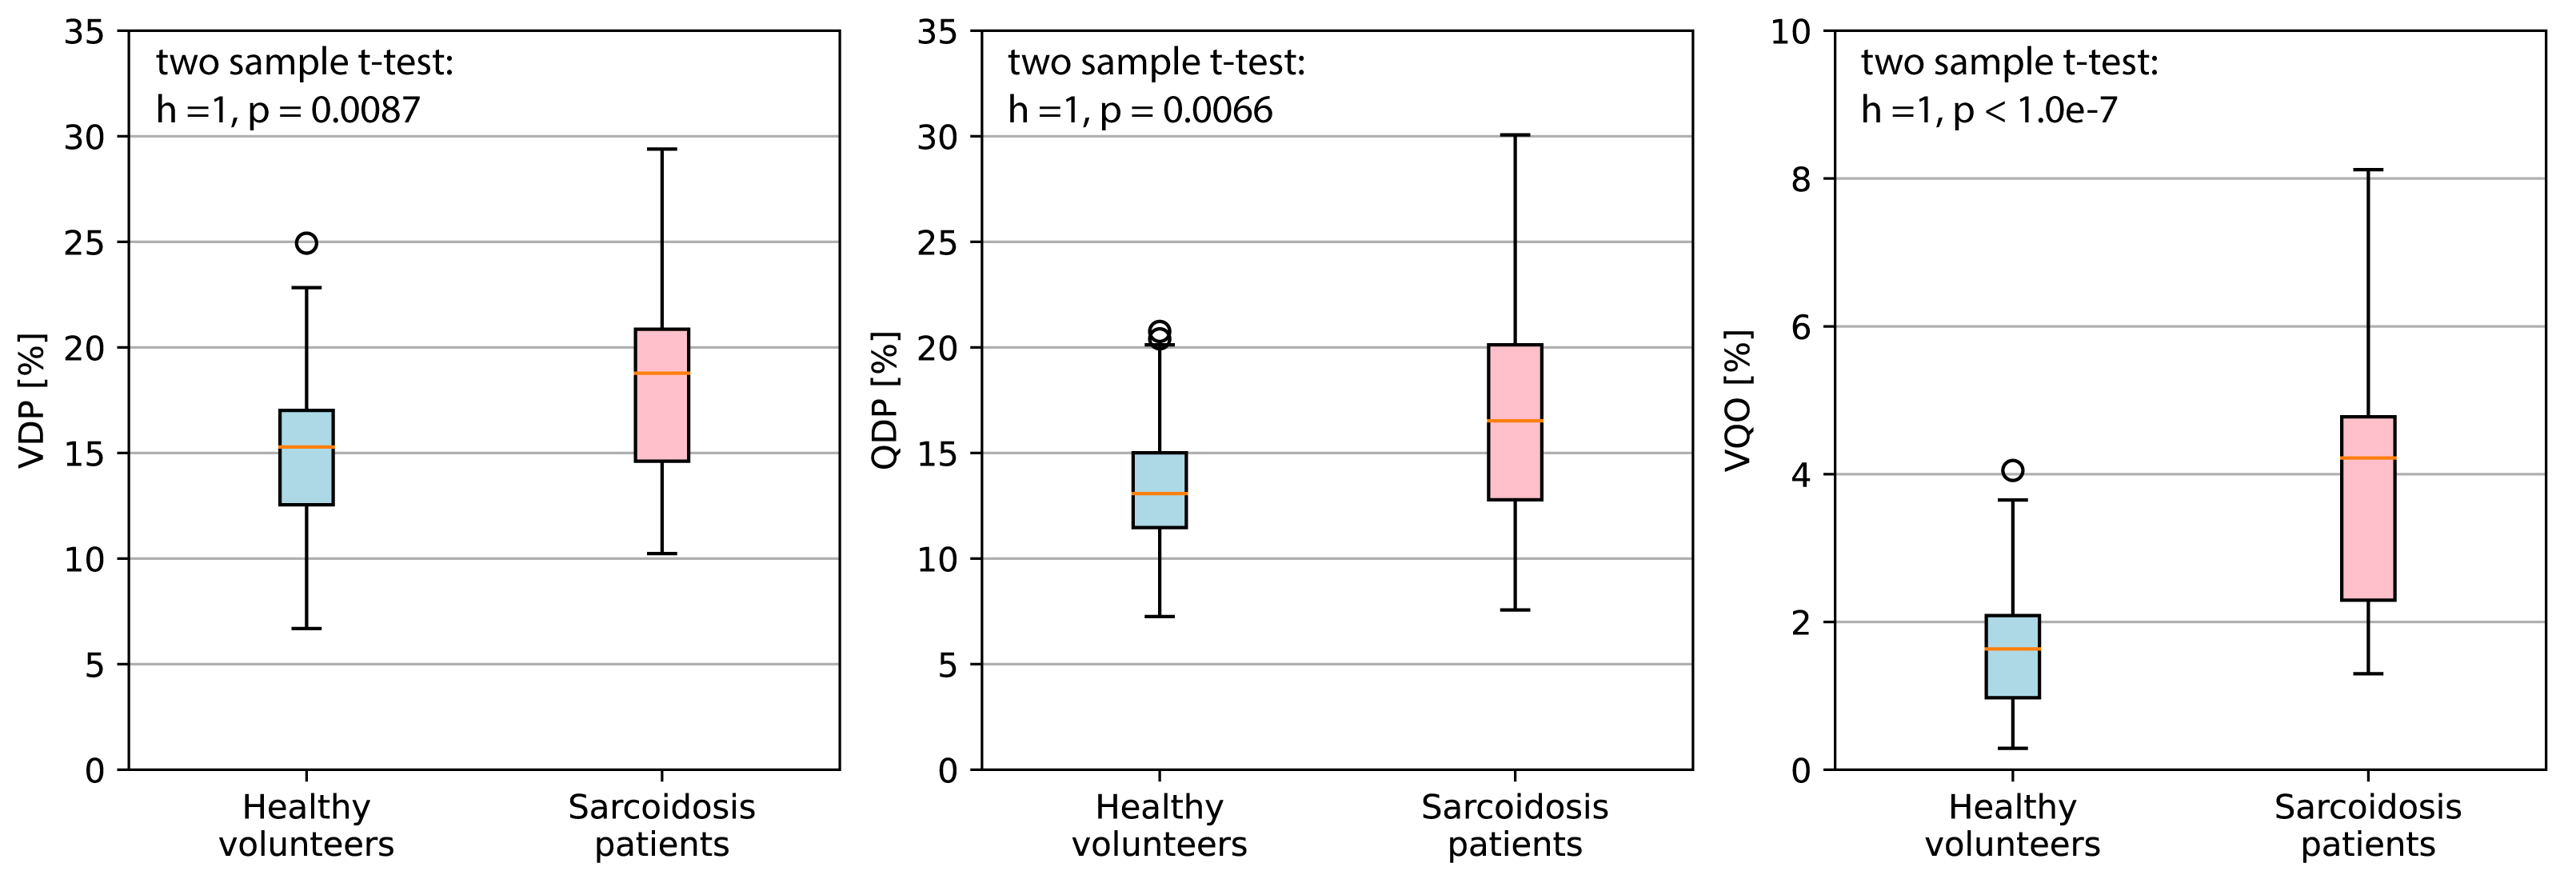
Global outcomes per subject were ventilation defect percentage (VDP), perfusion defect percentage (QDP) and ventilation/perfusion defect overlap (VQO). VDP and QDP were defined as percentage of values classified as SDF or DF in ventilation and perfusion distributions, respectively, of the total segmentation volume in each subject. Similarly, VQO was calculated as percentage of overlapping ventilation and perfusion defects to the total segmentation volume. Correlations between functional indices from MRI and lung function tests were calculated with the Spearman’s correlation coefficients. P-values <0.05 were considered statistically significant.
Results
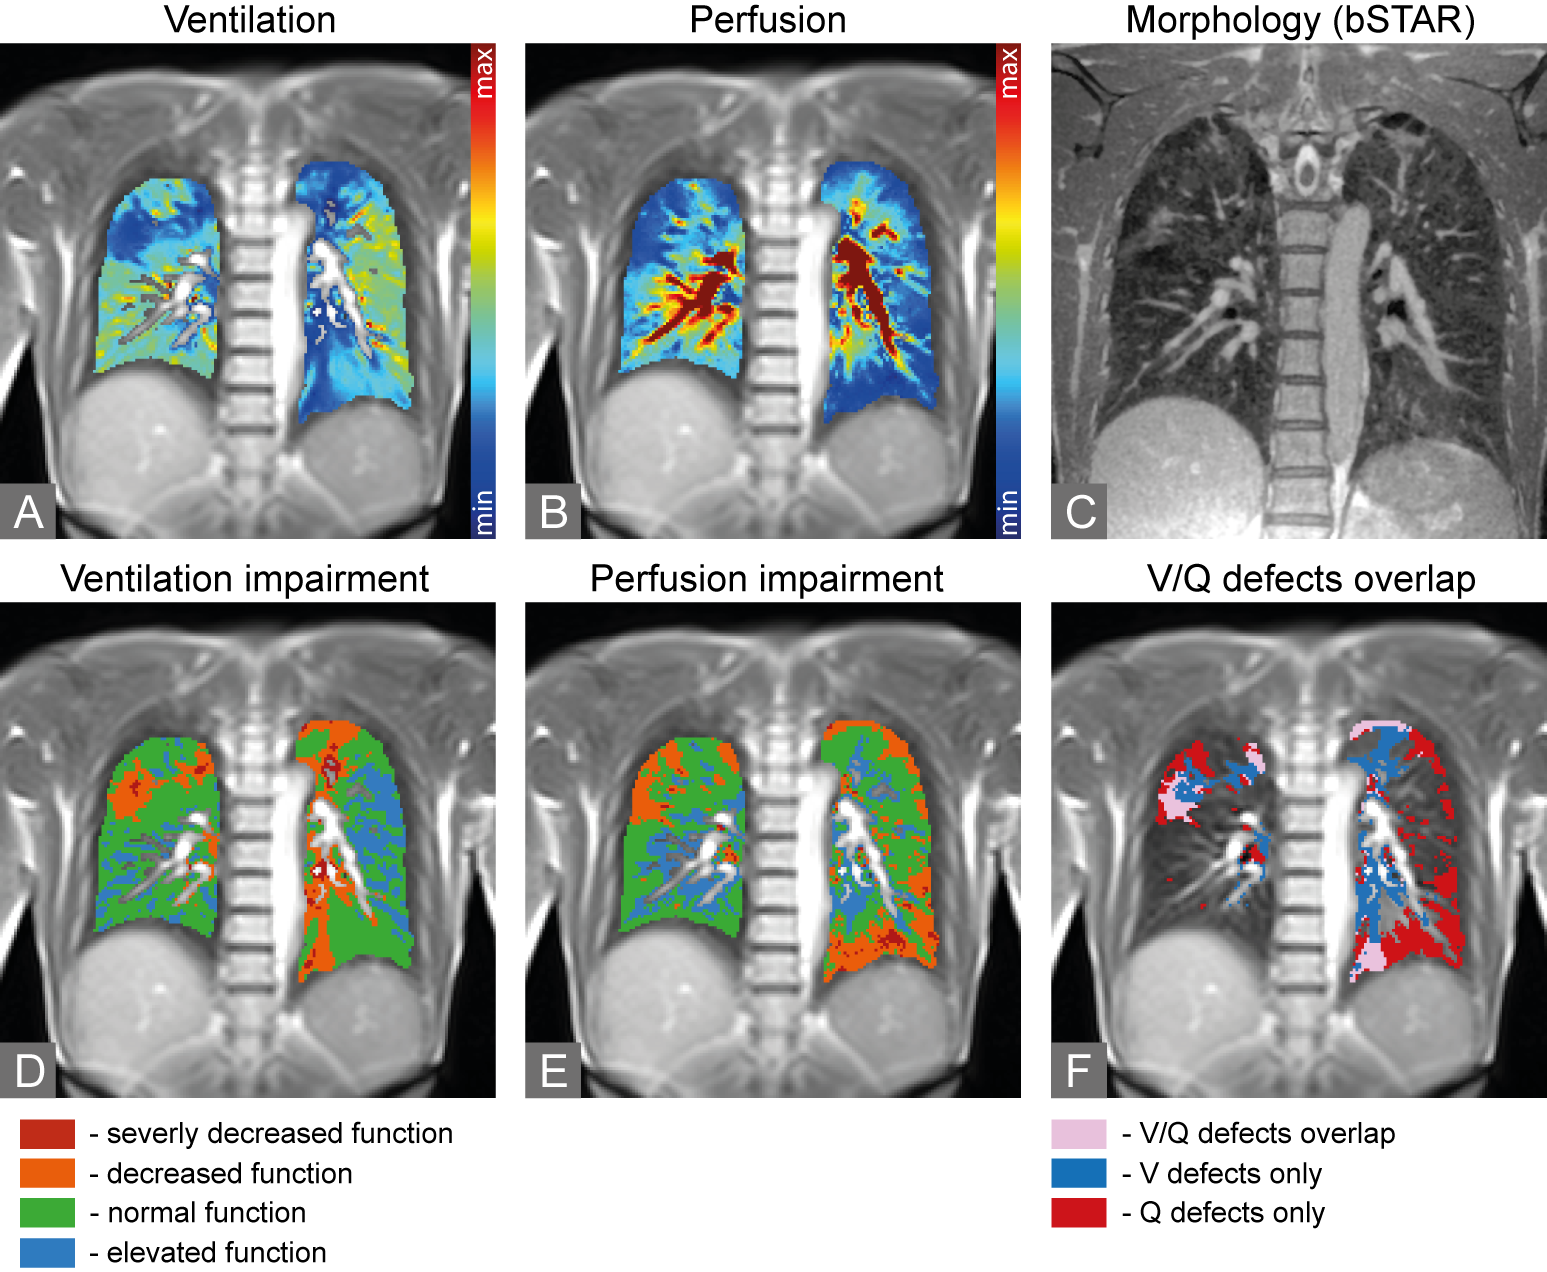
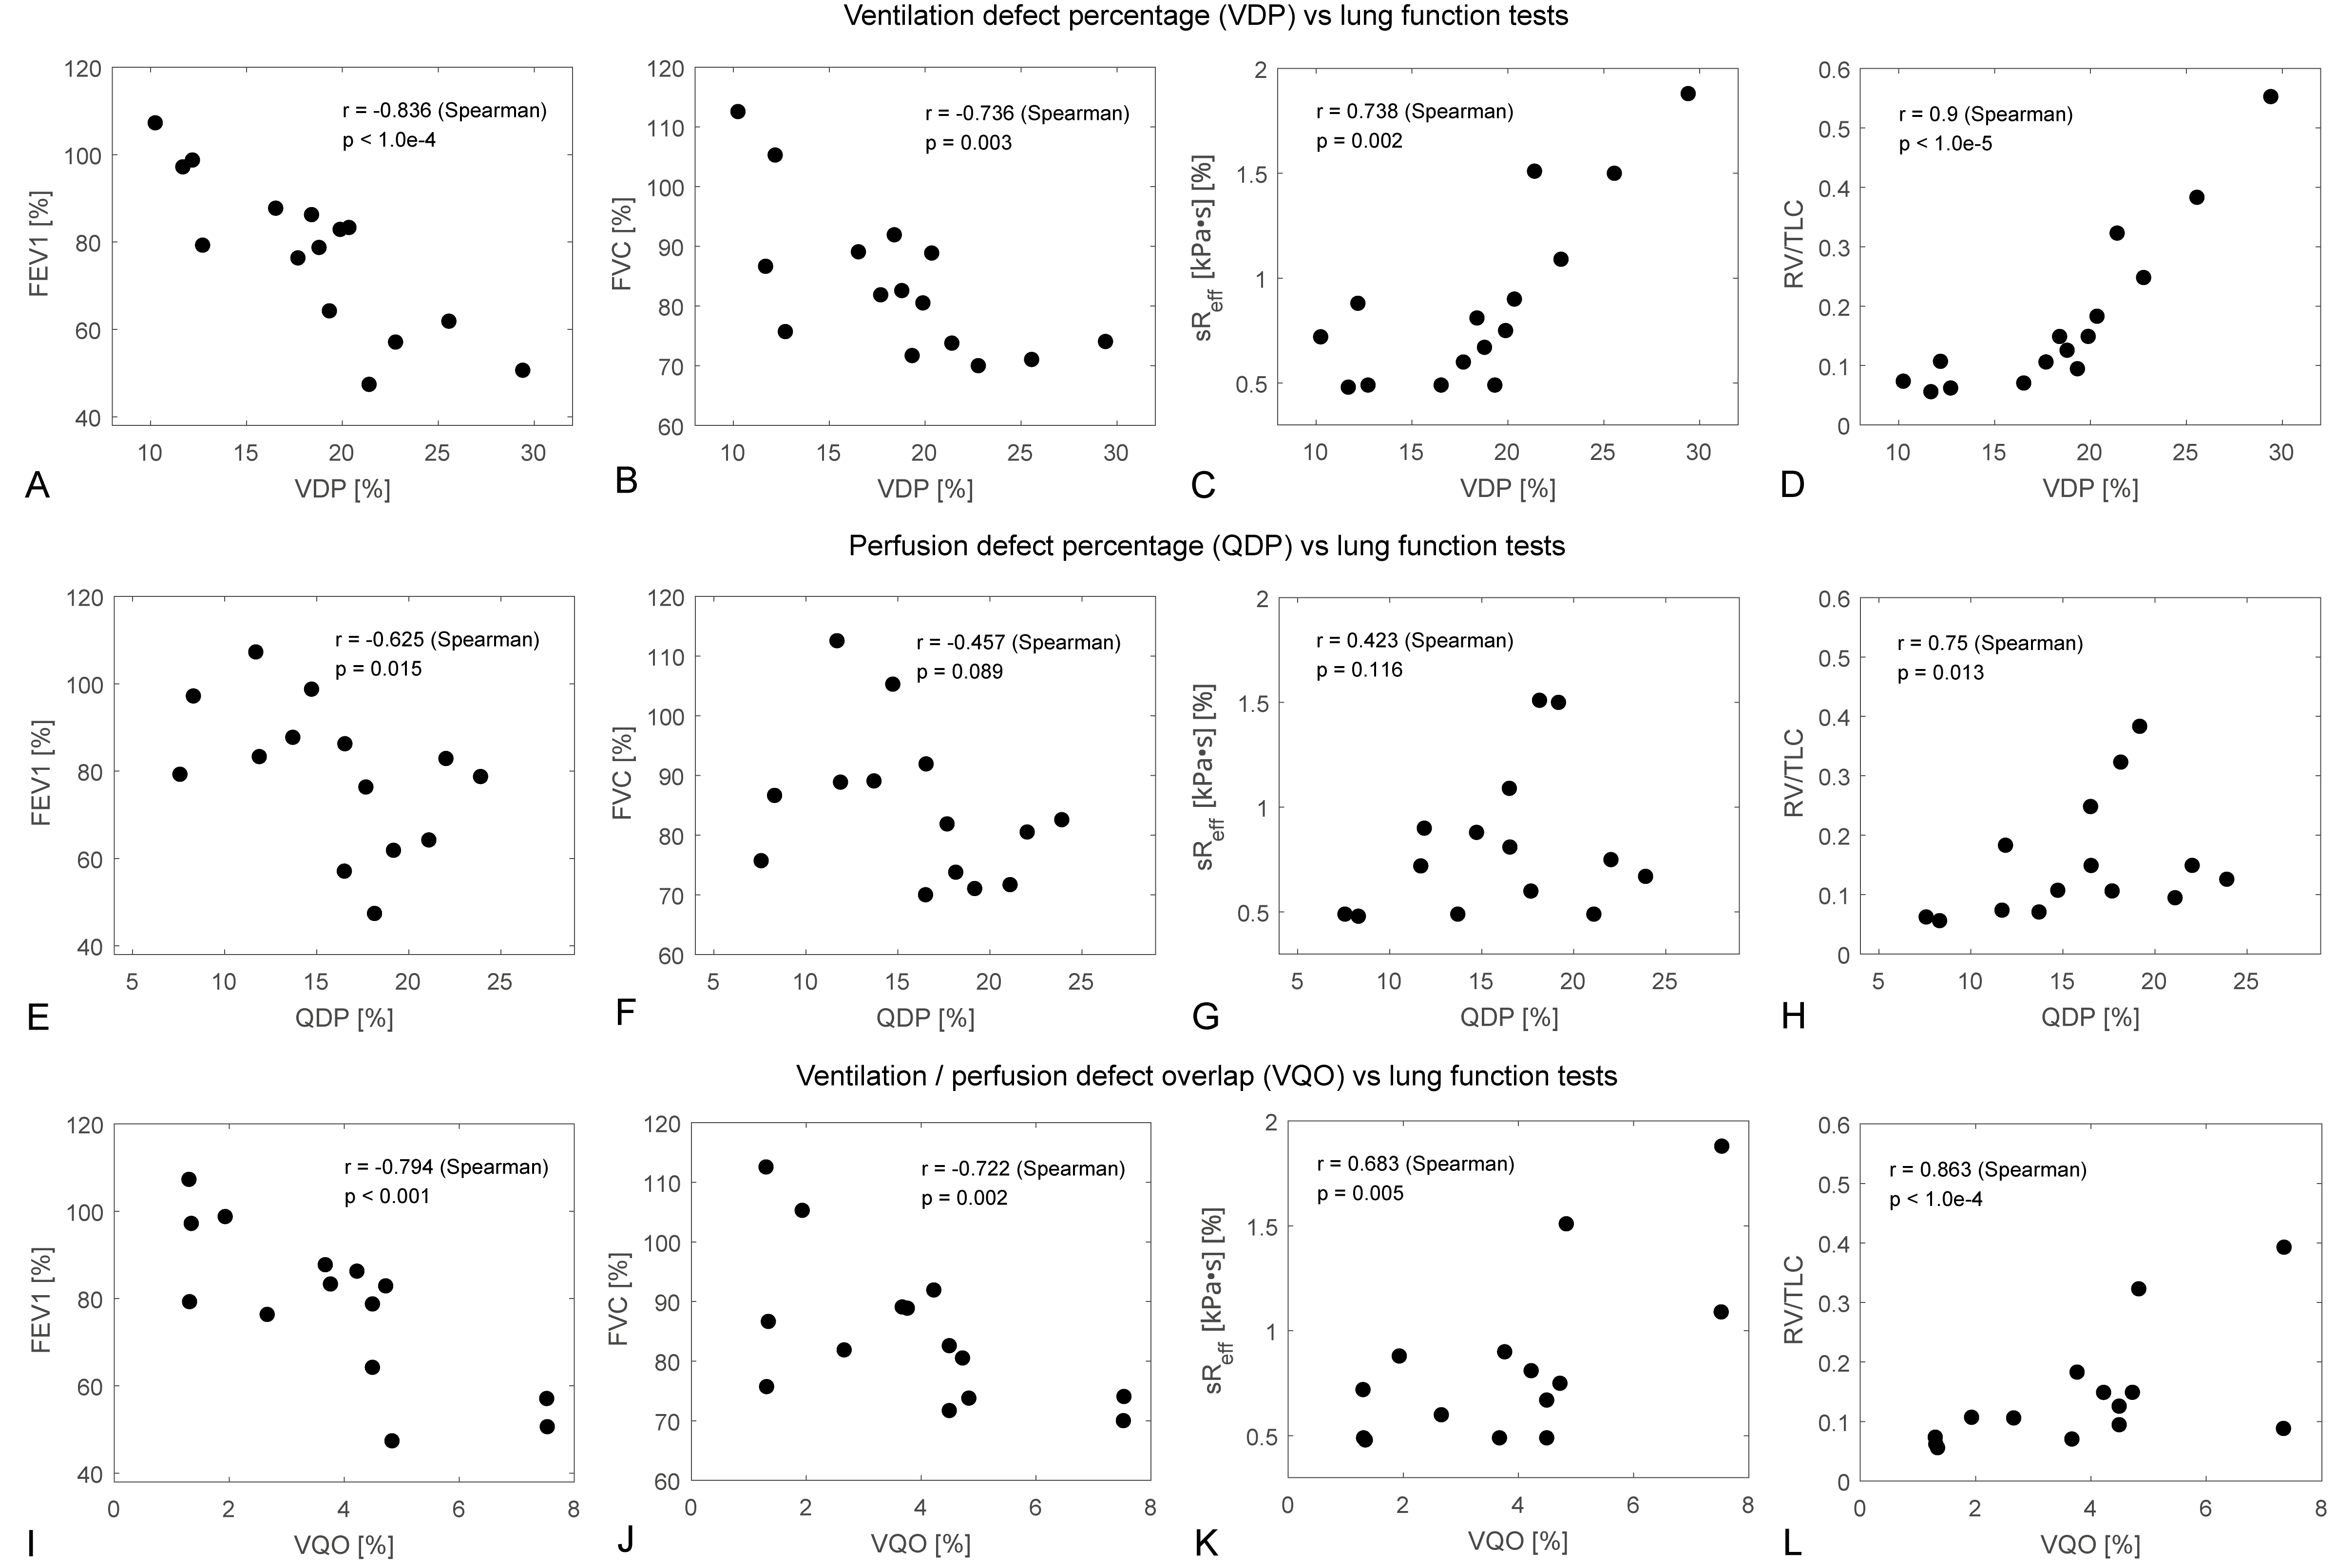
Figure 1 shows EMG distributions fitted to the mean normalized distributions of ventilation (A) and perfusion (B) from healthy subjects, as well as the estimated bins overlaid on signal distributions from sarcoidosis patients and healthy subjects. Exemplary MP-MRI maps obtained in a sarcoidosis patient are presented in Figure 2. VDP, QDP and VQO distributions calculated for all healthy subjects and sarcoidosis patients are visualized in Figure 3. Best correlation between conventional lung function and MRI parameters in sarcoidosis patients was found for the RV/TLC ratio (vs. VDP: r=0.9, p<0.001, vs. QDP: r=0.75, p=0.01) and FEV1 (vs. VDP: r=0.84, p<0.001, vs. QDP: r=0.63, p=0.01). All other correlations can be found in Figure 4 and Table 1.Discussion and Conclusion
In this work, we compared functional information obtained in sarcoidosis patients using spirometry and body plethysmography with functional pulmonary MP-MRI at 0.55T. We observed strong correlations between functional parameters from MRI and lung function tests, particularly between the VDP and VQO with FEV1 and RV/TLC ratio, respectively. A somewhat weaker correlation was observed between QDP and spirometry outcomes.Functional examinations using the MP-MRI technique are non-invasive and easy-to-perform on a low-field clinical MR scanner, requiring only minimal patient compliance due to free-breathing. In conclusion, the results of this study support the usage of functional lung MRI as a diagnostic tool in patients with sarcoidosis. The outcomes of MP-MRI might be used as a complementary quantitative imaging biomarker in future studies.
Acknowledgements
Tanja Haas for support in data acquisition.References
1. Brady D, Lavelle LP, McEvoy SH, Murphy DJ, Gallagher A, Gibney B, Butler MW, Shortt F, McMullan M, Fabre A, Lynch DA, Abbara S, Donnelly SC, Dodd JD. Assessing fibrosis in pulmonary sarcoidosis: late-enhanced MRI compared to anatomic HRCT imaging. QJM. 2016 Apr;109(4):257-64. doi: 10.1093/qjmed/hcv200.
2. Gorkem SB, Köse S, Lee EY, Doğanay S, Coskun AS, Köse M. Thoracic MRI evaluation of sarcoidosis in children. Pediatr Pulmonol. 2017 Apr;52(4):494-499. doi: 10.1002/ppul.23614. .
3. Chung JH, Little BP, Forssen AV, Yong J, Nambu A, Kazlouski D, Puderbach M, Biederer J, Lynch DA. Proton MRI in the evaluation of pulmonary sarcoidosis: comparison to chest CT. Eur J Radiol. 2013 Dec;82(12):2378-85. doi: 10.1016/j.ejrad.2013.08.019.
4. Bauman G, Bieri O. Matrix pencil decomposition of time-resolved proton MRI for robust and improved assessment of pulmonary ventilation and perfusion. Magn Reson Med. 2017 Jan;77(1):336-342. doi: 10.1002/mrm.26096.
5. Bauman G, Pusterla O, Bieri O. Ultra-fast Steady-State Free Precession Pulse Sequence for Fourier Decomposition Pulmonary MRI. Magn Reson Med. 2016 Apr;75(4):1647-53. doi: 10.1002/mrm.25697.
6. Pusterla O, Heule R, Santini F, Weikert T, Willers C, Andermatt S, Sandkühler R, Nyilas S, Latzin P, Bieri O, Bauman G. MRI lung lobe segmentation in pediatric cystic fibrosis patients using a recurrent neural network trained with publicly accessible CT datasets. Magn Reson Med. 2022 Jul;88(1):391-405. doi: 10.1002/mrm.29184.
7. Golubev A. Exponentially Modified Peak Functions in Biomedical Sciences and Related Disciplines. Comput Math Methods Med. 2017;2017:7925106. doi: 10.1155/2017/7925106.
8. Bauman G, Lee NG, Tian Y, Bieri O, Nayak KS. Submillimeter lung MRI at 0.55 T using balanced steady-state free precession with half-radial dual-echo readout (bSTAR). Magn Reson Med. 2023 Nov;90(5):1949-1957. doi: 10.1002/mrm.29757.
Figures