2903
Development and First Application of Combined Testicular Magnetic Resonance Fingerprinting and ADC Mapping in Healthy Volunteers1Department of Radiology, University Hospitals Cleveland Medical Center, Cleveland, OH, United States, 2Department of Radiology, Case Western Reserve University, Cleveland, OH, United States, 3Urology Institute, University Hospitals Cleveland Medical Center, Cleveland, OH, United States
Synopsis
Keywords: Urogenital, MR Fingerprinting
Motivation: Azoospermia care often requires performing microdissection procedures for sperm extraction that are unsuccessful in 50% of men.
Goal(s): Investigate the feasibility of a combined MRF and diffusion mapping protocol of the testicles, as well as quantify the normal ADC, T1 and T2 values of the left and right testicles.
Approach: Regions of interest were annotated on ADC and T1 maps, these were copied to T2 maps.
Results: Mean ADC, axial T1 and T2 values were similar between left and right testicles. Mean coronal T1 and T2 values of the left testicles were higher than those of the right testicles.
Impact: The acquisition of a dedicated protocol for combined MRF and diffusion mapping of the testicles is feasible. This work paves the way for prospective studies investigating non-invasive characterization of the testicles in patients with obstructive and non-obstructive azoospermia.
INTRODUCTION
Azoospermia affects 1% of all men, 10-15% of men with infertility, and can be categorized into obstructive and non-obstructive azoospermia, each requiring a distinct management strategy1. Obstructive and non-obstructive azoospermia can often be differentiated through clinical history, physical examination, semen analysis, and genetic testing. Currently, in non-obstructive azoospermia, the standard of care is to perform an invasive procedure, called microdissection testicular sperm extraction. However, sperm is found for in vitro fertilization only in 50% of men. Magnetic Resonance Fingerprinting (MRF) is a fully quantitative MRI technique that allows the simultaneous acquisition of T1 and T2 maps. In other organs, MRF was able to provide surrogate markers of kidney function2, improve hepatic lesion characterization3, and the assessment of treatment response in breast cancer4. We hypothesize that like other organs, the acquisition of MRF-derived T1 and T2 relaxation times in addition to ADC values from conventional diffusion MRI, would provide crucial data to improve patient selection for testicular biopsy and predict sperm retrieval in men with non-obstructive azoospermia. Therefore, as the initial step towards this goal, we investigated the feasibility of performing a dedicated examination for combined MRF and diffusion mapping of the testicles. We also quantified the normal ADC values along with the normal MRF T1 and T2 relaxation times of the left and right testicles (LT and RT, respectively) in healthy volunteers.METHODS
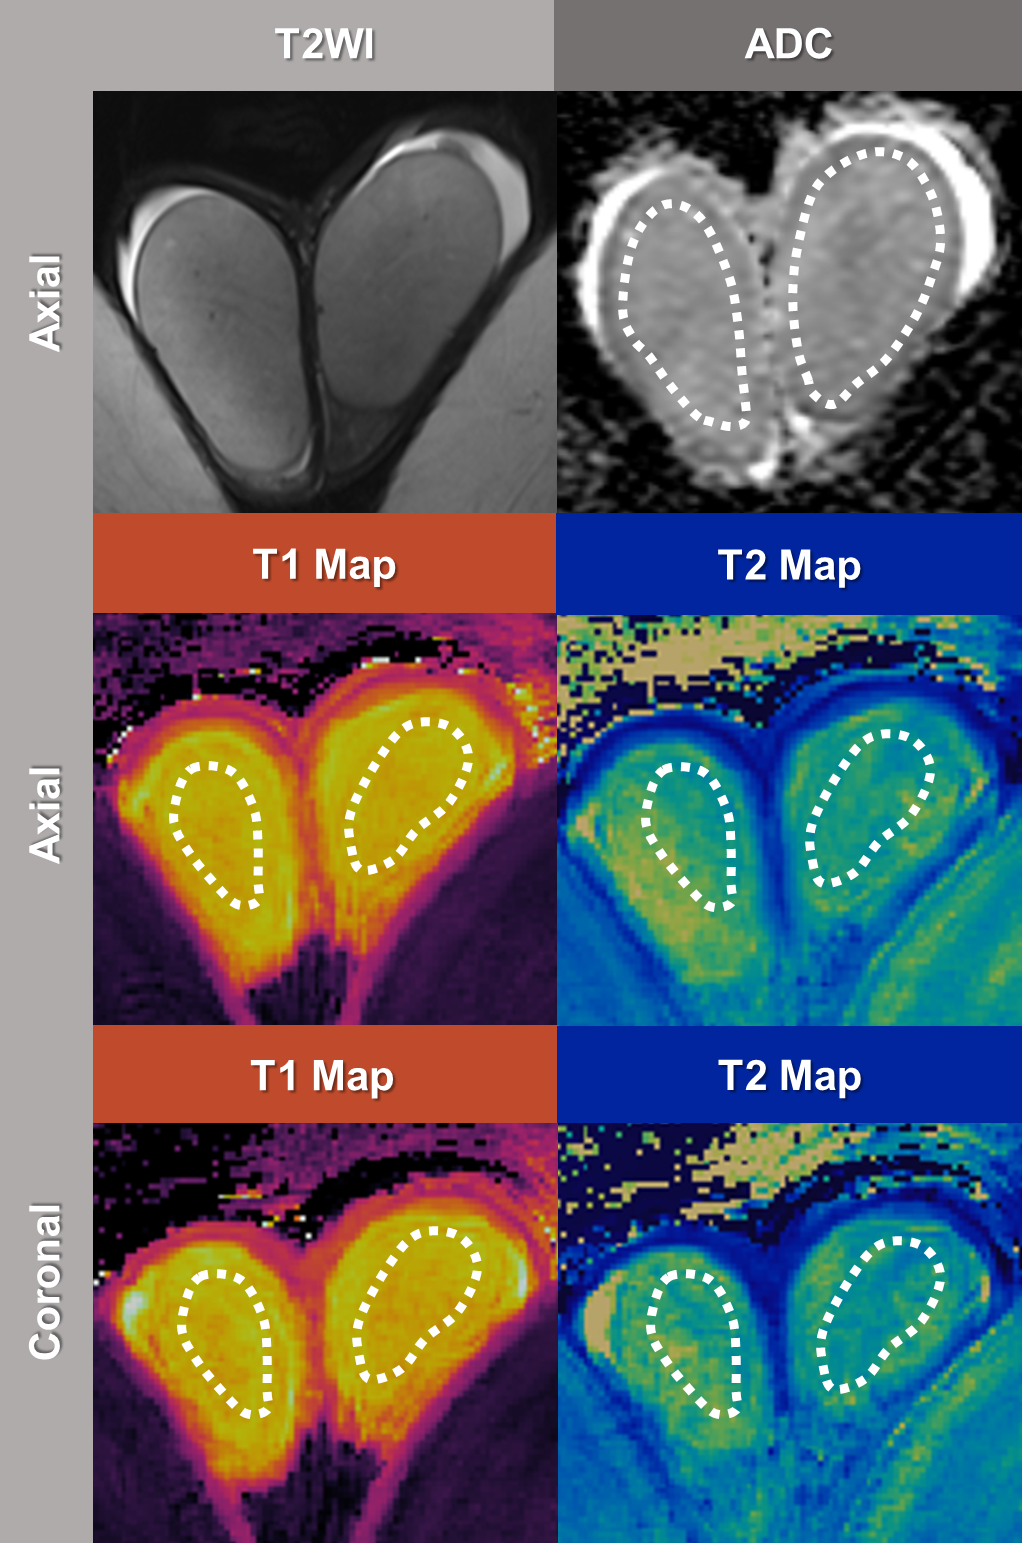
This IRB-approved prospective study recruited 10 healthy volunteers aged 18 years or older with no history of prior testicular interventions or previous investigation of hormonal imbalances or infertility between May and September 2023. One volunteer was excluded due to the lack of a complete MRF acquisition. MRI and MRF exams were conducted at a 3T scanner with the use of standard body and spine array coils. To determine testicular volumes, manual segmentations of the LT and RT were performed across all axial slices of the T2-weighted images with the use of 3D Slicer5. Regions of interest (ROI) were annotated on ADC and axial and coronal T1 maps (Figure 1), using the Multi-Image Analysis Graphical User Interface6. This procedure was performed on all axial slices, with T1 ROIs copied to inherently co-registered T2 maps. ROIs containing mean ADC, axial T1 and T2 as well as coronal T1 and T2 values of the LT and RT were subsequently averaged for analysis. The Shapiro-Wilk test demonstrated that variables were normally distributed. Continuous variables were expressed as means and standard deviations and subsequently compared with T-student tests.RESULTS
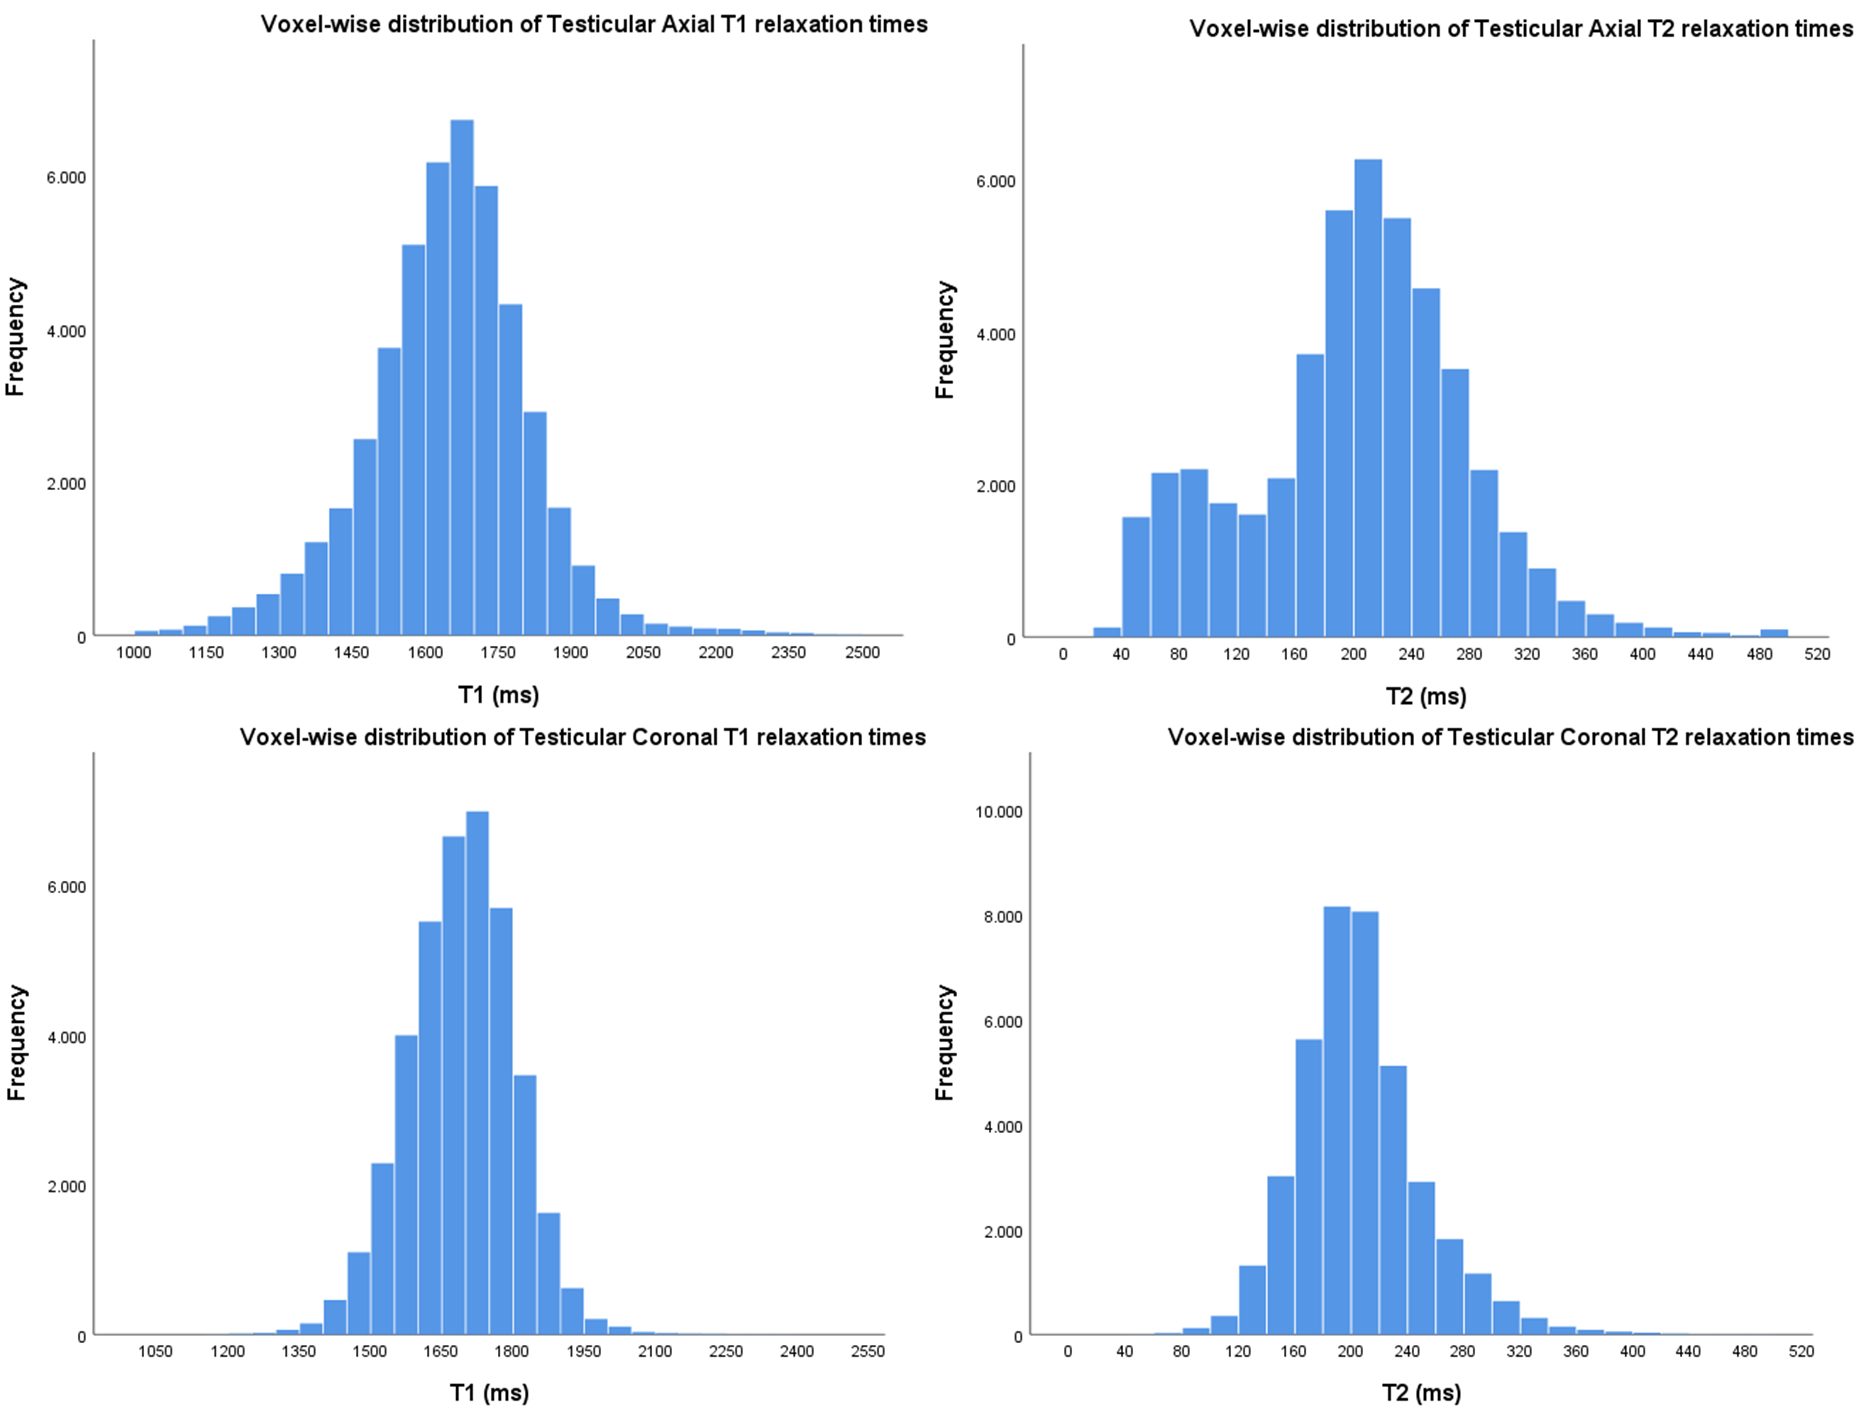
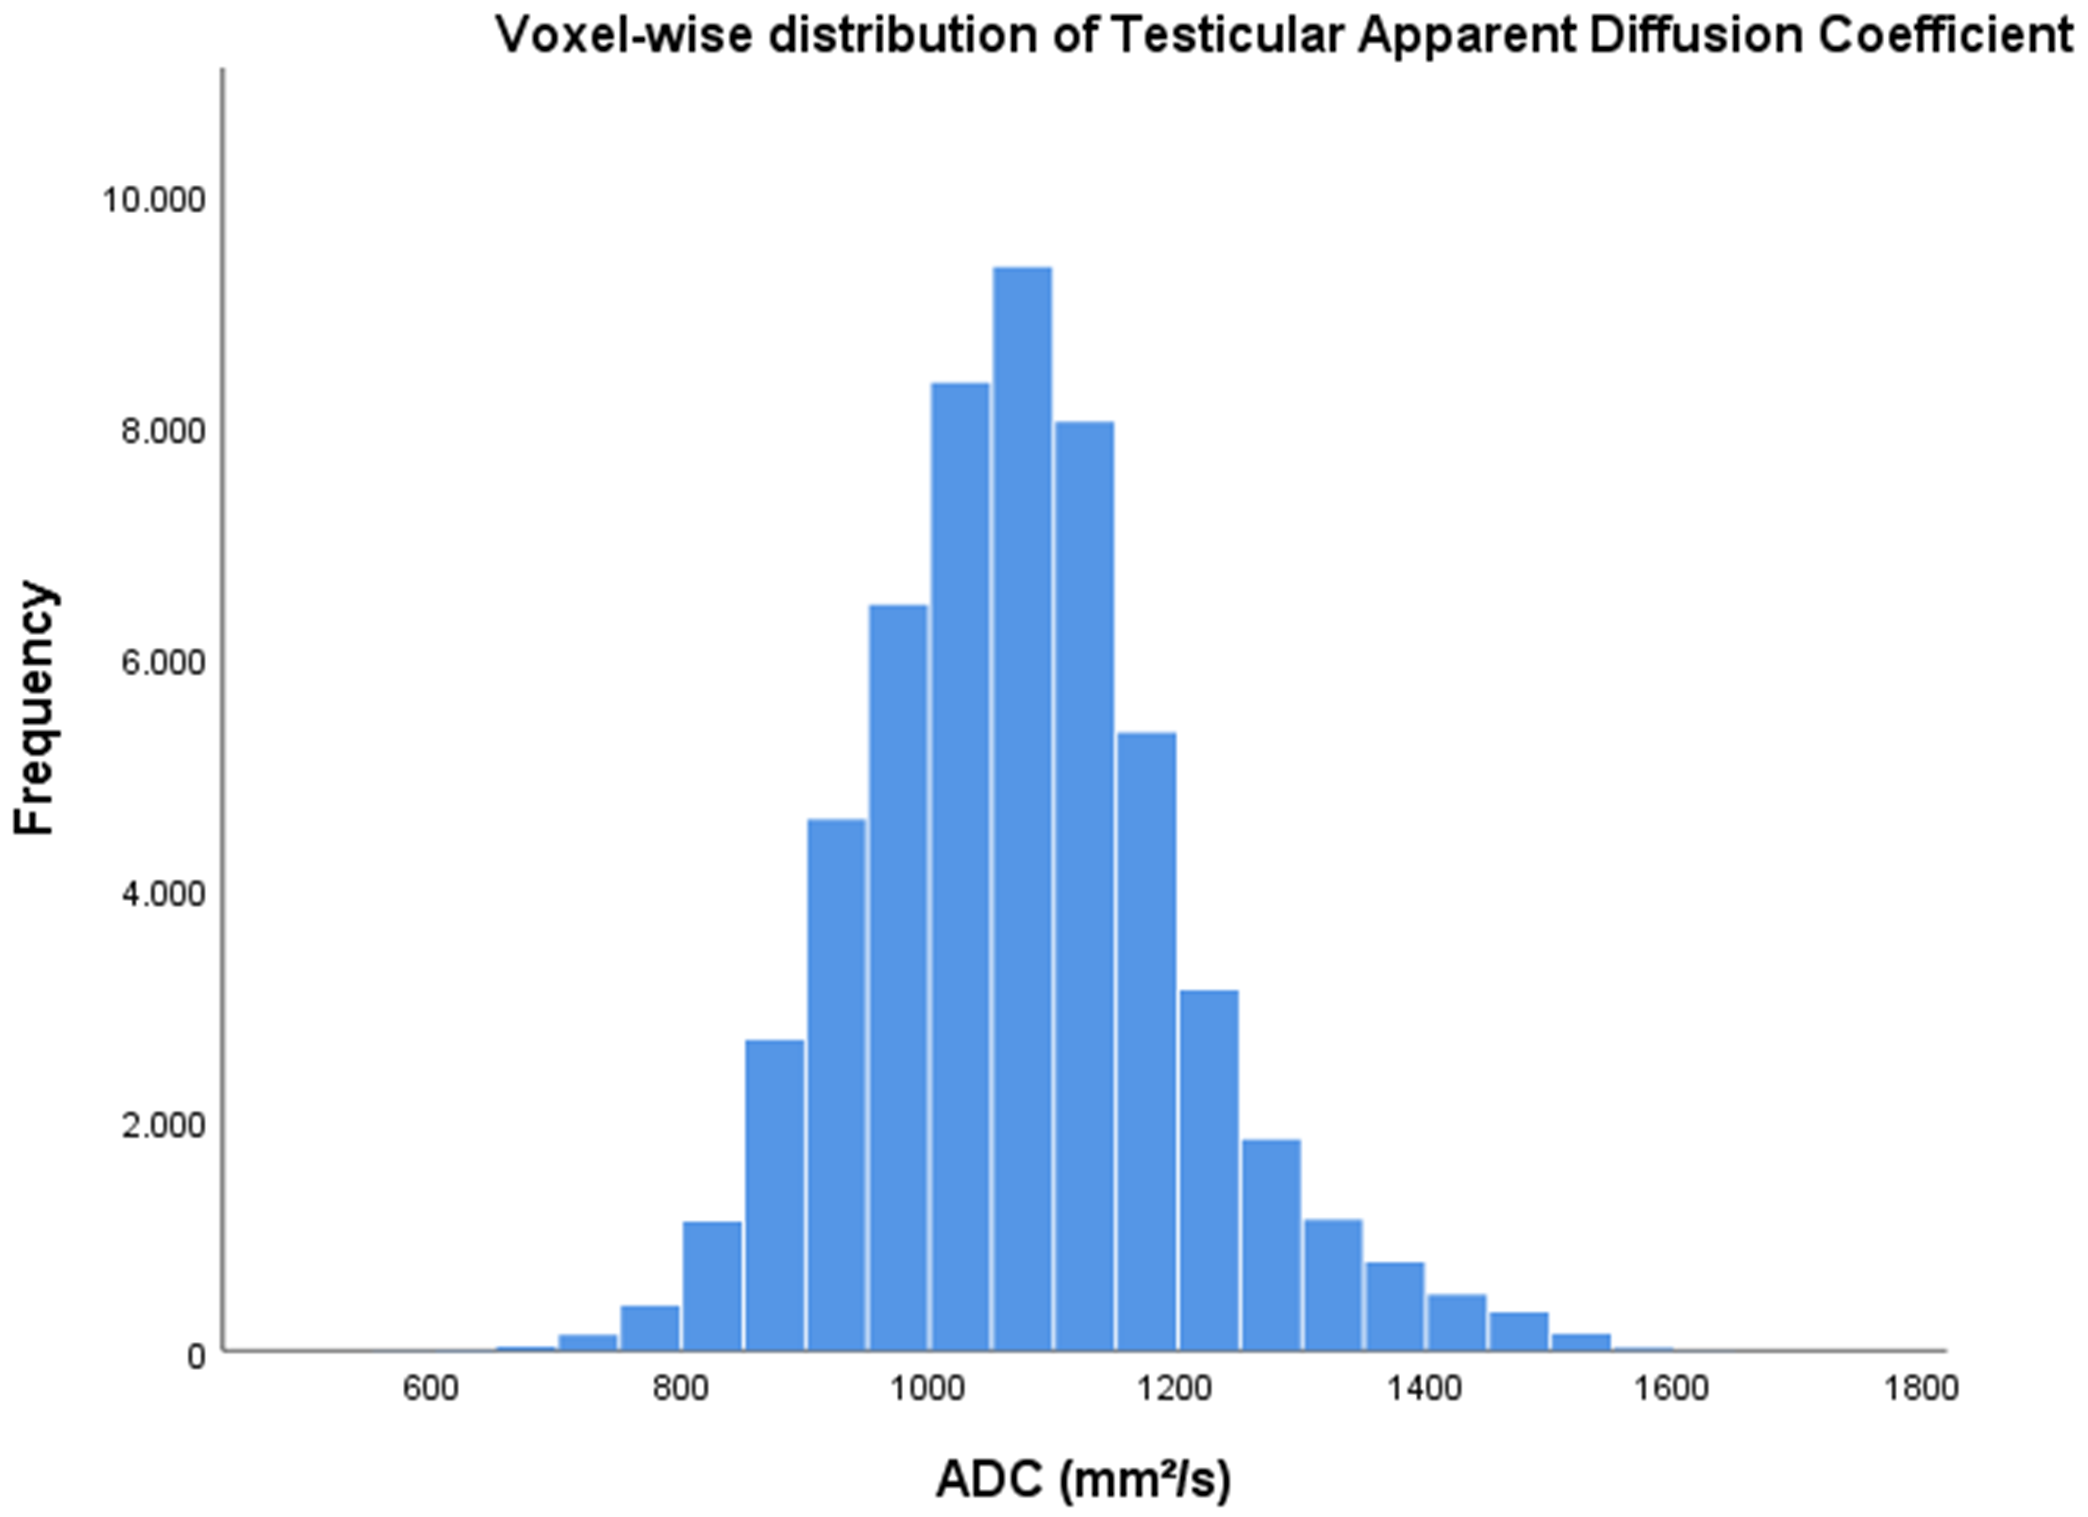
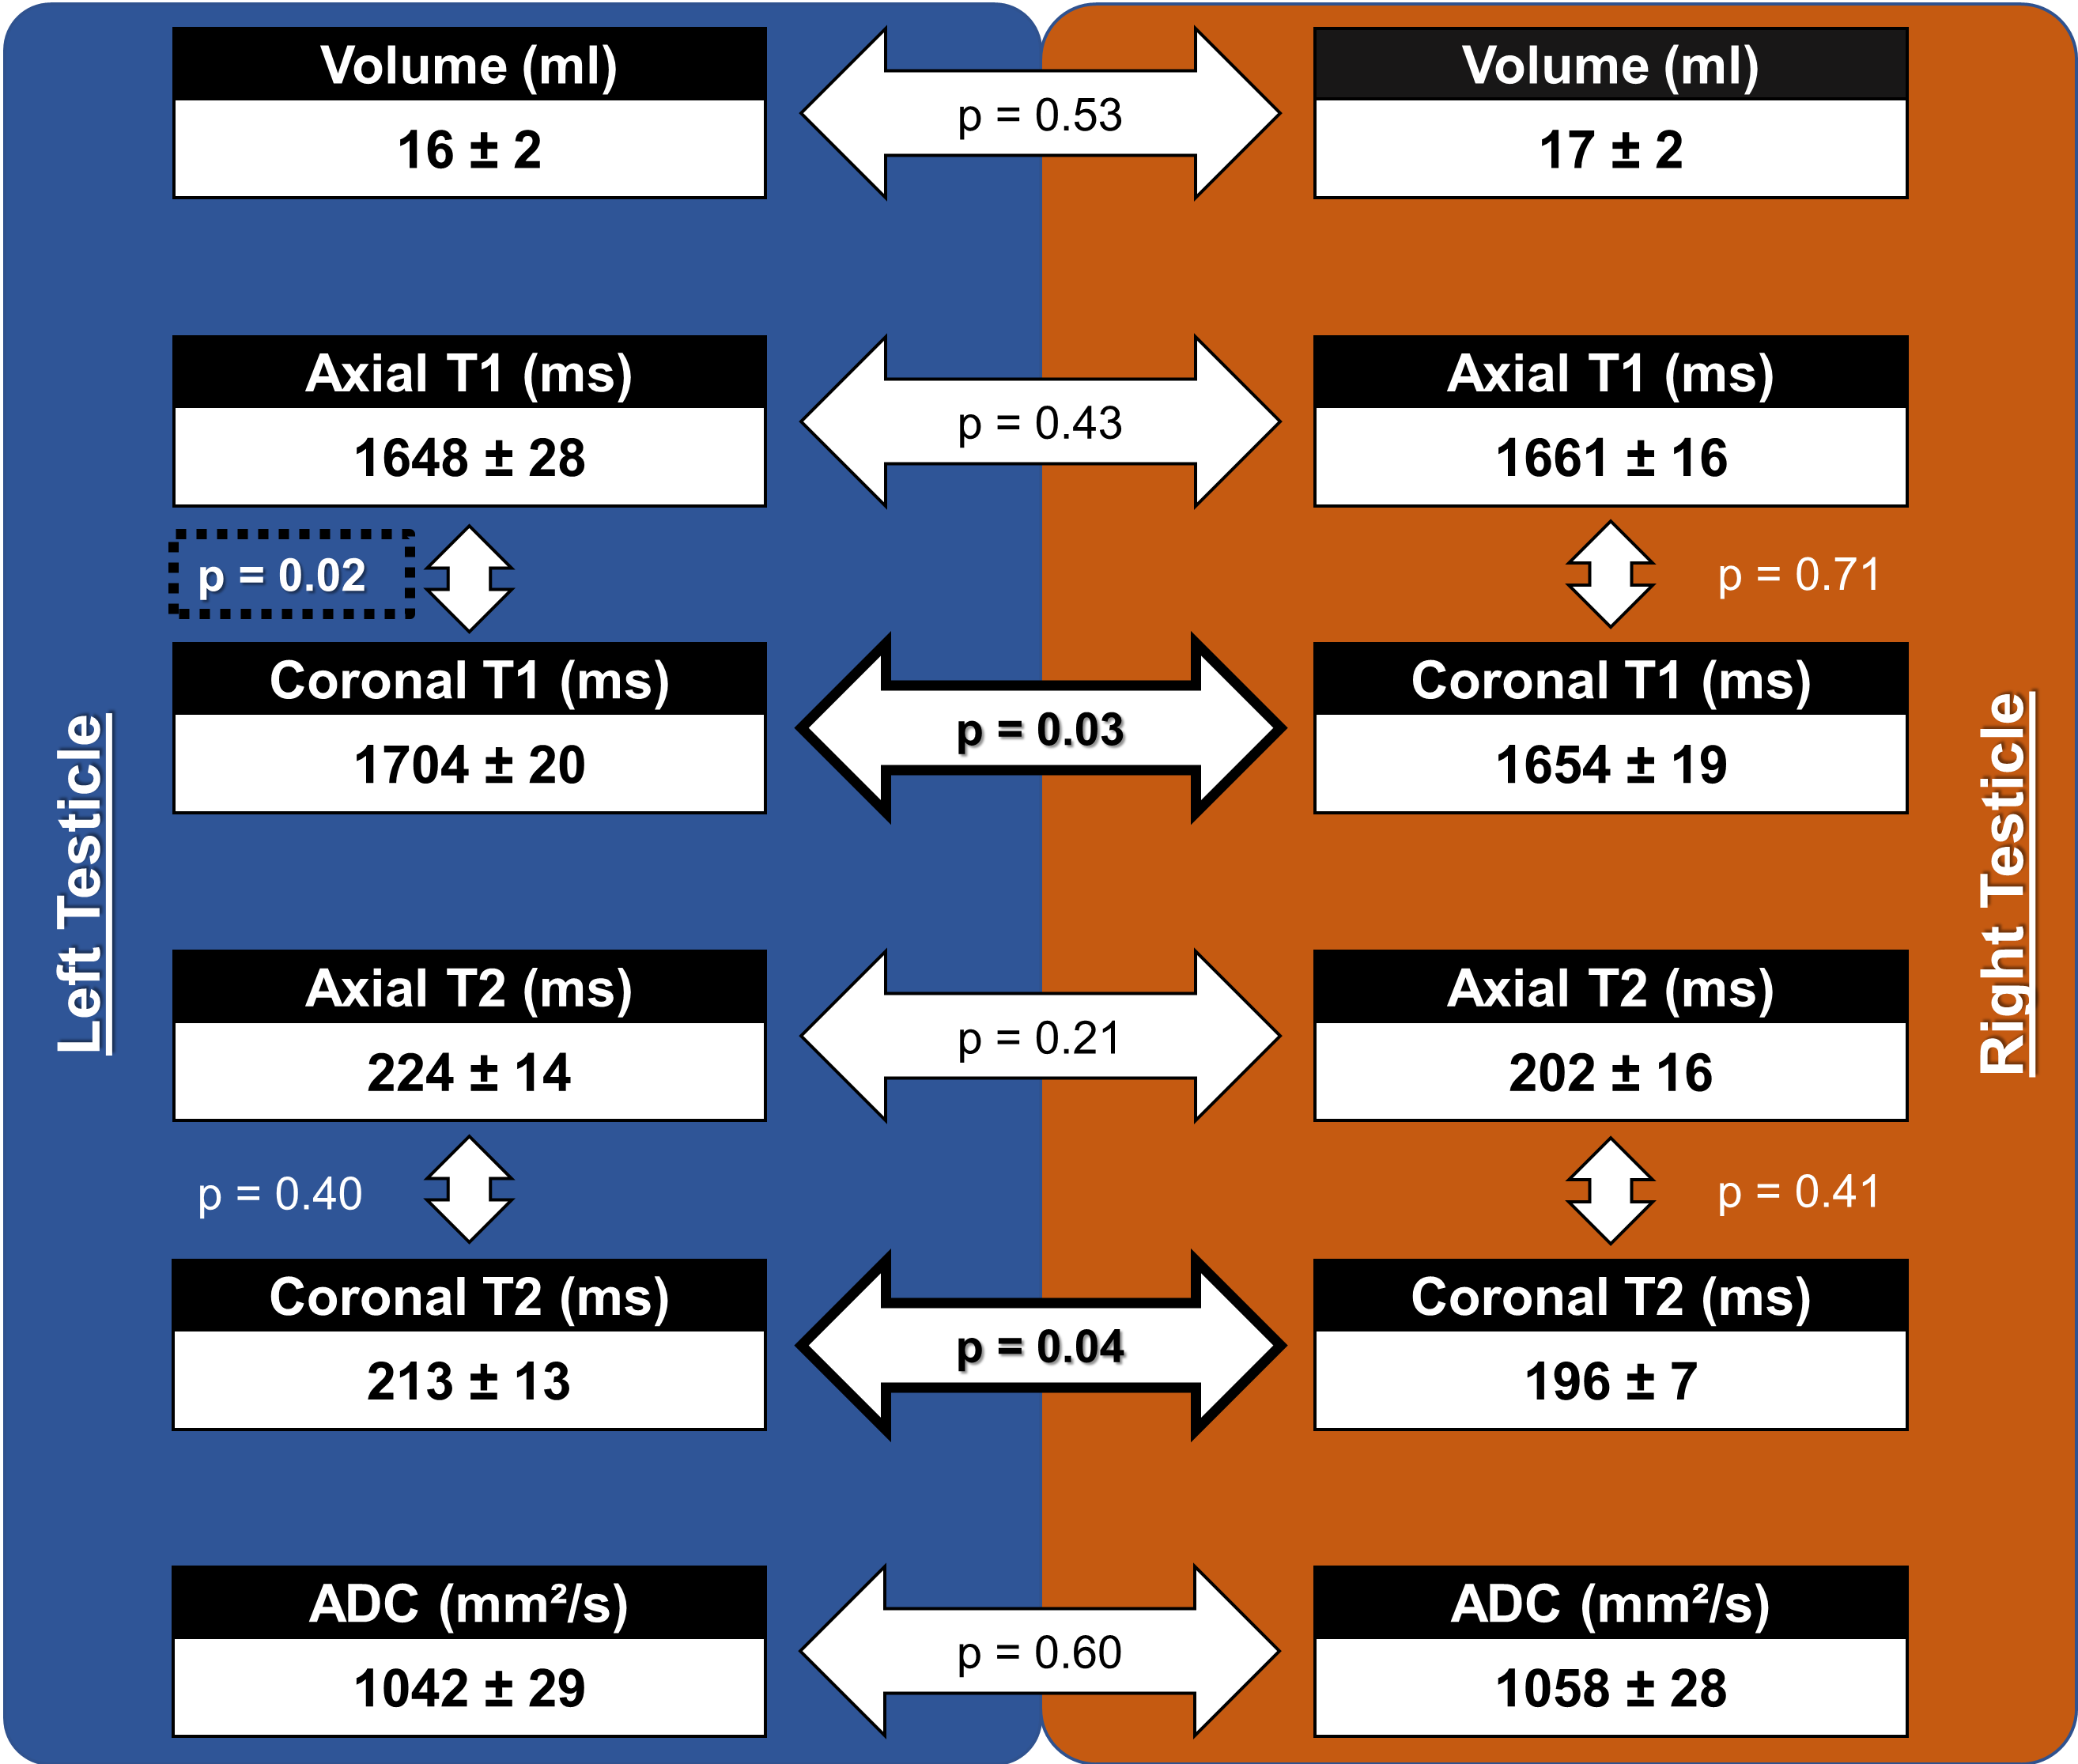
Nine healthy volunteers were included, with a mean age of 32 ± 9 years and similar volumes of the LT and RT (LT: 16 ± 2 vs RT: 17 ± 2 ml, p = 0.53). The voxel-wise distributions of Axial T1 and T2, Coronal T1 and T2, and ADC values are illustrated in Figures 2 and 3. The mean axial T1 and T2 values were similar among the LT and RT. Both mean coronal T1 and T2 values were higher in the LT compared with the RT (Figure 4). The mean axial and coronal T1 values of the RT were similar. Nonetheless, mean coronal T1 values were significantly higher than mean axial T1 values in the LT. For T2 values, mean axial and coronal T2 values were similar in both LT and RT. Finally, the mean ADC values of the LT and RT were similar.DISCUSSION
This is the first study to develop a dedicated protocol for combined quantitative MRF and diffusion mapping of the testicles. Mean ADC, axial T1 and T2 values were similar between the LT and RT. However, we observed a significant difference in mean coronal T1 and T2 values between the LT and RT. This could be explained either by inherent differences among tissue properties in the LT and RT or differences due to manual ROI drawing, which requires further investigation. Additionally, we showed that mean coronal T1 values of the LT were significantly higher than mean axial T1 values of the LT. These results further interests in conducting studies on fractional anisotropy and the influence of seminiferous ductal anatomy in ADC, T1, and T2 values.CONCLUSION
In this work we have shown that the acquisition of a dedicated protocol for combined MRF and diffusion mapping of the testicles is feasible. This paves the way for further prospective studies investigating the non-invasive characterization of the testicles in patients with obstructive and non-obstructive azoospermia using a combined MRF and conventional diffusion mapping protocol.Acknowledgements
We would like to gratefully thank Jessie Sun, PhD, for the critical revision of the abstract that significantly improved its overall quality and readability.References
1. Wosnitzer M, Goldstein M, Hardy MP. Review of Azoospermia. Spermatogenesis. 2014;4:e28218.
2. Buchanan CE, Mahmoud H, Cox EF, McCulloch T, Prestwich BL, Taal MW, et al. Quantitative assessment of renal structural and functional changes in chronic kidney disease using multi-parametric magnetic resonance imaging. Nephrol Dial Transplant. 2020 Jun 1;35(6):955–64.
3. Cannella R, Sartoris R, Grégory J, Garzelli L, Vilgrain V, Ronot M, et al. Quantitative magnetic resonance imaging for focal liver lesions: bridging the gap between research and clinical practice. Br J Radiol. 2021 Jun 1;94(1122):20210220.
4. Furman-Haran E, Nissan N, Ricart-Selma V, Martinez-Rubio C, Degani H, Camps-Herrero J. Quantitative evaluation of breast cancer response to neoadjuvant chemotherapy by diffusion tensor imaging: Initial results. J Magn Reson Imaging. 2018 Apr;47(4):1080–90.
5. Segment statistics — 3D Slicer documentation [Internet]. [cited 2023 Nov 1]. Available from: https://slicer.readthedocs.io/en/latest/user_guide/modules/segmentstatistics.html
6. Research Imaging Institute — Mango [Internet]. [cited 2023 Nov 6]. Available from: https://mangoviewer.com/
Figures