2902
Bladder Biomechanics and Shape Characterization: Comparison Study of Healthy vs BPH using Uro-Dynamic MRI1Mechanical Engineering, University of Wisconsin-Madison, Madison, WI, United States, 2Radiology, University of Wisconsin-Madison, Madison, WI, United States, 3Urology, University of Wisconsin-Madison, Madison, WI, United States, 4Biomedical Engineering, University of Wisconsin-Madison, Madison, WI, United States
Synopsis
Keywords: Urogenital, Bladder, Uro-Dynamic MRI
Motivation: Current standards for assessing the lower urinary tract (LUT) provide limited anatomical information. Uro-Dynamic MRI proves to be a valuable non-invasive tool for LUT biomechanics analysis. Bladder shape has been studied in static imaging but not in dynamic imaging.
Goal(s): Build a comprehensive, non-invasive framework to study bladder biomechanics in healthy and diseased subjects.
Approach: Uro-Dynamic MRI was implemented and used in five healthy and five BPH subjects. Novel MRI-derived bladder shape metrics were developed and quantified in all subjects.
Results: We observe quantifiable differences on correlation coefficients of flowrates and calculated bladder shape metrics between healthy and patients with benign prostatic hyperplasia.
Impact: Uro-Dynamic MRI allows biomechanical and shape analysis of the lower urinary tract(LUT), allowing comparisons between healthy and diseased subjects. Higher correlation values with flowrates observed on healthy subjects. Coupled Bladder biomechanical and shape analysis allows potential characterization of LUT disease.
Introduction
Multichannel uro-dynamic studies (UDS) with or without fluoroscopic imaging and/or urethral pressure profilometry have been the gold standard for assessment of the lower urinary tract (LUT) by taking measurements of voiding pressures and flow but provide limited assessment of lower urinary tract anatomy1. Assessment of bladder biomechanics using magnetic resonance imaging has been reported in the past1–3 but lacks detailed analysis of bladder shape as it has only been analyzed volumetrically. Bladder shape analysis has been analyzed using ultrasound during filling4 and MRI statically5. Benign prostatic hyperplasia (BPH)6 has been studied non-invasively using ultrasound7 and non-invasively using MRI by looking at the prostate8. Links have been determined between static urinary metrics and BPH9–11. The purpose of this study was to comprehensively and non-invasively characterize bladder biomechanics in patients with BPH/LUTS and healthy subjects by using a recently developed Uro-Dynamic MRI1 method.Methods
Image AcquisitionIn this an IRB-approved, HIPAA compliant study. 5 healthy volunteers (37±9 years of age) and 5 subjects diagnosed with BPH (65±6 years of age) were recruited. A single weight-based dose (0.1 mmol/kg) of gadolinium-based contrast was prepared and 1/3 of the dose was hand injected 15 minutes prior to MRI. Subjects were later equipped with a condom catheter and instructed to void in the MRI scanner in a supine position where urine was collected in a 1L bag attached to the subject’s leg. Acquired images were collected in a 3T MRI scanner (Premier, GE Healthcare, Waukesha, WI) using a high-density flexible array coil (AIR Coil, GE Healthcare) protocol developed in the past1 for most of the subjects. Healthy 5 was imaged using a new, contrast-less acquisition sequence that was developed based on a balance steady state free precession (bSSFP) sequence. This allows us to keep the same spatial resolution in the sagittal direction (1mmx1mmx2mm) while increasing our temporal resolution to obtain one complete bladder volume from an average of 4.3s to 1.65 seconds (TR=2.552, TE=0.944, Flip Angle=20°).
Bladder Segmentation
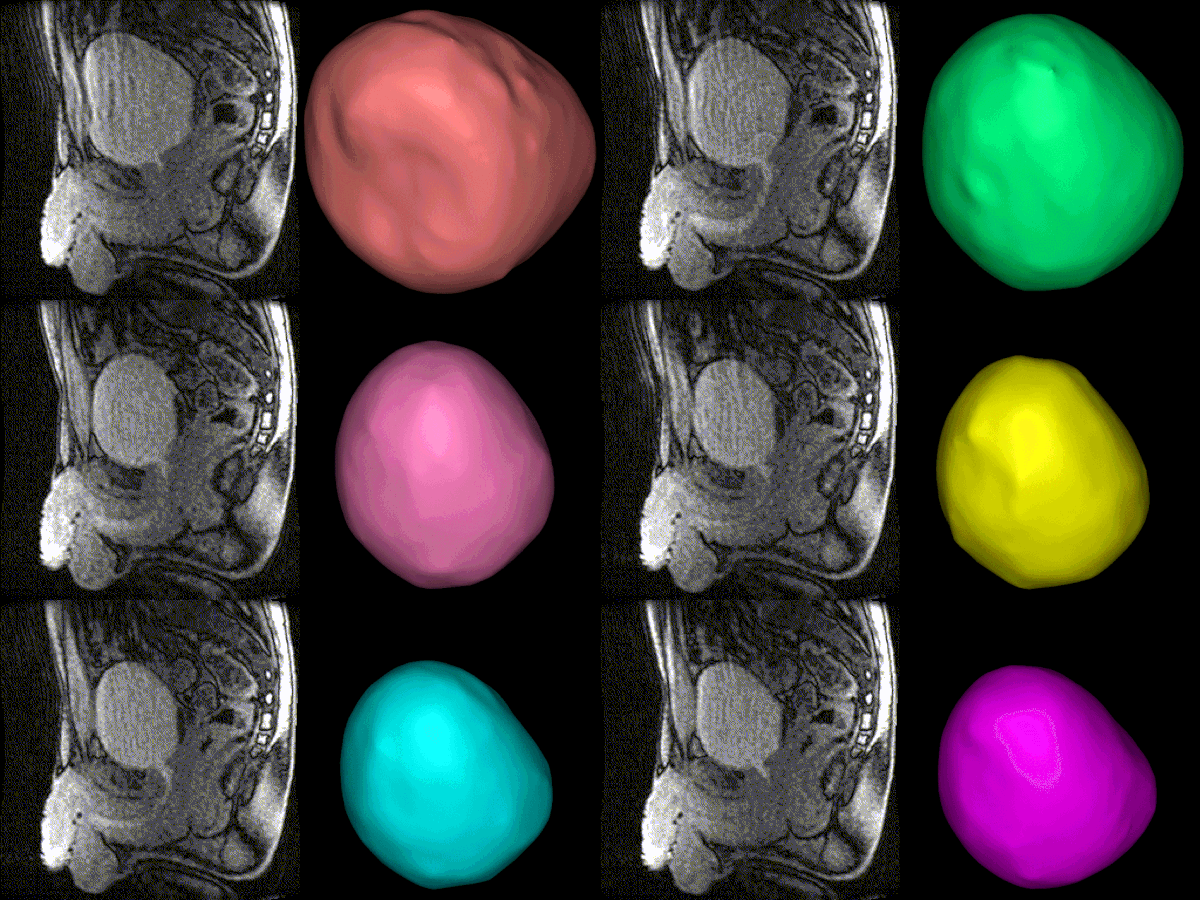
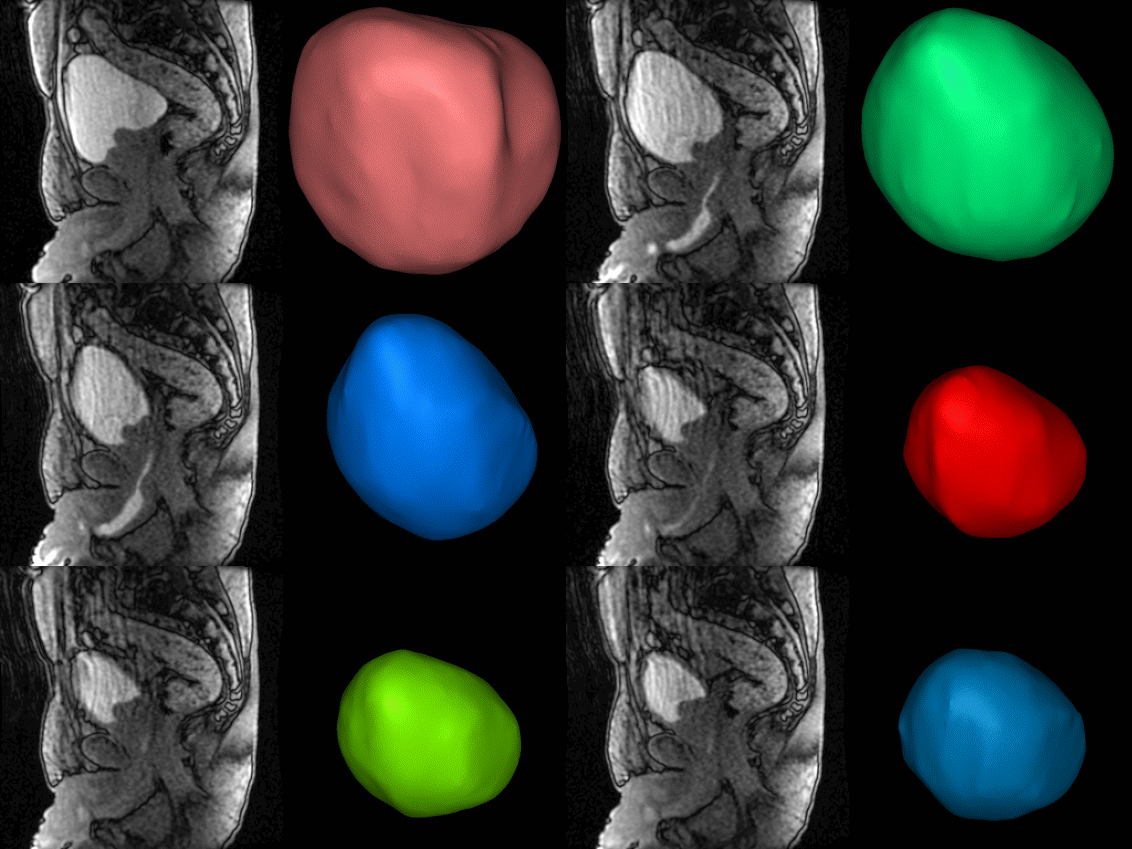
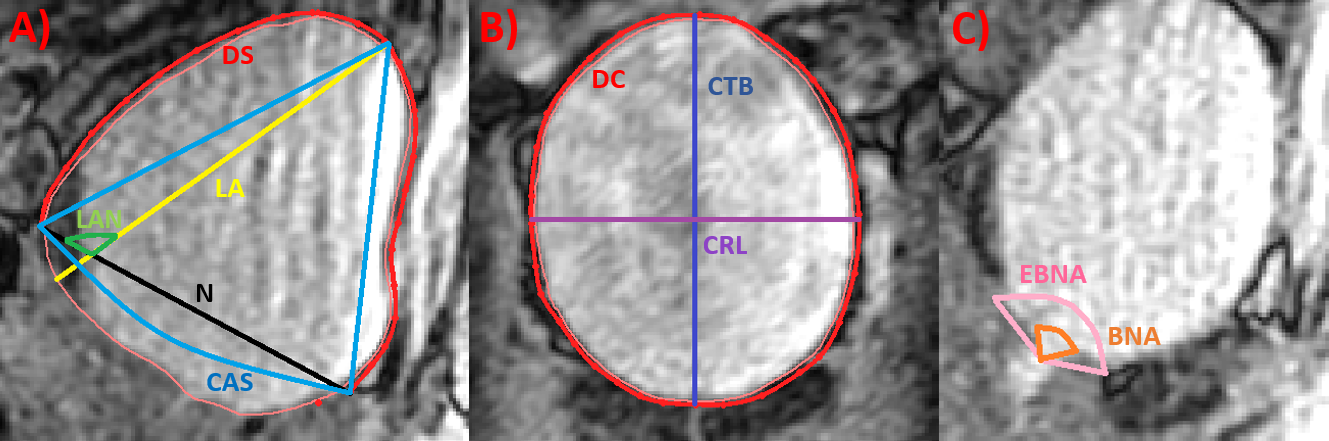
Images are imported into MIMICS (Materialise, Belgium) where we reconstruct one 3D rendering per time point within each void (17±4 time steps per subject) shown in Fig.1 and 2. Volumetric metrics like sphericity index, bladder neck angle (BNA) and external BNA (EBNA) were measured for all subjects throughout the void (Fig3)1.
Bladder Shape Analysis
From the acquired images we determined metrics that could aid in the characterization of the bladder shape throughout the void shown in Fig3. These metrics are based on anatomical references like the pubic symphysis (PS) and the trigone.
Results
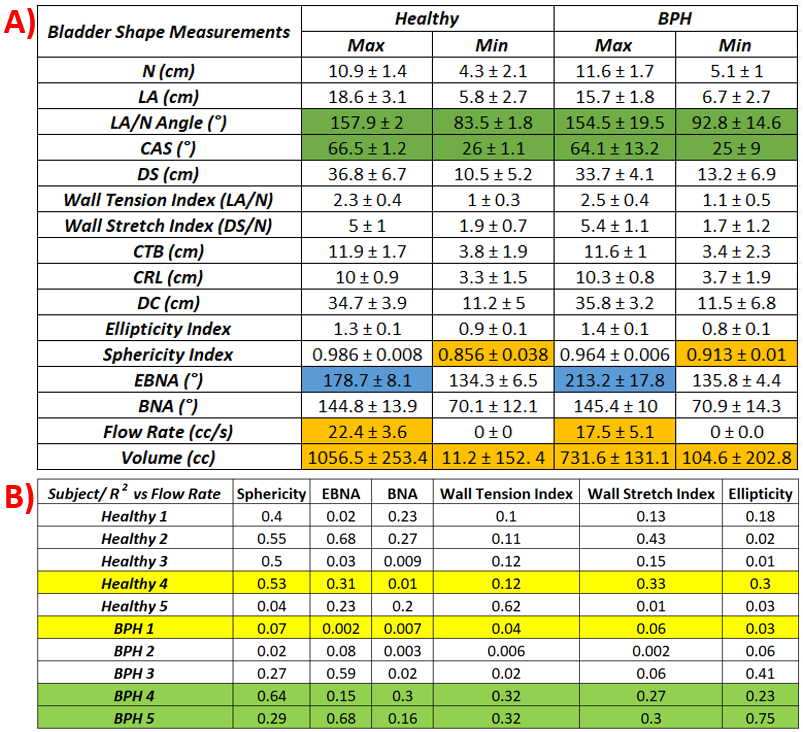
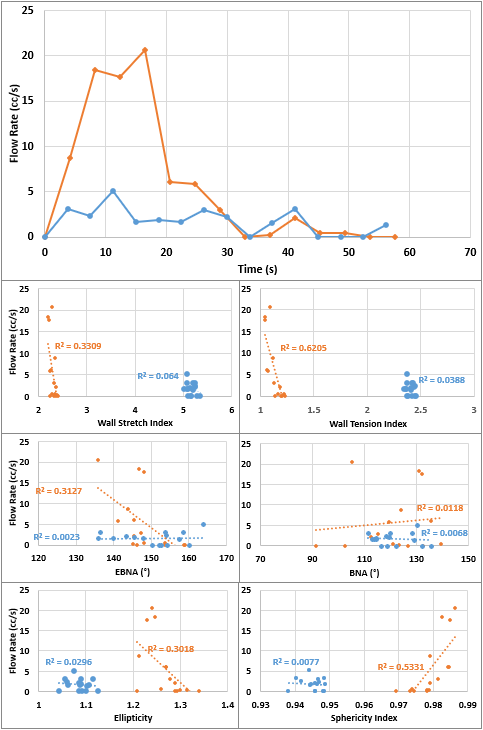
The results are summarized on Fig.4. Fig.5 contains one characteristic subject of each group (highlighted in yellow in of Fig.4B) was selected to display a complete analysis of the correlations between urine flow rate and the calculated metrics.Discussion
Healthy volunteers exhibited a larger range of motion across all metrics, lower wall tension and stretch indices. Linear correlation coefficients (R2) between these metrics and urinary flow rate were found to be higher in the healthy volunteers in most of the cases. In Fig.4, highlighted in green, shows two BPH subjects without lower urinary tract symptoms (LUTS) that have high correlation values with flow, corresponding the behavior of healthy subjects. Because of this most of the maximum and minimum metrics are similar but in the case of LAN and CAS, SD values show large disparity in the metrics. Therefore, the table with the correlation coefficients was included to show information that might be hidden due to patient-to-patient variability in the Min/Max table. In Fig.4 the largest differences are highlighted in orange. In addition, measurements taken in the sagittal plane and its derivatives show higher correlation coefficients than metrics taken in the coronal planeConclusions
Uro-Dynamic MRI has proven to be able to capture bladder biomechanics non-invasively both in healthy controls and patients with BPH/LUTS. By adding bladder shape analysis, we have created a robust framework that could characterize bladder biomechanics and shape and quantify differences between healthy subjects and subjects with LUTS in a more comprehensive way. We are aware this framework is still contingent to limitations like the orientation of the subject during the study and the inability to take more than one void per scanning session. In addition, to increase the scope of this framework we are currently adding more subjects to both cohorts, performing a comparison between sequences, adding studies in women and adding different cohorts including overactive bladder (OAB) and neurogenic bladder.Acknowledgements
We would like to acknowledge support from NIIDK (R01 DK126850-01A1), the Wisconsin Partnership Program (WPP; AAM3497) and GE Healthcare which provides research support to University of Wisconsin-Madison.References
1. Gonzalez-Pereira JP, Johnson CJ, Wells S, Bushman W, Roldan-Alzate A. Technical feasibility of uro-dynamic MRI study of voiding biomechanics: a pilot study. Int Urol Nephrol. Published online 2023. doi:10.1007/s11255-023-03823-7
2. Anzia LE, Johnson CJ, Mao L, et al. Comprehensive non-invasive analysis of lower urinary tract anatomy using MRI. Abdominal Radiology. 2021;46(4). doi:10.1007/s00261-020-02808-9
3. Pewowaruk R, Rutkowski D, Hernando D, Kumapayi BB, Bushman W, Roldán-Alzate A. A pilot study of bladder voiding with real-time MRI and computational fluid dynamics. PLoS One. 2020;15(11 November). doi:10.1371/journal.pone.0238404
4. Gray T, Phillips L, Li W, et al. Evaluation of bladder shape using transabdominal ultrasound: Feasibility of a novel approach for the detection of involuntary detrusor contractions. Ultrasound. 2019;27(3):167-175. doi:10.1177/1742271X19834062
5. Ateşçi YZ, Aydoǧdu Ö, Karaköse A, Pekedis M, Karal Ö, Şentürk U. Does urinary bladder shape affect urinary flow rate in men with lower urinary tract symptoms? The Scientific World Journal. 2014;2014. doi:10.1155/2014/846856
6. Bushman W. Etiology, epidemiology, and natural history of benign prostatic hyperplasia. Urol Clin North Am. 2009;36(4).
7. Ku JH, Ko DW, Cho JY, Oh SJ. Correlation Between Prostatic Urethral Angle and Bladder Outlet Obstruction Index in Patients With Lower Urinary Tract Symptoms. Urology. 2010;75(6):1467-1471. doi:10.1016/j.urology.2009.08.049
8. Guneyli S, Ward E, Peng Y, et al. MRI evaluation of benign prostatic hyperplasia: Correlation with international prostate symptom score. Journal of Magnetic Resonance Imaging. 2017;45(3). doi:10.1002/jmri.25418
9. Cho KS, Kim JH, Kim DJ, Choi YD, Kim JH, Hong SJ. Relationship Between Prostatic Urethral Angle and Urinary Flow Rate: Its Implication in Benign Prostatic Hyperplasia Pathogenesis. Urology. 2008;71(5):858-862. doi:10.1016/j.urology.2008.01.019
10. Li Y, Chen Z, Zeng R, Huang J, Zhuo Y, Wang Y. Bladder Neck Angle Associated with Lower Urinary Tract Symptoms and Urinary Flow Rate in Patients with Benign Prostatic Hyperplasia. Urology. Published online 2021. doi:10.1016/j.urology.2021.09.005
11. Kang M, Kim M, Choo MS, et al. Association of high bladder neck elevation with urodynamic bladder outlet obstruction in patients with lower urinary tract symptoms and benign prostatic hyperplasia. Urology. 2014;84(6):1461-1466. doi:10.1016/j.urology.2014.08.037
Figures