2897
Feasibility of quantitative water T2 mapping for detection of renal tubulointerstitial changes in radiation nephropathy1F.M. Kirby Research Center for Functional Brain Imaging, Kennedy Krieger Institute, Baltimore, MD, United States, 2The Russell H. Morgan Department of Radiology and Radiological Science, The Johns Hopkins University School of Medicine, Baltimore, MD, United States, 3Department of Molecular and Comparative Pathobiology, The Johns Hopkins University School of Medicine, Baltimore, MD, United States
Synopsis
Keywords: Kidney, Kidney
Motivation: As the current diagnostic tools are insensitive to early kidney damage in radiation nephropathy, there is a clinical need for improved biomarkers that can be used to noninvasively assess tubulointerstitial changes in RN.
Goal(s): To verify whether MRI-based T2 mapping can detect microstructural changes in renal parenchyma resulting from radiation-induced kidney damage.
Approach: We performed T2 mapping in two mouse models of radiation nephropathy, one involving external beam irradiation and the other utilizing internal irradiation with α-particle-emitting actinium (225Ac) radiolabeled antibody.
Results: Increased T2 values were found in the cortex and outer medulla of the treated mice compared to the healthy controls.
Impact: MRI-based T2 values could serve as a quantitative biomarker for detecting microstructural changes specific to EBRT and αRPT.
Introduction
Radiation nephropathy (RN) is a kidney injury induced by application of ionizing radiation, which can be delivered to the body using an external source (external beam radiotherapy, EBRT), internal source or by intravenous administration of therapeutic radioisotopes. RN has been reported in patients who have undergone radiation therapy for renal and abdominal cancers1. Chronic RN is clinically indistinguishable from chronic kidney disease, and can progress to end-stage-renal disease requiring renal replacement therapy.To our knowledge, there is limited data evaluating whether MRI can detect radiotherapy-specific microstructural changes in renal parenchyma, and provide potentially useful information for RN treatment planning and management. Here, we performed T2 measurements in two different mouse models, one involving external beam irradiation and the other utilizing internal irradiation with α-particle-emitting actinium (225Ac) radiolabeled antibody2. We hypothesized that renal T2 relaxation properties are sensitive to structural changes and water content alterations resulting from radiation-induced renal damage.
Methods
Female CD-1 mice were treated by EBRT or an alpha-emitting radiopharmaceutical therapy (αRPT). The EBRT-treated mice received a bilateral kidney dose of 5 Gy/day for 5 days, while the αRPT-treated mice received 460 nCi of 7.16.4 antibody conjugated Ac-225. MRI scans were performed at 15 and 27 weeks post-EBRT (5 mice per group) and 4, 8 and 15 weeks post-αRPT (3 mice per group). Three age-matched healthy mice were used as controls.In vivo MRI experiments were conducted on an 11.7 T Bruker animal scanner. Anatomical T2w images in a coronal and axial plane were acquired using a RARE sequence (TEeff/TR(ms)=22/900), matrix size=256x256). Coronal T2 mapping was performed using a fat-suppressed MSME sequence with TR=1418 ms and 12 different effective TEs between 10 and 120 ms.
Data analysis was performed in Matlab as described previously3. Briefly, we first corrected the Rician noise bias in the collected MR magnitude images and then iteratively fit the model of the T2 decay to the MR signal intensity data of each pixel. Quantitative T2 values were obtained from the resulting T2 maps using manually drawn ROIs for the different morphological regions of a mouse kidney.
Animals that were examined at 15 and 27 weeks post-treatment were sacrificed within 48 hours of the MRI scans and their kidneys were histologically evaluated.
Results
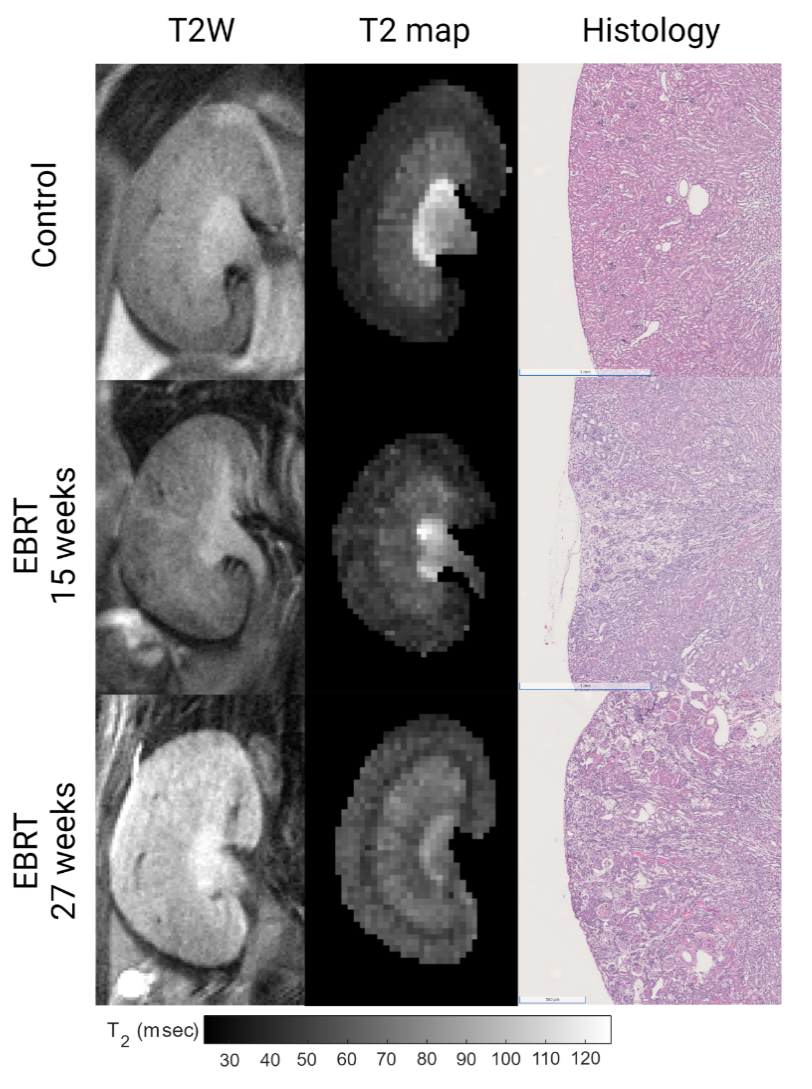
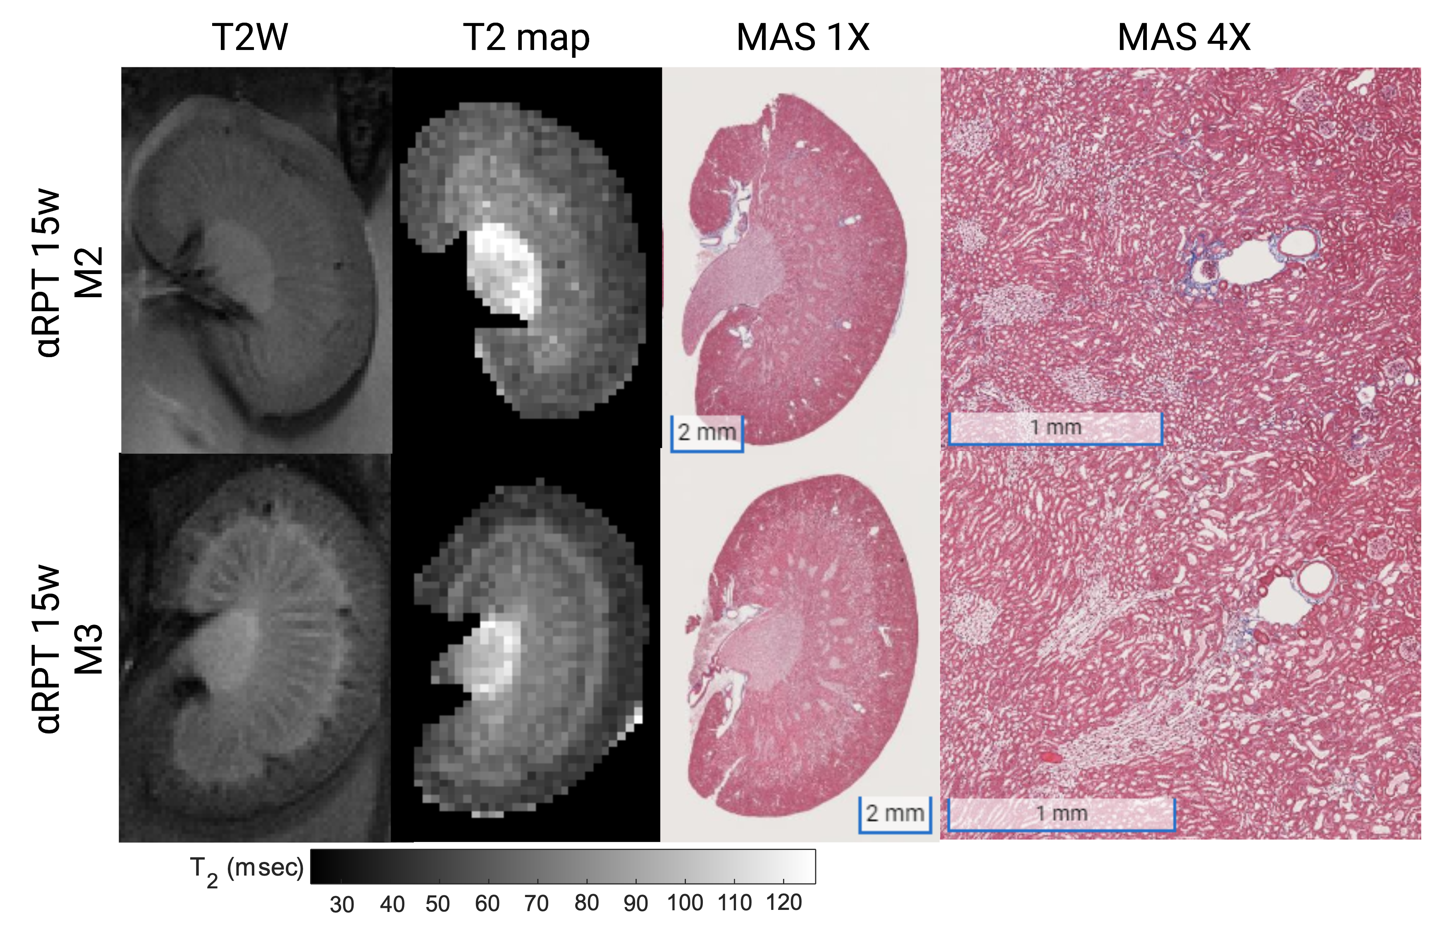
Figure 1 shows the T2-weighted images, T2 maps and corresponding histological findings obtained in a control mouse and two EBRT-treated mice at 15 and 27 weeks post-radiation. Histological evaluation in these mice revealed localized tubular damage and interstitial fibrosis at both time points post-treatment, with additional non-localized cortical tubular atrophy at 27 weeks. While the general parenchymal architecture was preserved, a few hypointense regions in the cortex and outer medulla can be seen in the T2 map. As renal damage progressed, an increase in cortical T2 can be observed.In Figure 2, the results for two αRPT-treated mice manifesting different levels of parenchymal damage are presented. Note that longer OSOM T2 values (bottom row, second column) correspond to a higher degree of tubular damage (tubular dilation, tubular atrophy) in this region.
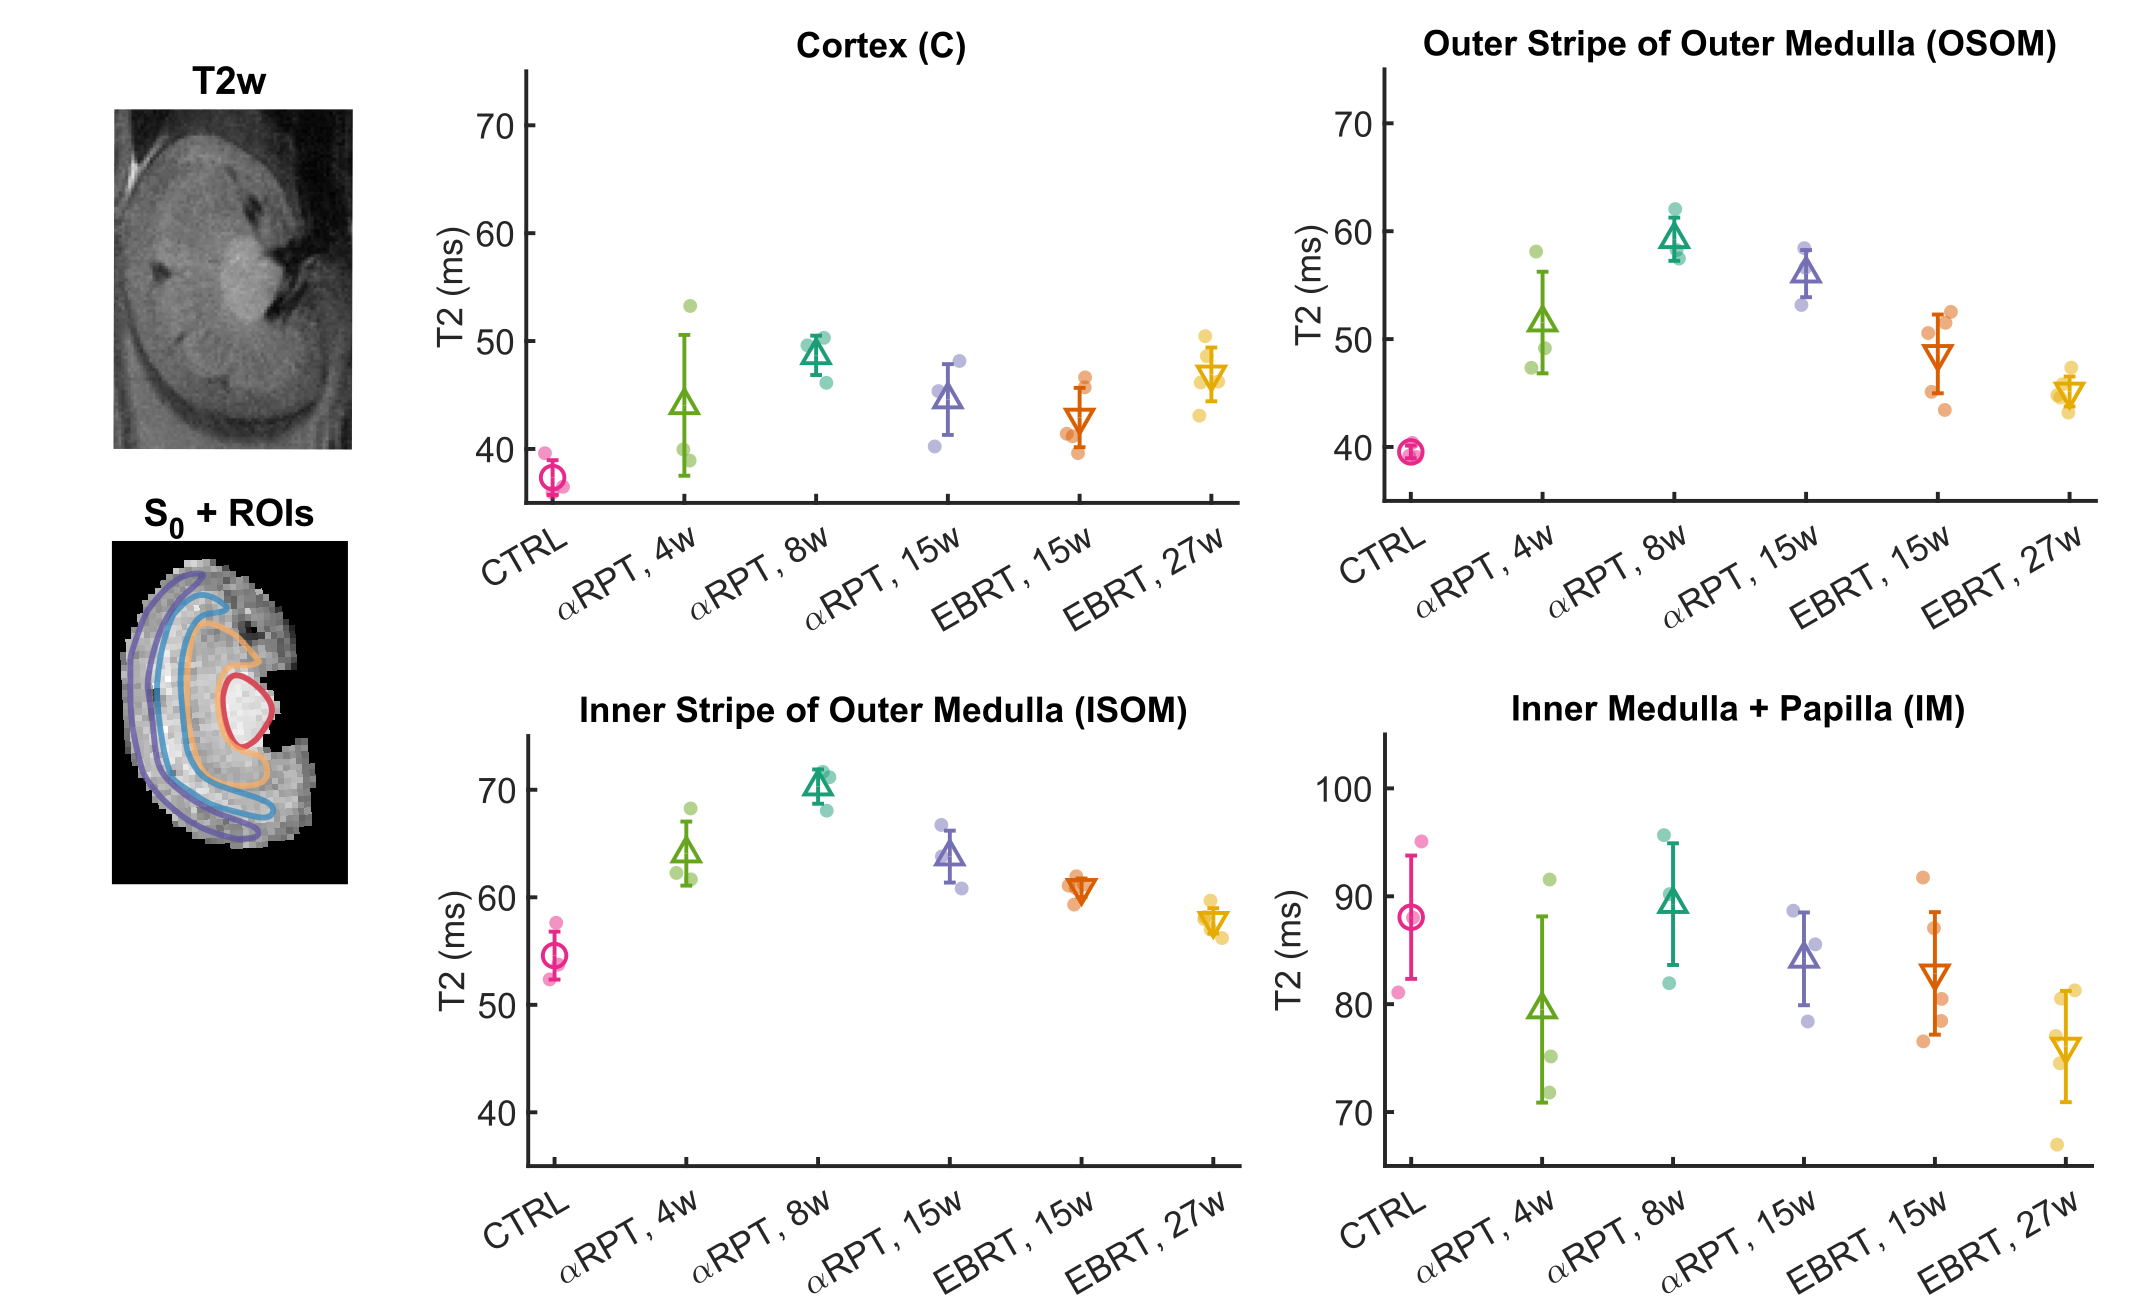
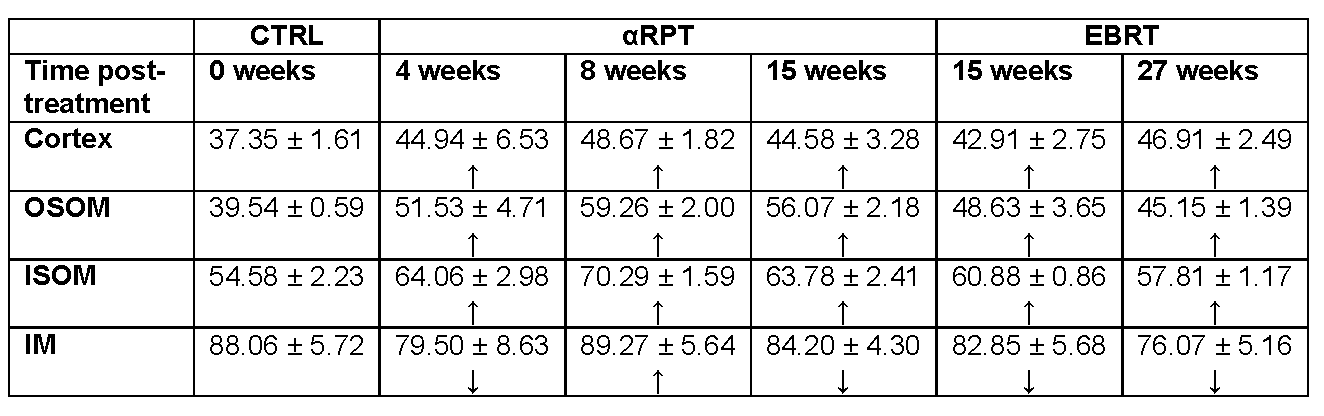
The results of an ROI-based analysis for all animals are displayed in Figure 3 and Table 1. A clear trend toward higher T2 values was observed in the outer medulla in all treated mice compared to the healthy ones. In particular, the highest cortex and outer medullary T2 changes were measured in the αRPT-treated mice at 8 weeks post-treatment. In the EBRT group, T2 values in the ISOM and OSOM decreased slightly with time post-radiation, while the opposite trend was found in the cortex.
Discussion
The results of our study suggest that quantitative T2 imaging can detect pathological changes in the kidney specific to EBRT and αRPT.The EBRT induced infarct-like ischemic lesions at 15 weeks that co-presented with delocalized cortical atrophy at 27 weeks. Heterogeneities in cortical T2 values at 15 weeks may reflect these lesions while higher homogenous cortical T2 values at 27 weeks are likely due to more widespread cortical changes in water content and distribution. In contrast, the proximal tubules uptake actinium’s radioactive daughters resulting in an absorbed dose concentrated in the cortex/OSOM2,4. For the αRPT-treated mice, we believe that histologically observable tubular simplification within the outer medulla are reflected in MRI by higher T2 values in matched areas.
While this preliminary data is promising, the potential utility of water T2 as a renal biomarker or radiation-induced renal damage needs to be validate in a larger study population and correlated with clinical parameters.
Conclusion
In our study, T2 showed promise as a quantitative biomarker for detecting radiotherapy-specific microstructural changes in the kidney.Acknowledgements
No acknowledgement found.References
1. Klaus R, Niyazi M, Lange-Sperandio B. Radiation-induced kidney toxicity: molecular and cellular pathogenesis. Radiat Oncol. 2021; 16, 43.
2. Jaggi JS, Seshan SV, McDevitt MR, LaPerle K, Sgouros G, Scheinberg DA. Renal Tubulointerstitial Changes after Internal Irradiation with α-Particle–Emitting Actinium Daughters. J Am Soc Nephrol. 2005; 16(9):2677-2689
3. Periquito JS, Starke L, Santos CM, et al. Analysis Protocols for MRI Mapping of the Blood Oxygenation–Sensitive Parameters T2* and T2 in the Kidney. 2021 Jan 22. In: Pohlmann A, Niendorf T, editors. Preclinical MRI of the Kidney: Methods and Protocols [Internet]. New York: Humana Press; 2021. Chapter 36. Available from: https://www.ncbi.nlm.nih.gov/books/NBK573741/
4. Stephens LC, Robbins ME, Johnston DA, Thames HD, Price RE, Peters LJ, Ang KK. Radiation nephropathy in the rhesus monkey: Morphometric analysis of glomerular and tubular alterations. Int J Radiat Oncol Biol Phys. 1995;31:865 –873.
Figures