2894
Noninvasive Evaluation of Renal Oxygenation by BOLD-MRI - Comparison between Patients with Primary Aldosteronism and Healthy Controls1West China Hospital of Sichuan University, Chengdu, China, 2Affiliated Hospital of North Sichuan Medical College, Nanchong, China, 3GE Healthcare, MR Research, Beijing, China
Synopsis
Keywords: Kidney, Kidney
Motivation: To observe the renal oxygenation in patients with primary aldosteronism (PA).
Goal(s): To explore the renal oxygenation in patients with PA by blood oxygenation level-dependent magnetic resonance imaging (BOLD-MRI) compared with healthy controls (HCs).
Approach: A total of 40 participants were included and underwent renal BOLD-MRI. The correlation between renal BOLD parameters and clinical indicators was analyzed by Pearson correlation analysis or Spearman correlation analysis. A ROC curve was used to distinguish the PA patients and HCs.
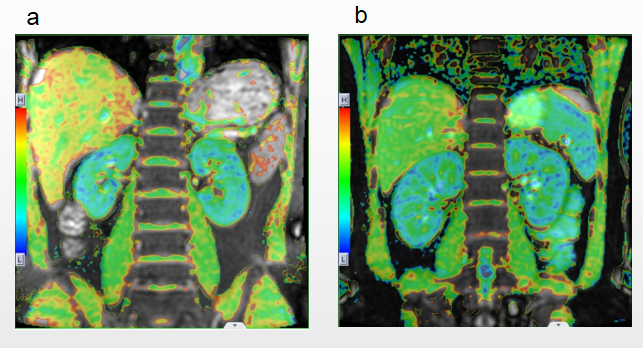
Results: The cortical R2* of the PA patients was higher than that of the HCs, suggesting that the cortices of PA patients were relative hypoxia.
Impact: Our results suggested that BOLD-MRI could detect the oxygenation level of the renal cortex and medulla of PA patients and may have the potential to noninvasively assess renal status.
Introduction
Patients with primary aldosteronism have abnormally high secretion of aldosterone, causing excessive sodium and water retention in the body and increased blood volume, thus resulting in hemodynamic changes, abnormal vasodilatation, renal vascular injury, microvascular system lesions, endothelial dysfunction and other pathophysiological reactions. These reactions lead to renal ischemia, which in turn leads to chronic hypoxia in the kidney, causing irreversible damage to the kidney and even progressing to chronic renal insufficiency [1-3]. Renal tissue hypoxia plays a crucial role in the development of kidney injury and chronic renal insufficiency. In clinical practice, the estimated glomerular filtration rate (eGFR) is often used as an evaluation index of renal function. However, for patients with PA, eGFR may not be a reliable surrogate of renal function due to PA-induced glomerular hyperfiltration [3]. BOLD-MRI uses deoxyhemoglobin, a paramagnetic molecule, as an endogenous marker and has been proven to be able to detect the oxygenation status of the kidney [4], including diabetic nephropathy [5,6], chronic kidney disease [7,8], kidney transplantation [9], and lupus nephritis [10]. However, no studies have been conducted to evaluate the renal oxygenation status of PA patients using BOLD-MRI. This study aimed to assess the application value of BOLD-MRI in the evaluation of renal oxygen levels in PA patients by analyzing the difference in R2* values of renal parenchyma between PA patients and healthy volunteers. Additionally, the study aimed to analyze the correlation between R2* values and clinical indicators in PA patients.Methods
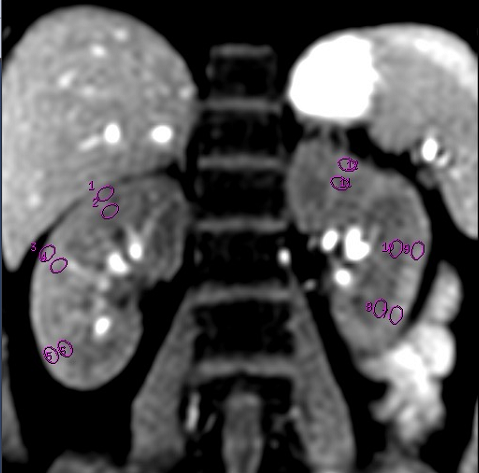
The prospective study was approved by the local biomedical ethics committee. All participants signed an informed consent form. A total of 20 (female:male, 14:6; age, 46±12 years) patients with a confirmed diagnosis of PA were included from June 2021 to December 2022. All patients and healthy controls (HCs) underwent renal BOLD-MRI at 3 T MRI scanner (SIGNA Architect, GE Healthcare, Milwaukee, USA). The region of interest (ROI) method was used to measure R2* values in the renal cortex and medulla separately. The independent-sample t test or the Mann‒Whitney U test was used. The correlation between renal BOLD parameters and clinical indicators was analyzed by Pearson correlation analysis or Spearman correlation analysis. A receiver operating characteristic (ROC) curve was used to distinguish the PA patients and healthy volunteers.Results
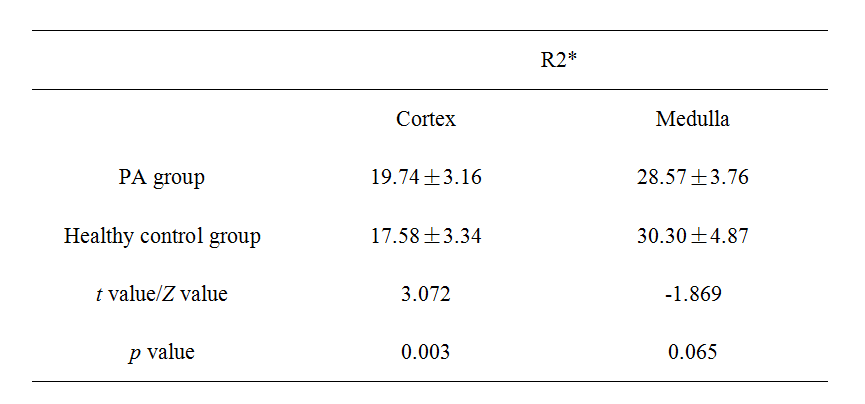
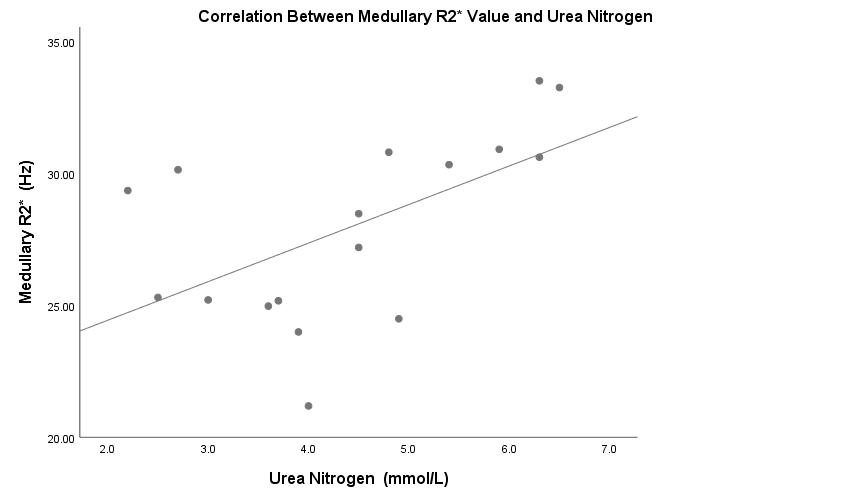
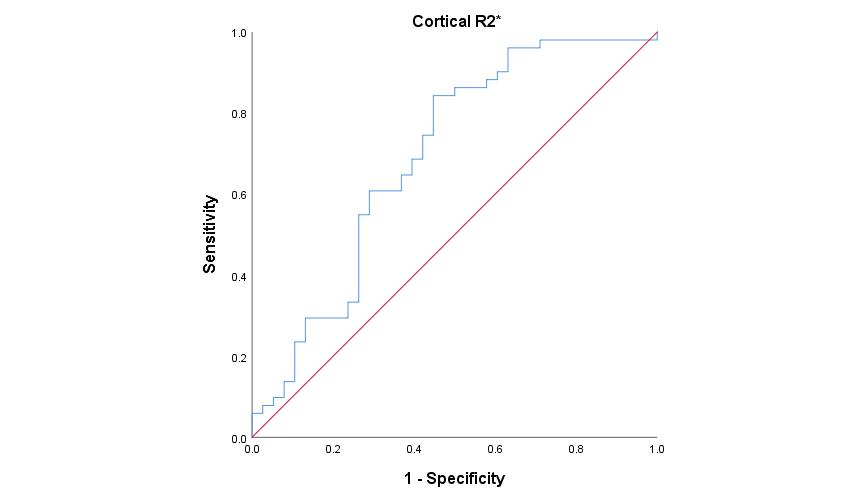
A total of 20 PA patients (female:male, 14:6; age, 46±12 years) and 20 HCs (female:male, 14:6; age, 47±10 years) were enrolled. The cortical R2* was significantly lower than the medullary R2* in the HCs and PA patients (p<0.001). The cortical R2* of the PA group was higher than that of the HCs (p=0.003) (Table 1). The correlation analysis showed that there was a statistically significant positive correlation between the medullary R2* value and urea nitrogen (r = 0.566, p =0.018) (Figure 1). The ROC curve showed that the optimal diagnostic threshold of cortical R2* was 17.13 Hz to distinguish PA patients and HCs, and the corresponding sensitivity and specificity were 84.30% and 55.30%, respectively. The area under the curve (AUC) was 0.692 (Figure 2).Discussion and Conclusion
In the present study, we performed BOLD-MRI scanning on 20 patients with PA and 20 healthy volunteers. We found that cortical R2* values were significantly higher in the PA patient group than in the healthy control group, suggesting that the cortices of PA patients were in a state of relative hypoxia. The direct toxic effects of excess aldosterone on the kidneys will result in a relative hypoxic state with reduced renal blood flow [11-13] and the glomerular hyperfiltration state in patients with PA also results in relative hypoxia due to increased renal oxygen consumption.Acknowledgements
No acknowledgement found.References
1. Hollenberg NK (2004) Aldosterone in the development and progression of renal injury. Kidney Int 66(1):1–9.
2. Monticone S, Sconfienza E, D'Ascenzo F, et al (2020) Renal damage in primary aldosteronism: a systematic review and meta-analysis. J Hypertens 38(1):3–12.
3. Nakamura Y, Kobayashi H, Tanaka S, Hatanaka Y, Fukuda N, Abe M (2021) Association between plasma aldosterone and markers of tubular and glomerular damage in primary aldosteronism. Clin Endocrinol (Oxf) 94(6):920-926.
4. Pedersen M, Dissing TH, Mørkenborg J, et al (2005) Validation of quantitative BOLD MRI measurements in kidney: application to unilateral ureteral obstruction. Kidney Int 67(6):2305-2312.
5. Wei X, Hu R, Zhou X, et al (2022) Alterations of Renal Function in Patients with Diabetic Kidney Disease: A BOLD and DTI Study. Comput Intell Neurosci 2022:6844102.
6. Sørensen SS, Gullaksen S, Vernstrøm L, et al (2023) Evaluation of renal oxygenation by BOLD-MRI in high-risk patients with type 2 diabetes and matched controls. Nephrol Dial Transplant 38(3):691-699.
7. Li C, Liu H, Li X, Zhou L, Wang R, Zhang Y (2019) Application of BOLD-MRI in the classification of renal function in chronic kidney disease. Abdom Radiol (NY) 44(2):604-611.
8. Luo F, Liao Y, Cui K, Tao Y (2020) Noninvasive evaluation of renal oxygenation in children with chronic kidney disease using blood-oxygen-level-dependent magnetic resonance imaging. Pediatr Radiol 50(6):848-854.
9. Li X, Wang W, Cheng D, et al (2022) Perfusion and oxygenation in allografts with transplant renal artery stenosis: Evaluation with functional magnetic resonance imaging Clin Transplant 36(11):e14806.
10. Zheng Z, Wang Y, Yan T, et al (2021) Detection of renal hypoxia configuration in patients with lupus nephritis: a primary study using blood oxygen level-dependent MR imaging. Abdom Radiol (NY) 46(5):2032-2044.
11. Ogata H, Yamazaki Y, Tezuka Y, et al (2021) Renal Injuries in Primary Aldosteronism: Quantitative Histopathological Analysis of 19 Patients With Primary Adosteronism. Hypertension 78(2):411-421.
12. Chauhan K, Schachna E, Libianto R, et al (2022) Screening for primary aldosteronism is underutilised in patients with chronic kidney disease. J Nephrol 35(6):1667-1677.
13. Haze T, Hatakeyama M, Komiya S, et al (2021) Association of the ratio of visceral-to-subcutaneous fat volume with renal function among patients with primary aldosteronism. Hypertens Res 44(10):1341-1351.
Figures