2893
Diagnostic value of modified clear cell likelihood score based on pseudocapsule for predicting the malignancy in small renal masses1Department of Radiology, First Medical Center, Chinese PLA General Hospital, Beijing, China, 2Department of Radiology, Sixth Medical Center, Chinese PLA General Hospital, Beijing, China, 3Department of Pathology, First Medical Center, Chinese PLA General Hospital, Beijing, China
Synopsis
Keywords: Kidney, Kidney, Multi-parameter magnetic resonance imaging; Clear cell likelihood score; Clear cell renal cell carcinoma; Pseudocapsule
Motivation: Clear cell likelihood score version 2.0 (ccLS v2.0) is not yet able to predict malignancy in small renal masses (SRMs). Pseudocapsule may provide added value with ccLS v2.0
Goal(s): To develop a modified clear cell likelihood score based on pseudocapsule (m-ccLS) for predicting malignancy in SRMs
Approach: Receiver operating characteristic curve (ROC), net reclassification index (NRI), and integrated discrimination improvement (IDI) were used to compare diagnostic value of m-ccLS and ccLS v2.0
Results: Area under curve (AUC), NRI and IDI of m-ccLS were superior to those of ccLS v2.0 for the diagnosis of malignancy. The likelihood of malignancy increased with higher m-ccLS scores
Impact: M-ccLS achieved predict malignancy of small renal masses (SRMs). M-ccLS may be a valuable tool for expanding the clinical application of this scoring system and contributing to its further promotion and dissemination
Introduction
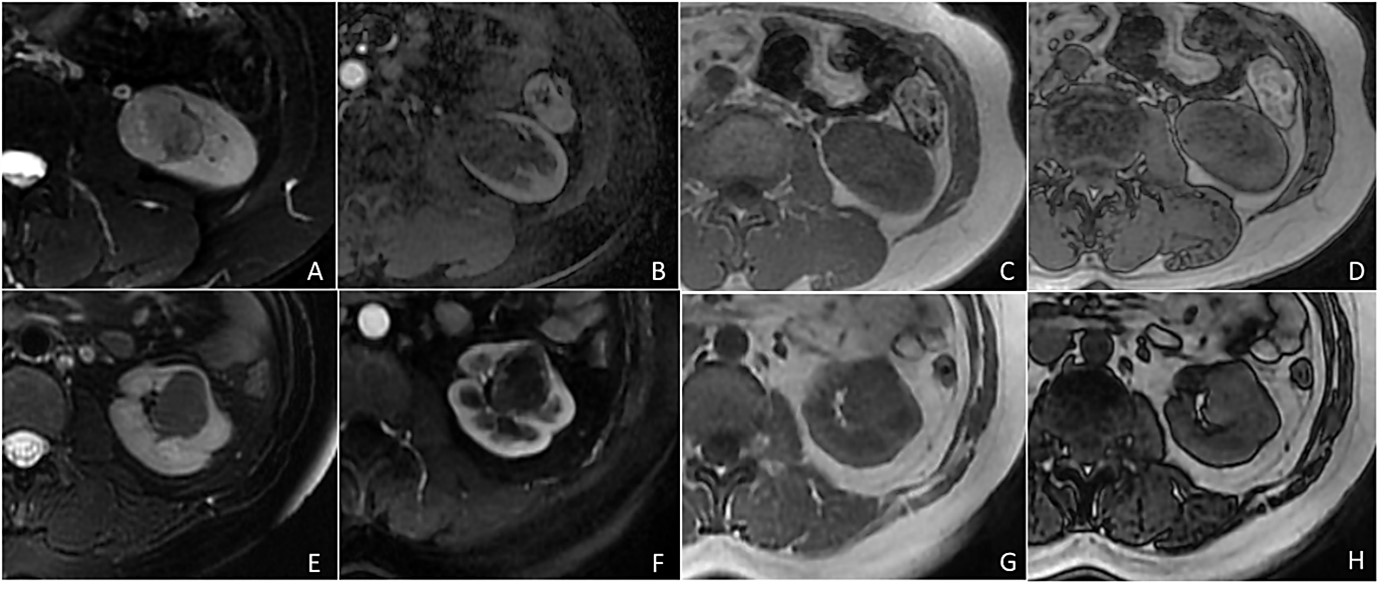
Clear cell likelihood score version 2.0 (ccLS v2.0) provides new ideas for the diagnosis and differential diagnosis of clear cell renal cell carcinoma (ccRCC) and other pathological subtypes. Previous studies have demonstrated that ccLS v2.0 has moderate diagnostic performance and interobserver agreement in predicting ccRCC.1-4 However, this scoring system is not yet able to predict malignancy in small renal masses (SRMs).Pseudocapsule is a fibrous structure formed by the tumor's outward expansion and compression of the surrounding renal parenchyma. Several studies have indicated that pseudocapsule can differentiate benign from malignant renal tumors.5-6 The study by Yamashita et al. revealed that 66% of RCCs in SRMs have the pseudocapsule, which has 93% accuracy and 95% specificity in the tumor stage of ccRCC.7 In 1985, Hricak et al. first described the identification of the pseudocapsule using multi-parameter magnetic resonance imaging (mpMRI).8 Compared to traditional imaging modalities such as Ultrasound (US) and Computed Tomography (CT), mpMRI, particularly T2WI, has higher sensitivity in identifying renal pseudocapsule.9 Therefore, ccLS v2.0 based on mpMRI may benefit from pseudocapsule for the diagnosis of ccRCC and the prediction of malignant renal tumors.
Objectives
our study aims to develop a modified clear cell likelihood score based on pseudocapsule (m-ccLS) to achieve both the diagnostic performance for ccRCC and the prediction of malignancy in SRMsMethods
A total of 352 patients (248 males,104 females; mean age,54±12 years) with 358 SRMs were identified. All patients with pathologically confirmed solid SRMs from three large tertiary medical facilities were divided into the training group (n = 235), the internal validation group (n = 60), and the external validation group (n = 57). Two junior radiologists independently evaluated and recorded whether SRMs had pseudocapsule and other MRI features associated with ccLS v2.0, respectively. Disagreements were resolved by two senior radiologists who reached an agreement. The logistic regression models were used to establish m-ccLS and calibration curves were drawn to evaluate the consistency of m-ccLS predictions with pathological findings. The diagnostic value of m-ccLS and ccLS v2.0 was compared by the receiver operating characteristic curve (ROC), net reclassification index (NRI), and integrated discrimination improvement (IDI)Results
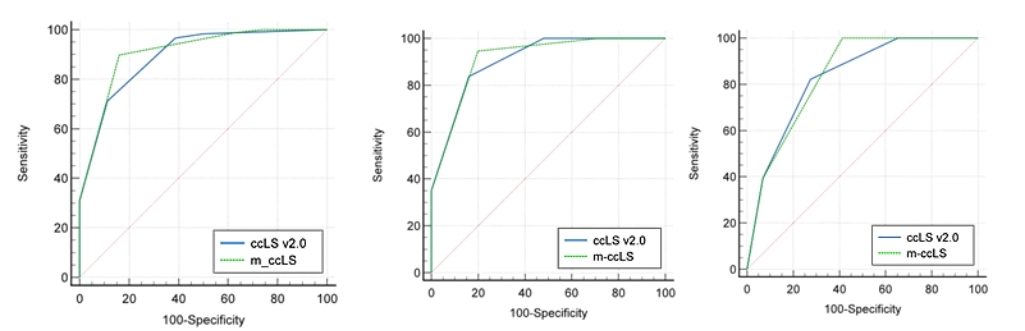
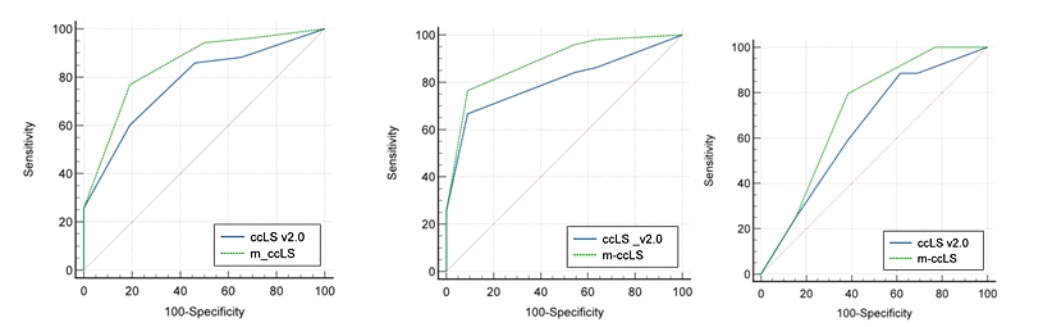
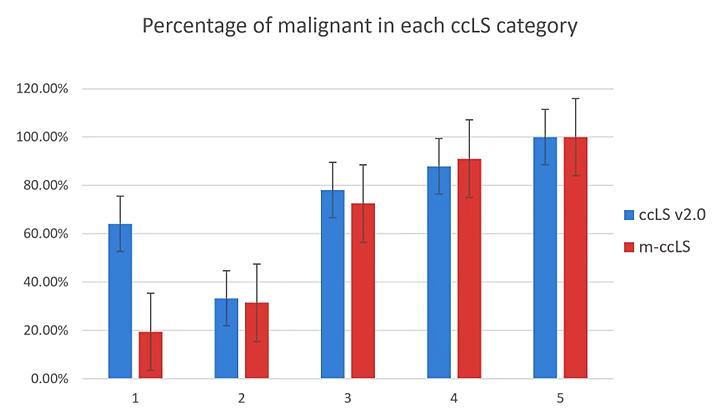
Pseudocapsule had added value for ccLS v2.0 evaluation of ccRCC and malignancy (P<0.001). M-ccLS showed good interobserver agreement in predicting ccRCC and malignancy (P>0.05). Compared with ccLS v2.0, the AUC of m-ccLS for diagnosing malignancy increased from 0.772 (95%CI: 0.714-0.824), 0.801 (95%CI: 0.680-0.892) and 0.645 (95%CI: 0.507-0.767) to 0.848 (95%CI: 0.796-0.891), 0.887 (95%CI: 0.781-0.953) and 0.716 (95%CI: 0.581-0.827) among the three groups, respectively, and there were statistically significant differences among the three groups (P<0.05). The percentage of malignancy in m-ccLS 1-5 scores was 19.5%、31.5%、72.5%、91.1%, and 100.0%, respectively. The NRI and IDI of m-ccLS were higher than those of ccLS v2.0 among the three groupsDiscussion
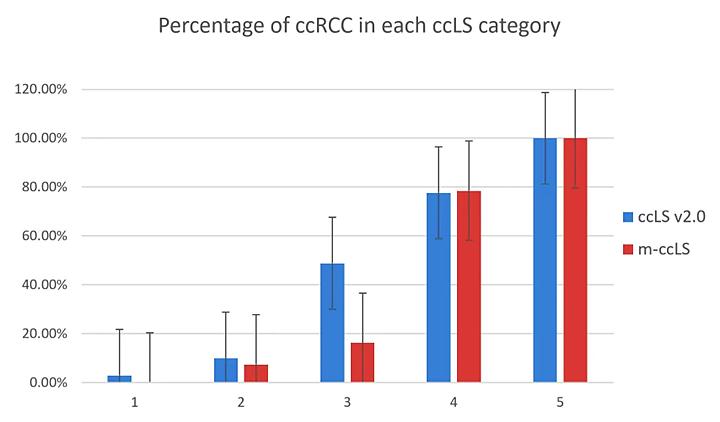
The results in our study showed that m-ccLS achieved predict malignancy in SRMs compared to ccLS v2.0. Similar to the previous study,1 the non-trend of ccLS v2.0 in diagnosing the benign or malignant nature of renal tumors primarily concentrated on scores 1-2. pRCC and ccRCC were the common malignant tumor subtypes with the ccLS 1-2. In our study, among the malignant tumors with ccLS 1-2, 67.9% of malignancies had pseudocapsule presence. These tumors showed a decrease in the percentage of malignancies in the 1-2 score range after upgrading to a score of 3, indicating that as the m-ccLS scores increased, there was a gradual increase in the percentage of malignancy. In addition, m-ccLS contributed to the differential diagnosis of pRCC and AMLwvf.Our study further calculated NRI and IDI for m-ccLS and ccLS v2.0. NRI is primarily used to evaluate the change in the number of correct classifications of SRMs achieved by m-ccLS compared to ccLS v2.0.10-12 NRI results indicated that m-ccLS has a superior ability to predict ccRCC and malignancy in comparison to ccLS v2.0. IDI is primarily utilized to evaluate the degree of increase or decrease of m-ccLS compared to ccLS v2.0, it quantifies the disparity in prediction probabilities between the old and new scoring systems, reflecting the overall improvement in m-ccLS’s predictive capability.10-12 IDI within the three groups all yielded positive values, suggesting that m-ccLS outperforms ccLS v2.0 in accurately predicting ccRCC and malignancy. Our study concludes by introducing the m-ccLS based on pseudocapsule, which underwent both internal and external validation, demonstrating robust predictive ability and notable advancements.
Conclusion
M-ccLS successfully predicts malignancy in SRMs and has great diagnostic performance and improvement for ccRCC and malignancyAcknowledgements
We acknowledge the financial support from the National Natural Science Foundation of China (Grant 81971580 and 82271951 and 81771785) and Beijing Municipal Natural Science Foundation (Grant 7222167)References
1. Schieda N, Davenport MS, Silverman SG, et al. Multicenter Evaluation of Multiparametric MRI Clear Cell Likelihood Scores in Solid Indeterminate Small Renal Masses. Radiology. 2022;303(3):590-599.
2. Dunn M, Linehan V, Clarke SE, et al. Diagnostic Performance and Interreader Agreement of the MRI Clear Cell Likelihood Score for Characterization of cT1a and cT1b Solid Renal Masses: An External Validation Study. Am J Roentgenol. 2022;219(5):793-803.
3. Hao Y-W, Zhang Y, Guo H-P, et al. Differentiation between renal epithelioid angiomyolipoma and clear cell renal cell carcinoma using clear cell likelihood score. Abdom Radiol (NY). 2023 Sep 25.
4. Ibrahim A, Pelsser V, Anidjar M, et al. Performance of clear cell likelihood scores in characterizing solid renal masses at multiparametric MRI: an external validation study. Abdom Radiol (NY). 2023;48(3):1033-1043.
5. Ascenti G, Gaeta M, Magno C, et al. Contrast-enhanced second-harmonic sonography in the detection of pseudocapsule in renal cell carcinoma[J]. Am J Roentgenol. 2004, 182(6):1525–1530.
6. Cho H-J, Kim S J, Ha U-S, et al. Prognostic value of capsular invasion for localized clear-cell renal cell carcinoma[J]. European urology, 2009, 56(6):1006–1012.
7. Süer E, Ergün G, Baltaci S, et al. Does renal capsular invasion have any prognostic value in localized renal cell carcinoma?[J]. The Journal of urology, 2008, 180(1):68–71.
8. Hricak H, Demas BE, Williams RD, et al. Magnetic resonance imaging in the diagnosis and staging of renal and perirenal neoplasms. Radiology[J]. Radiology, 1995, 3(154):709–715.
9. Pretorius ES, Siegelman ES, Ramchandani P, et al. Renal neoplasms amenable to partial nephrectomy: MR imaging[J]. Radiology, 1999, 1(212):28–34.
10. Mihaescu R, van Zitteren M, van Hoek M, et al. Improvement of risk prediction by genomic profiling: reclassification measures versus the area under the receiver operating characteristic curve. Am J Epidemiol. 2010;172(3):353-361.
11. Mihaescu R, van Zitteren M, van Hoek M, et al. Improvement of risk prediction by genomic profiling: reclassification measures versus the area under the receiver operating characteristic curve. Am J Epidemiol. 2010;172(3):353-361.
12. Pencina MJ, D'Agostino RB Sr, Demler OV. Novel metrics for evaluating improvement in discrimination: net reclassification and integrated discrimination improvement for normal variables and nested models. Stat Med. 2012;31(2):101-113.
Figures