2892
Quantitative susceptibility mapping for characterization of renal tissue pathology in autosomal dominant polycystic kidney disease (ADPKD)1Bioengineering, Santa Clara University, Santa Clara, CA, United States, 2Radiology, Weill Cornell Medicine, New York, NY, United States
Synopsis
Keywords: Kidney, Quantitative Susceptibility mapping, Autosomal polycystic kidney disease, ADPKD, complex cysts, hemorrhage, renal calcifications
Motivation: Current MRI-based approaches for assessment of the complications related to the ADPKD (hemorrhage and calcifications) suffer from low specificity due to the complex and nonlinear dependence of T1/T2 relaxation times on tissue composition.
Goal(s): The aim of this study is to assess QSM as an enrichment biomarker suited for unambiguous differentiation of various complex ADPKD cysts.
Approach: We perform a cross-sectional study in ADPKD subjects categorizing complex cysts based on their appearance on QSM and assessing their prevalence in patient population.
Results: The results of our imaging study demonstrate that QSM can provide complimentary characterization of cyst composition and visualize calcifications within kidneys.
Impact: Our results indicate that QSM can identify unique susceptibility properties of complex cysts unattainable with traditional imaging approaches, which may serve as an enrichment biomarker for ADPKD progression and the development of cyst complications.
Introduction
ADPKD is the most common hereditary kidney disease characterized by uncontrolled formation of fluid-filled cysts leading to compression and obstruction of nephrons and subsequent anatomic disruption of the glomerular filtration ratio(1). The optimal clinical management relies on identification of patients at higher risk of GFR decline and disease-related complications(2,3) such as bleeding and nephrolithiasis(4). MRI is an attractive imaging modality due to its wide availability, sensitivity to properties of soft tissues, and lack of ionizing radiation. Nevertheless, differentiation of hemorrhaging and benign proteinaceous cysts, and calcifications remains a challenging task due to the low specificity of traditional T1w/T2w/diffusion MRI(5-8). We propose that QSM can be utilized to identify and classify ADPKD renal pathologies based on their magnetic properties.Methods
34 consecutive patients (11 male, 22 female) diagnosed with ADPKD(9,10) underwent an imaging study between July 2021 and March 2023 on a 3T clinical MR scanner (GE Healthcare, Waukesha, WI) using a body phased array coil. The imaging protocol included T2-weighted fast spin echo sequence (voxel size = 0.78$$$\times$$$0.78$$$\times$$$4 mm3, echo time (TE) = 92 ms, repetition time (TR) = 1010 ms, flip angle (FA) = 130°, readout bandwidth (rBW) = 355 Hz/pixel); a 3-dimensional multiecho gradient echo sequence (matrix size = 224$$$\times$$$224$$$\times$$$30 interpolated to 512$$$\times$$$512$$$\times$$$60; voxel size = 0.78$$$\times$$$0.78$$$\times$$$4 mm3, first TE = 1.2 ms, echo spacing ( TE) = 1.1 ms, #TE = 6, TR = 8.3 ms, rBW = 390 Hz/pixel). All acquisitions were performed using breath-hold technique. Additionally, patient’s clinical history was reviewed for abdominal CT examinations within 1 year prior to the MR imaging. Gradient echo data was used to reconstruct QSM(11). Images were co-registered into GRE image space using ITK-SNAP(12). When necessary due to non-rigid deformation of the tissues and differences in breath hold depth between acquisitions, registration was performed separately for the left and right kidneys. To access the disease burden in the patient cohort, all T2w-visible cysts with sizes greater than 2 mm in diameter were identified, counted and classified as simple (T2 hyperintense) or complex (T2 hypointense) in 3 randomly selected subjects. In the entire study cohort, the identified QSM hyper- and hypointense cysts were counted, their appearance on T2-weighted MR images were recorded, and the prevalence of the identified QSM-based cyst subclasses was estimated.Results
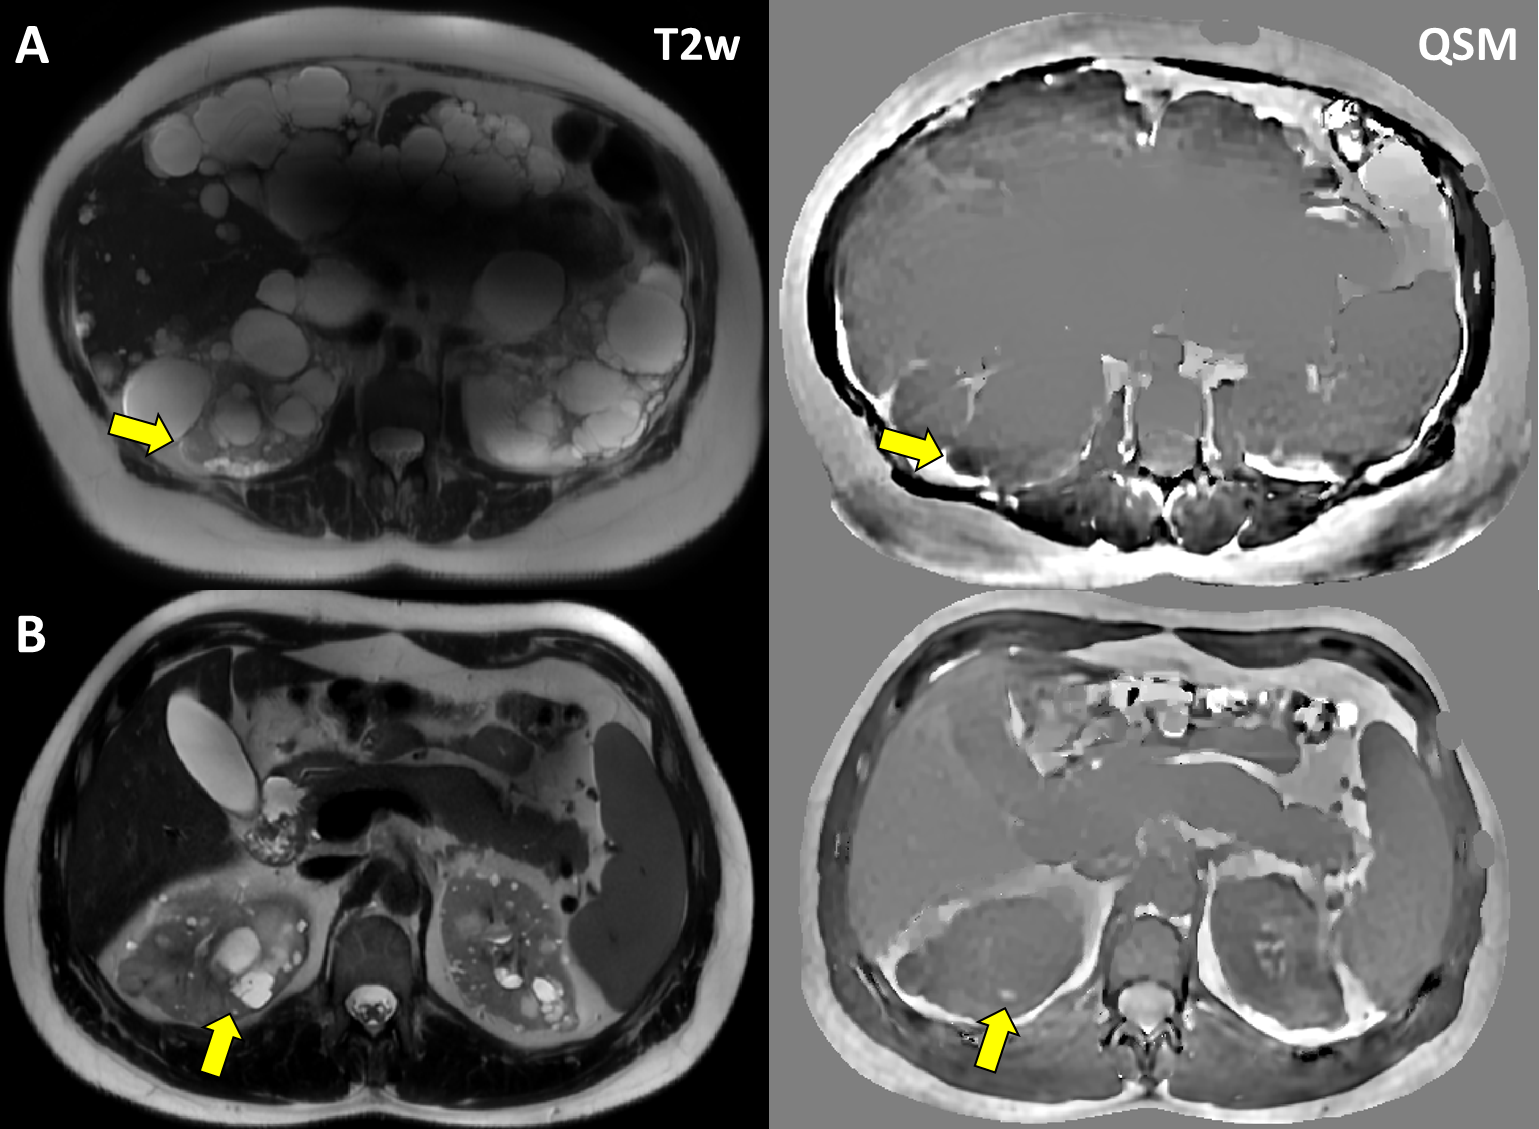
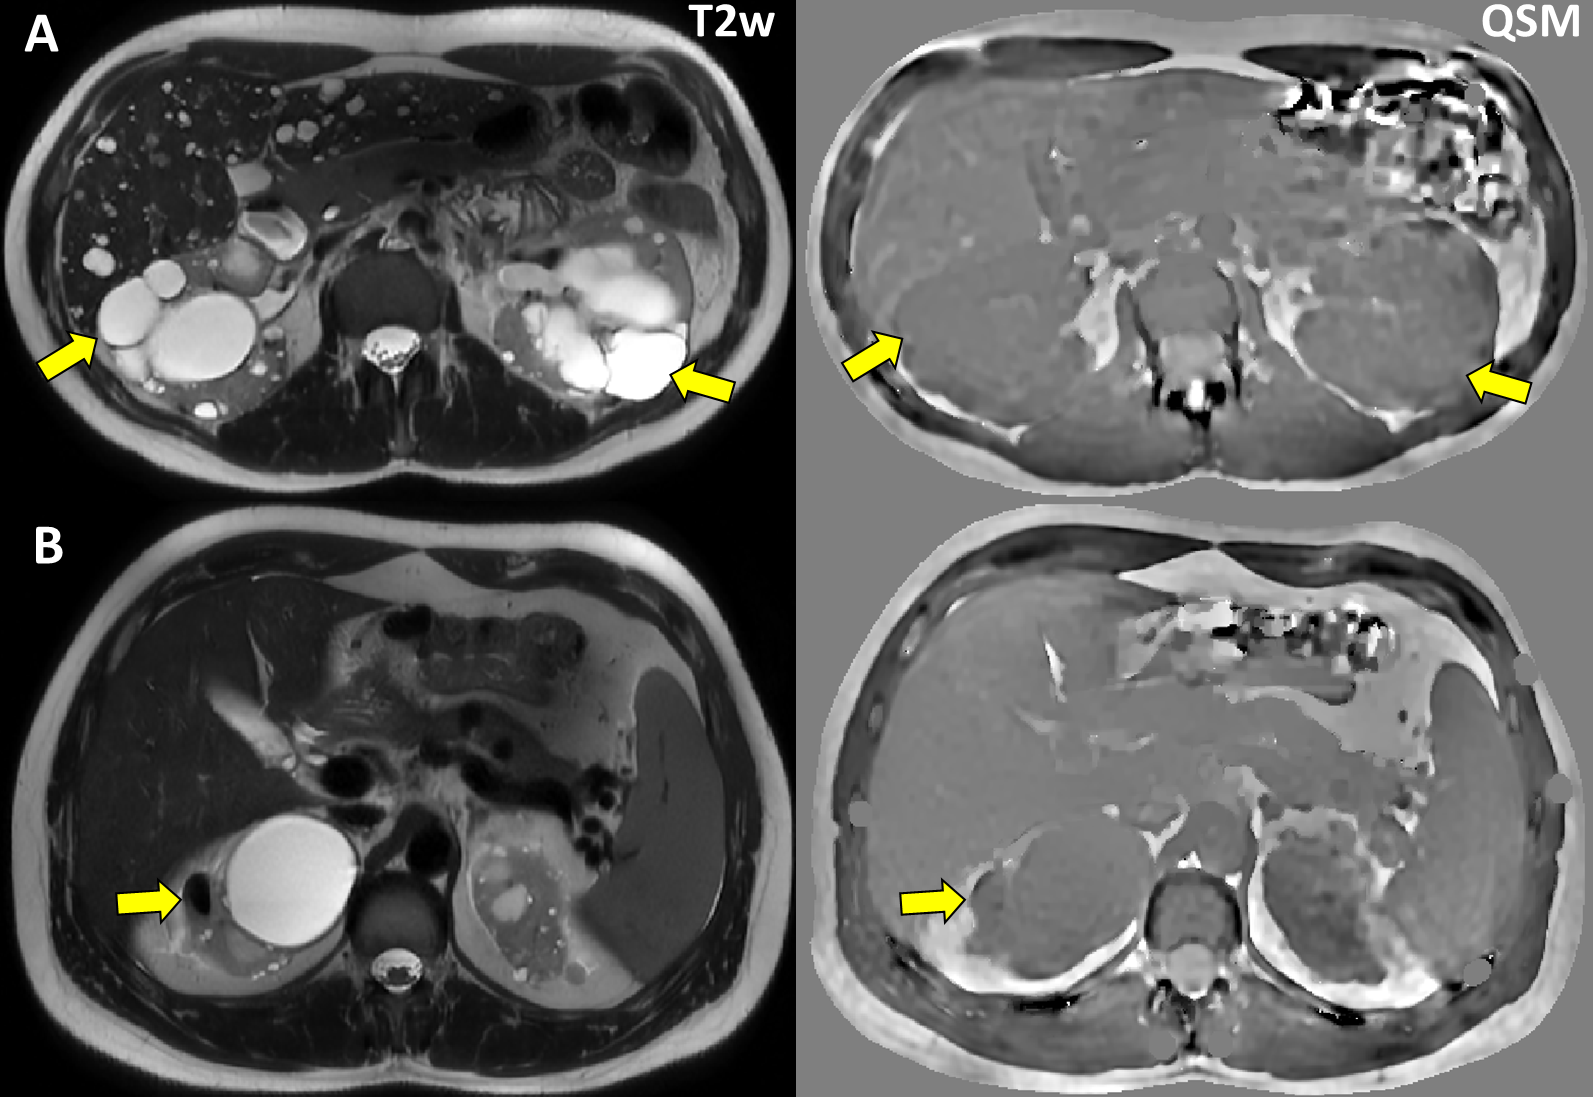
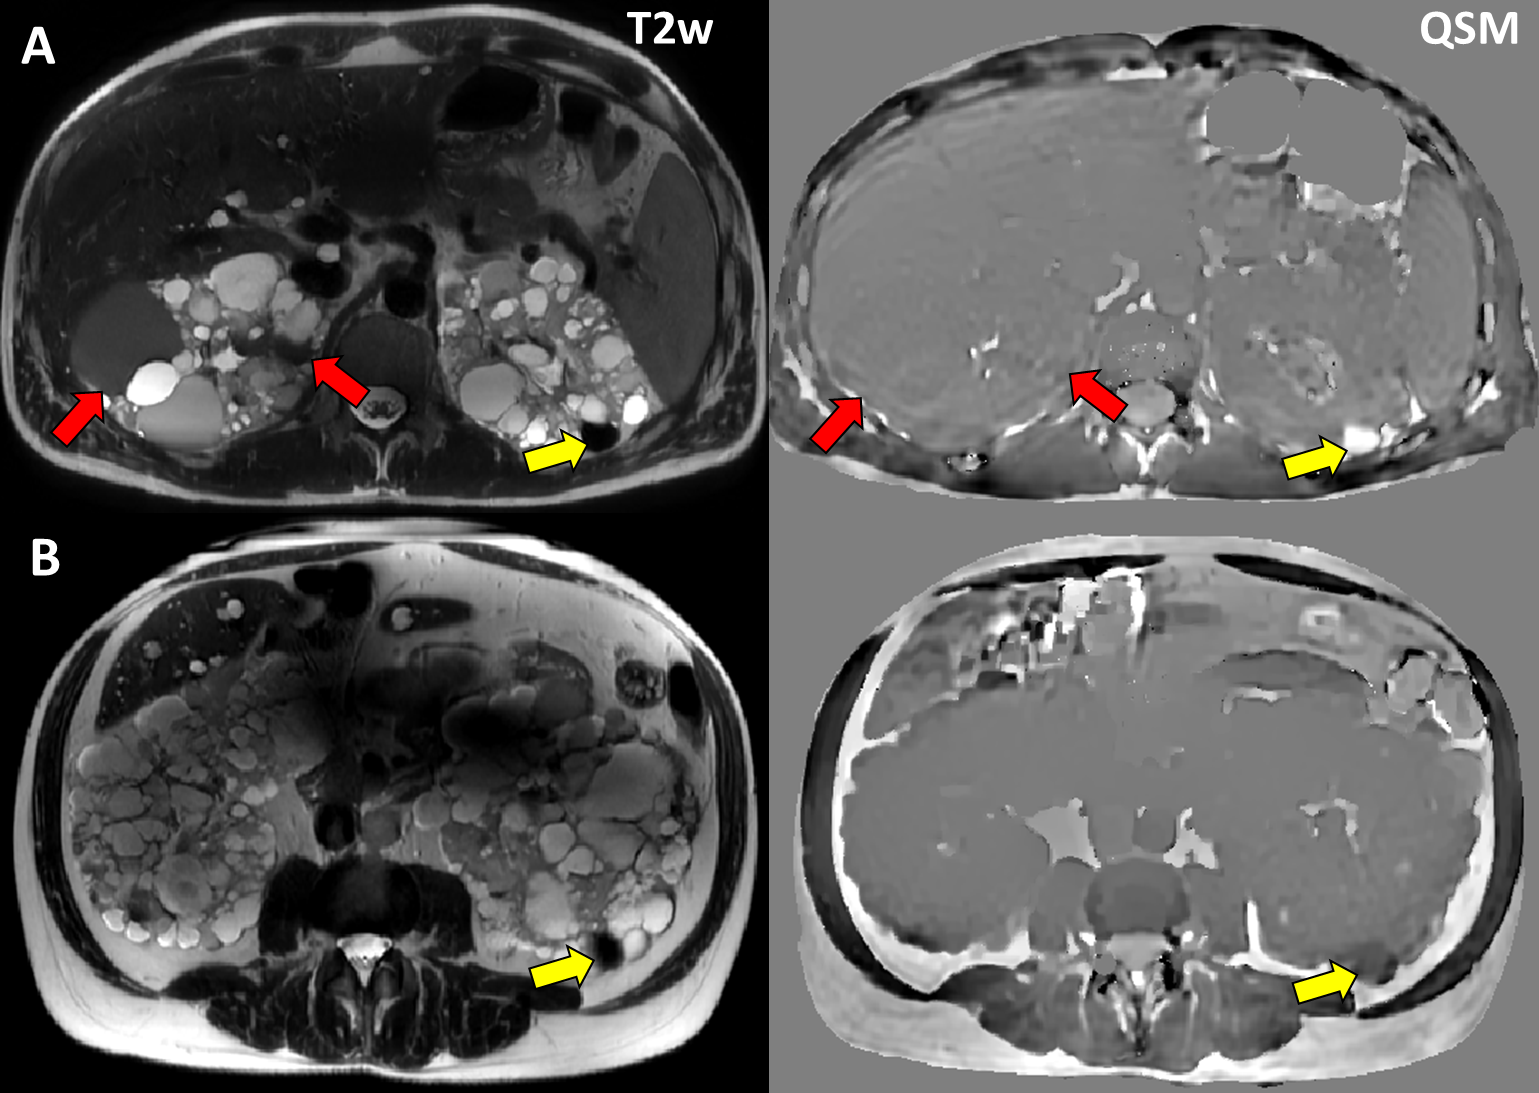
The total kidney cyst burden in the three fully quantified subjects ranged from 145 to 396 cysts per kidney (average: 256, 95%CI: [143..368]), with majority (72%) being QSM isointense/T2 hyperintense (Figure 1A) appearance. The second major class was QSM isointense/T2 hypointense cysts (13%, Figure 1B). The third major cyst class was “QSM-complex” cysts appearing as either hypo- or hyperintense on QSM. In complete cohort, 250 QSM-complex cysts were identified. We established 6 subclasses of QSM-complex cysts based on their appearance on T2w MRI:T2 hypointense/QSM hyperintense (Figure 2A) cysts occurred with the highest incidence over the whole population with 106 catalogued cysts representing 42.4% of all QSM-complex cysts. T2 hypointense/QSM hypointense (Figure 2B) cyst subclass occurred with the second highest incidence of 41 cysts (16.4% of 250 of identified QSM-complex cysts). T2 isointense/QSM hyperintense (Figure 4B) cysts subclass had the 3rd highest incidence over the whole population with 38 cataloged cysts representing 15.2% of all QSM-complex cysts. T2 hyperintense/QSM hypointense (Figure 3A) cysts occurred as the subtype with the 4th highest incidence (33 out of 250) , representing 13.2% of QSM -complex cysts. The two remaining cyst subclasses together accounting for 12.8% of QSM-complex cysts were represented by T2 hyperinense/QSM hyperintense (6.4% of the total count) and T2 isointense/QSM hypointense (6.4% of the total count, Figure 4A) cysts.
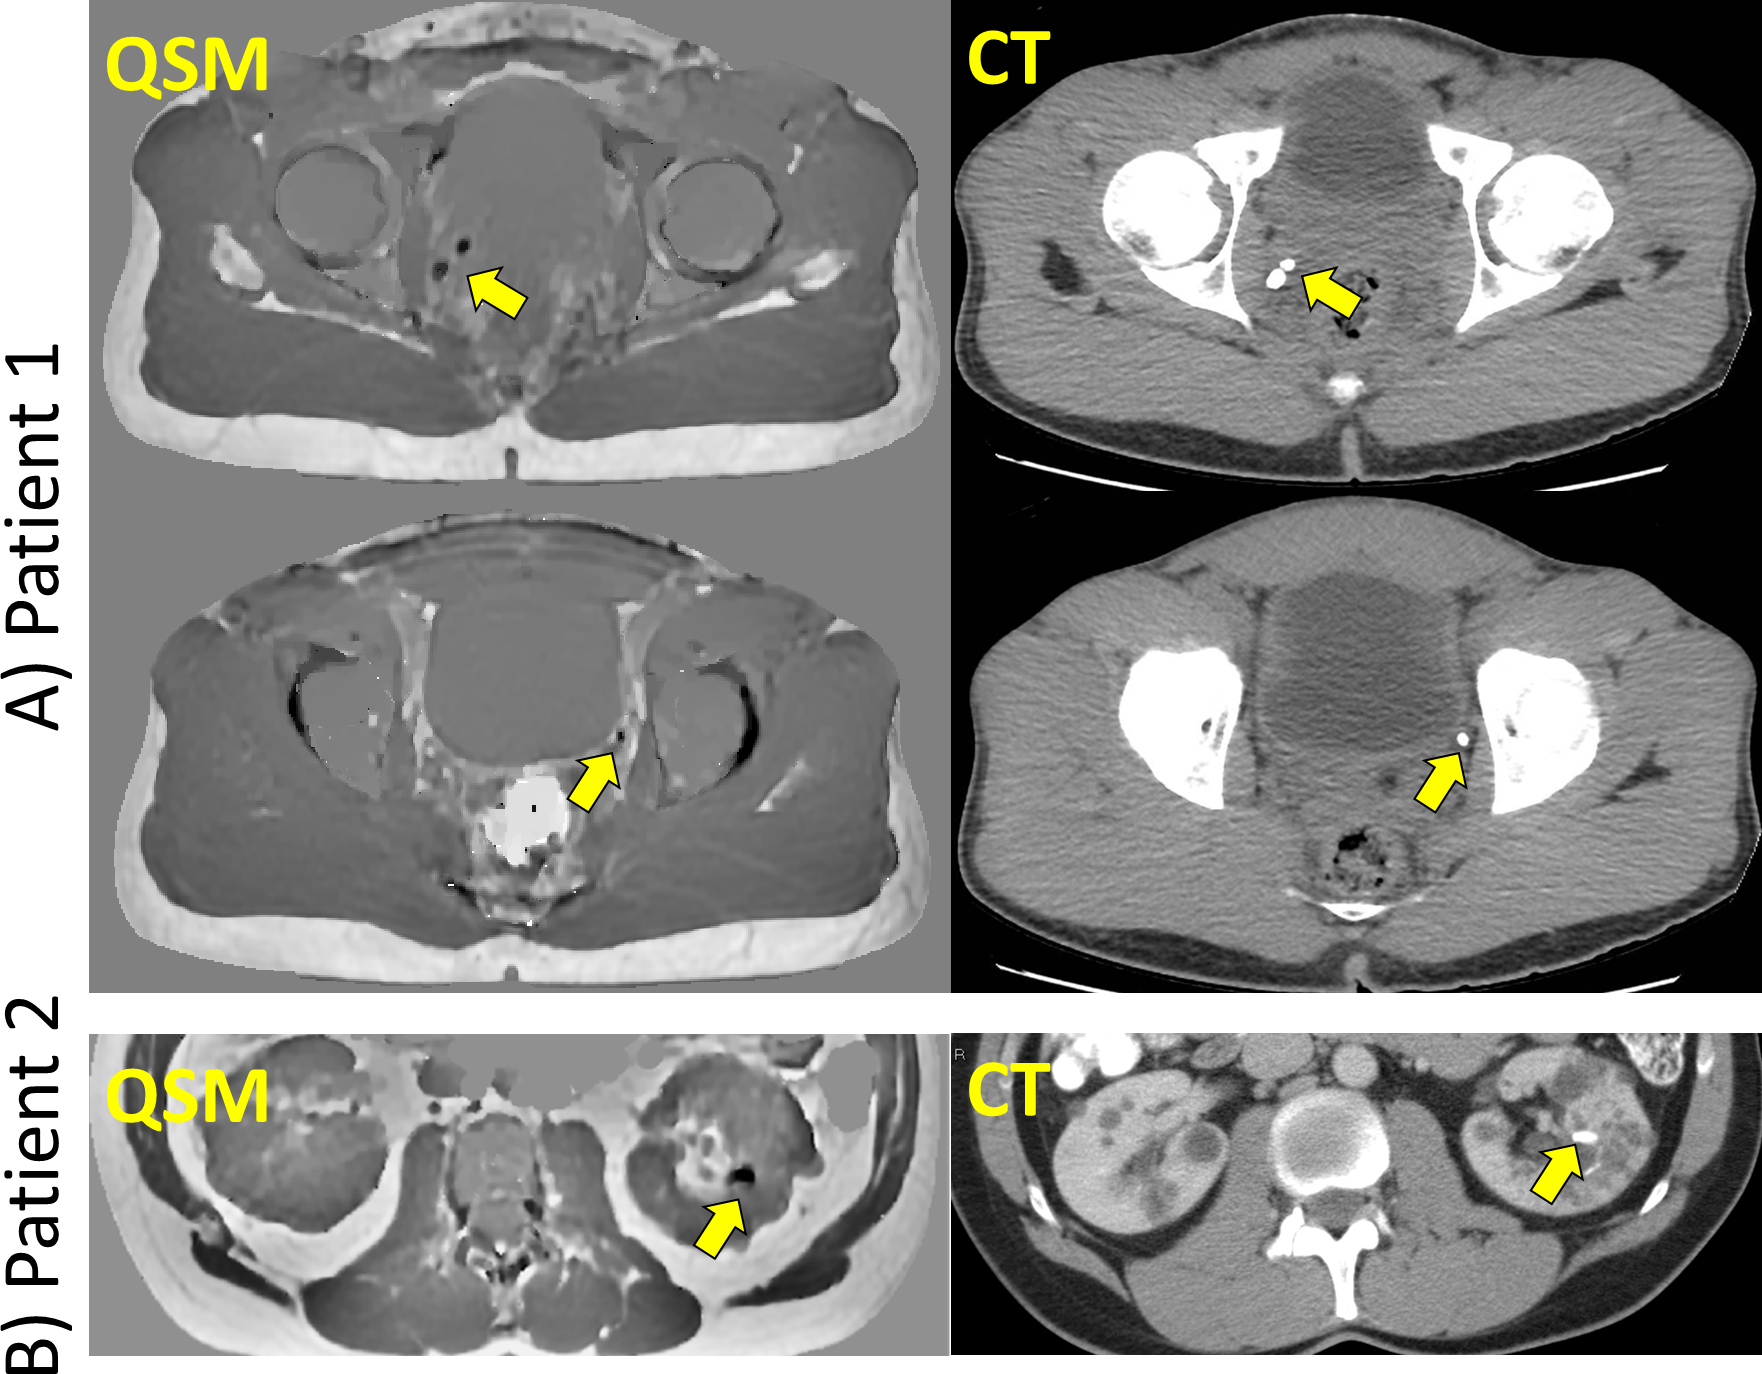
In two of the subjects, there were incidental findings in abdominal CT. In one subject, CT revealed bilateral phleboliths in the pelvic area, while the other had a large renal calcification in left mid-kidney. These calcifications have been successfully visualized on QSM as distinct focal hypointensities.
Discussion
The promising results obtained in this preliminary study suggest that QSM can play an important complementary role in ADPKD pathology assessment, especially for distinguishing hemorrhaging and dense proteinaceous cysts, as well as for detecting small focal calcifications in kidneys and urinary tract, improving specificity and diagnostic confidence. While some combinations of imaging features are readily explainable (e.g., “-/+” due to hemorrhage; “-/-” due to high protein content), explanation of the others (e.g., “-/=” or “+/+”) warrants further investigation and histopathological validationConclusion
Our study demonstrates that QSM can be utilized in ADPKD subjects to distinguish hemorrhaging and dense proteinaceous cysts, as well as to detect calcifications within the kidneys and downstream in the urinary system.Acknowledgements
No acknowledgement found.References
1. Perrone RD, Ruthazer R, Terrin NC. Survival after end-stage renal disease in autosomal dominant polycystic kidney disease: contribution of extrarenal complications to mortality. Am J Kidney Dis. Oct 2001;38(4):777-84. doi:10.1053/ajkd.2001.27720
2. Agarwal MM, Hemal AK. Surgical management of renal cystic disease. Curr Urol Rep. Feb 2011;12(1):3-10. doi:10.1007/s11934-010-0152-2
3. Chebib FT, Torres VE. Assessing Risk of Rapid Progression in Autosomal Dominant Polycystic Kidney Disease and Special Considerations for Disease-Modifying Therapy. Am J Kidney Dis. Aug 2021;78(2):282-292. doi:10.1053/j.ajkd.2020.12.020
4. Cornec-Le Gall E, Alam A, Perrone RD. Autosomal dominant polycystic kidney disease. Lancet. Mar 2 2019;393(10174):919-935. doi:10.1016/S0140-6736(18)32782-X
5. Suwabe T, Ubara Y, Sumida K, et al. Clinical features of cyst infection and hemorrhage in ADPKD: new diagnostic criteria. Clin Exp Nephrol. Dec 2012;16(6):892-902. doi:10.1007/s10157-012-0650-2
6. Suwabe T, Ubara Y, Ueno T, et al. Intracystic magnetic resonance imaging in patients with autosomal dominant polycystic kidney disease: features of severe cyst infection in a case-control study. BMC Nephrol. Nov 9 2016;17(1):170. doi:10.1186/s12882-016-0381-9
7. Marotti M, Hricak H, Fritzsche P, Crooks LE, Hedgcock MW, Tanagho EA. Complex and simple renal cysts: comparative evaluation with MR imaging. Radiology. Mar 1987;162(3):679-84. doi:10.1148/radiology.162.3.3809481
8. Nishiura JL, Eloi SR, Heilberg IP. Pain determinants of pain in autosomal dominant polycystic kidney disease. J Bras Nefrol. Jul-Sep 2013;35(3):242-3. doi:10.5935/0101-2800.20130038
9. Pei Y, Obaji J, Dupuis A, et al. Unified criteria for ultrasonographic diagnosis of ADPKD. J Am Soc Nephrol. Jan 2009;20(1):205-12. doi:10.1681/ASN.2008050507
10. Ravine D, Gibson RN, Walker RG, Sheffield LJ, Kincaid-Smith P, Danks DM. Evaluation of ultrasonographic diagnostic criteria for autosomal dominant polycystic kidney disease 1. Lancet. Apr 2 1994;343(8901):824-7. doi:10.1016/s0140-6736(94)92026-5
11. de Rochefort L, Liu T, Kressler B, et al. Quantitative susceptibility map reconstruction from MR phase data using bayesian regularization: validation and application to brain imaging. Magn Reson Med. Jan 2010;63(1):194-206. doi:10.1002/mrm.22187
12. Yushkevich PA, Piven J, Hazlett HC, Smith RG, Ho S, Gee JC, Gerig G. User-guided 3D active contour segmentation of anatomical structures: significantly improved efficiency and reliability. Neuroimage. Jul 1 2006;31(3):1116-28. doi:10.1016/j.neuroimage.2006.01.015
Figures
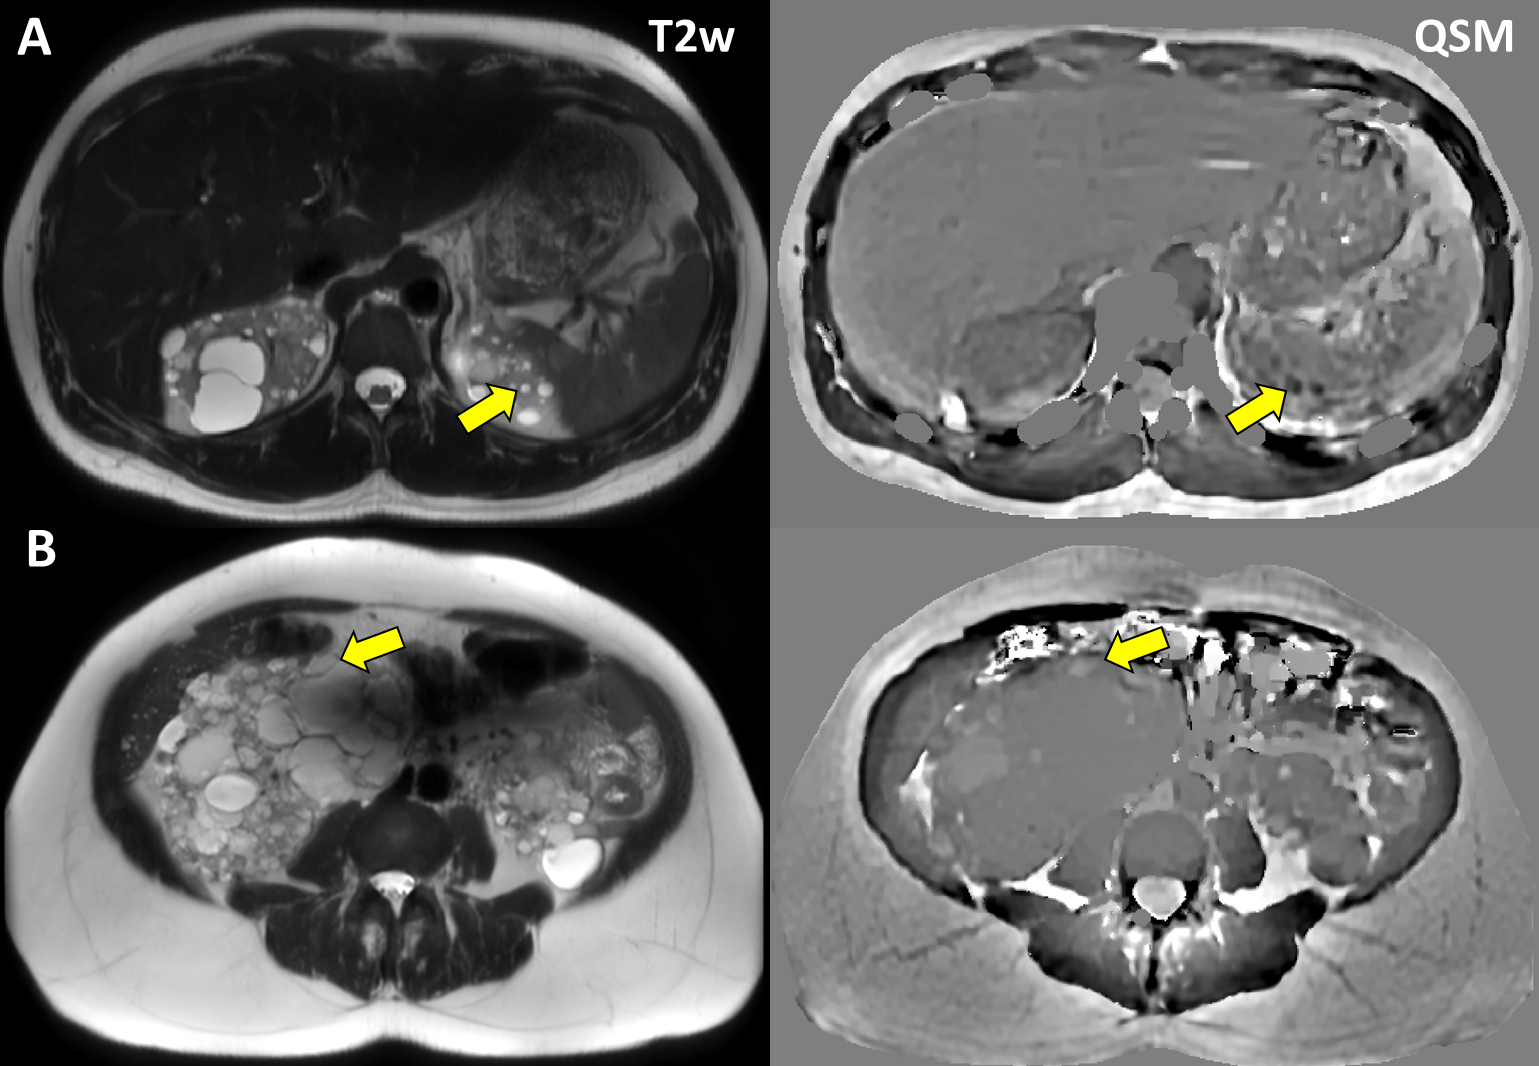
A) T2 hyperintense/QSM hypointense cysts; B) T2 hyperintense/QSM hyperintense cyst;