2891
Kidney MR Fingerprinting and Arterial Spin Labeling (ASL) Assessments of Autosomal Recessive Polycystic Kidney Disease (ARPKD)1Biomedical Engineering, Case Western Reserve University, Cleveland, OH, United States, 2Radiology, University Hospitals- Cleveland Medical Center, Cleveland, OH, United States, 3Center for Pediatric Nephrology, Cleveland Clinic Children’s, Cleveland, OH, United States, 4Bioengineering, Northeastern University, Boston, MA, United States, 5School of Biological and Health Systems Engineering, Arizona State University, Tempe, AZ, United States, 6Siemens Healthineers, Erlangen, Germany, 7Physiology and Biophysics, Case Western Reserve University, Cleveland, OH, United States, 8Pediatrics, Case Western Reserve University, Cleveland, OH, United States
Synopsis
Keywords: Kidney, Genetic Diseases, ARPKD, Pediatric Genetic Disease
Motivation: There are no clinically available therapies for ARPKD.
Goal(s): We evaluated the ability of T1 and T2 from MR Fingerprinting (MRF) to assess kidney cystic burden and Arterial Spin Labeling (ASL) to assess kidney perfusion to detect and stage ARPKD kidney disease.
Approach: 12 ARPKD patients and 10 healthy adult volunteers were scanned on a Siemens 3T with kidney MRF and ASL MRI methods to generate kidney cortical perfusion maps.
Results: Significant increases in kidney T1 and T2, and reduced perfusion were observed between ARPKD patients and healthy volunteers (p<0.001) and between ARPKD patients with early and mild-to-moderate CKD based on eGFR (p<0.03).
Impact: The multi-modal MRI biomarkers in combination evaluated were able to distinctly stratify all three cohorts, including the two ARPKD patient cohorts, demonstrating the utility of a multi-modal MRI approach during future clinical trials aimed at limiting ARPKD kidney disease progression.
Methods: We obtained kidney MRI scans for 12 ARPKD patients (6-22 years of age) and 10 healthy adult volunteers (18-59 years of age). Each subject was scanned in a Siemens Vida 3T MRI scanner with three sequential protocols: (a) localizer scans for slice positioning; (b) a novel kidney Magnetic Resonance Fingerprinting (MRF) method to generate inherently co-registered coronal kidney T1 and T2 maps in 15 seconds / imaging slice9; and (c) a non-contrast Arterial Spin Labeling (ASL) MRI method to generate kidney cortical perfusion maps10. Serum creatinine and cystatin C were obtained for assessment of estimated GFR using the CKID U25 formula for the ARPKD patients11. A subset of ARPKD patients (n=10) underwent a second MRI scan the following day to determine the repeatability of the quantitative kidney MRF and ASL methods. A region-of-interest analysis was used to calculate mean kidney T1, T2, and perfusion values for each subject. Two-tailed Student’s t-tests were used to compare the kidney MRI and eGFR data between the subjects with ARPKD and the healthy volunteers. A probability of 0.05 (α) was used to test for significance.
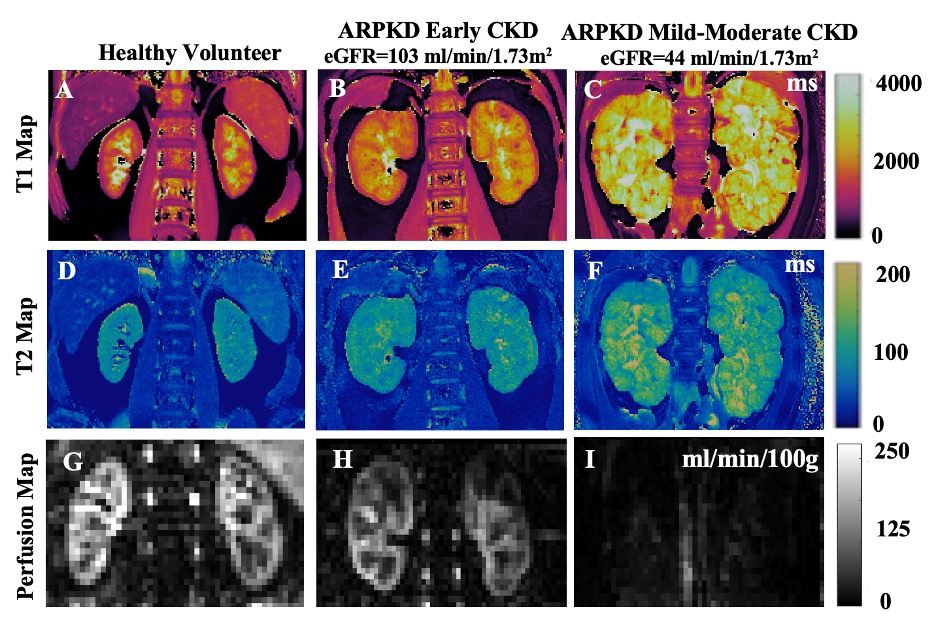
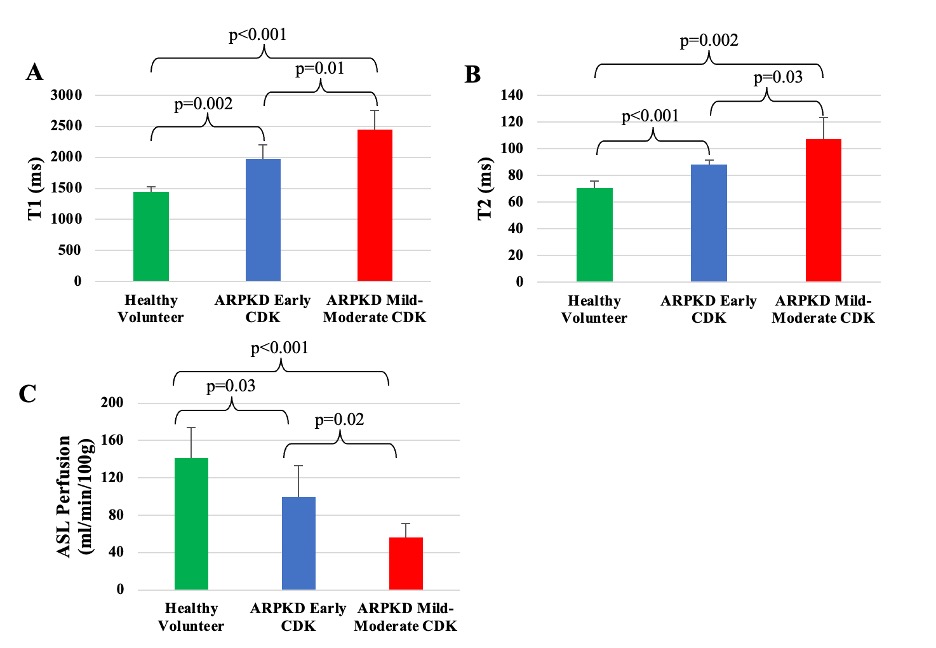
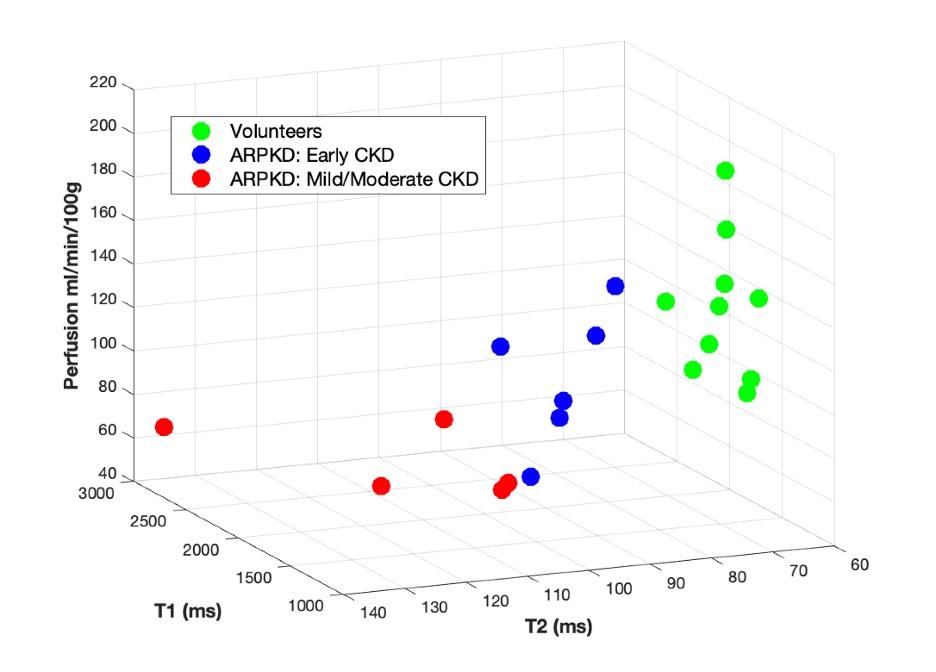
Results: Significant differences between the MRF T1 and T2 and perfusion measurements were observed between ARPKD patients stratified into subgroups with early and mild-moderate CKD based on eGFR (above and below 90 ml/min/1.73m2, n=6/group, Figure 1, p<0.03). There were significant increases in both kidney T1 and T2, along with reduced perfusion detected between ARPKD patients (n=12) and healthy volunteers (n=10, p<0.001) (Figure 2). Kidney MRF showed a significant increase in both kidney T1 and T2 in the ARPKD patients in comparison to the healthy volunteers (T1: 2212 vs. 1597 ms; T2: 97 vs. 68 ms, p<0.002). These increased kidney MRF T1 and T2 values are consistent with our preclinical findings in bpk mice12 and are reflective of the increased cystic burden for ARPKD patients, as cysts are known to have higher T1 and T2 values in comparison to normal renal parenchyma. Scans on consecutive days for a subset of ARPKD patients (n=10) revealed mean variation of 2.1% for T1, 2.8% for T2, and 16.3% for perfusion. Figure 3 depicts a visual 3D comparison for cystic burden (T1,T2) and perfusion for the ARPKD patient cohorts and healthy volunteers. Importantly, the multi-modal MRI biomarkers in combination were able to distinctly stratify all three cohorts, including the two ARPKD patient cohorts, demonstrating the utility of a multi-modal MRI approach.
Conclusions: This initial cross-sectional study in children and young adults with ARPKD showed that these quantitative MRI biomarkers can: (1) sensitively detect early-stage ARPKD kidney disease (eGFR≥90, n=6) in comparison to healthy asymptomatic adult volunteers (n=10); and (2) differentiate subjects with early-stage CKD from subjects with mild-moderate CKD (eGFR<90, n=6). The multi-modal MRI methods shown in this study are repeatable in subjects with ARPKD as young as 6 years of age and can be completed within <15 minutes of total scan time with no injectable MRI contrast agent or sedation. As such, despite the small cohort size, these preliminary findings suggest that kidney MRF T1 and T2 and perfusion can be used as sensitive outcome measures in combination with clinical measures of kidney function (eGFR) during future clinical trials aimed at limiting ARPKD kidney disease progression.
Acknowledgements
Siemens Healthineers, NIHReferences
- Dell, K. M. The Spectrum of Polycystic Kidney Disease in Children. Adv Chronic Kidney Dis 18, 339–347 (2011).
- Hartung, E. A. et al. Neurocognition in Children with Autosomal Recessive Polycystic Kidney Disease in the CKiD Cohort Study. Pediatr Nephrol 29, 1957–1965 (2014).
- Bergmann, C. ARPKD and early manifestations of ADPKD: the original polycystic kidney disease and phenocopies. Pediatr Nephrol 30, 15–30 (2015).
- Guay-Woodford, L. M. et al. Consensus Expert Recommendations for the Diagnosis and Management of Autosomal Recessive Polycystic Kidney Disease: Report of an International Conference. The Journal of Pediatrics 165, 611–617 (2014).
- Gattone, V. H., Wang, X., Harris, P. C. & Torres, V. E. Inhibition of renal cystic disease development and progression by a vasopressin V2 receptor antagonist. Nat Med 9, 1323–1326 (2003).
- Tao, Y., Kim, J., Schrier, R. W. & Edelstein, C. L. Rapamycin Markedly Slows Disease Progression in a Rat Model of Polycystic Kidney Disease. Journal of the American Society of Nephrology 16, 46 (2005).
- Shillingford, J. M. et al. The mTOR pathway is regulated by polycystin-1, and its inhibition reverses renal cystogenesis in polycystic kidney disease. Proc Natl Acad Sci U S A 103, 5466–5471 (2006).
- Dell, K. M. et al. A novel inhibitor of tumor necrosis factor-α converting enzyme ameliorates polycystic kidney disease. Kidney International 60, 1240–1248 (2001).
- MacAskill, C. J. et al. Rapid B1 -Insensitive MR Fingerprinting for Quantitative Kidney Imaging. Radiology 300, 380–387 (2021).
- Dekkers, I. A. et al. Consensus-based technical recommendations for clinical translation of renal T1 and T2 mapping MRI. Magma (New York, N.y.) 33, 163 (2020).
- Pierce, C. B. et al. Age- and sex-dependent clinical equations to estimate glomerular filtration rates in children and young adults with chronic kidney disease. Kidney Int 99, 948–956 (2021).
- MacAskill, C. J. et al. Multi-parametric MRI of kidney disease progression for autosomal recessive polycystic kidney disease: mouse model and initial patient results. Pediatr Res 89, 157–162 (2021).
Figures