2890
Quantitative Assessment of Renal Steatosis in Type 2 Diabetes Mellitus Patients Using IDEAL-IQ Imaging: Reproducibility and Implications1Guizhou Provincial People Hospital, guiyang, China, 2GE HealthCare MR Research, Beijing, China
Synopsis
Keywords: Kidney, Quantitative Imaging, type 2 diabetes mellitus; IDEAL-IQ; proton-density fat fraction; diabetic kidney disease
Motivation: Renal parenchymal fat deposits play a crucial role in the development of diabetic kidney disease (DKD). Noninvasive measurement of renal parenchymal fat deposits using functional MRI provides valuable insights into the pathogenesis of DKD.
Goal(s): Exploring the reproducibility of IDEAL-IQ imaging in quantifying renal lipid deposition and to investigate the differences observed in DKD patients.
Approach: A total of 26 healthy participants underwent two IDEAL-IQ scans without repositioning and 96 type 2 diabetes mellitus (T2DM) patients underwent a single IDEAL-IQ scan.
Results: IDEAL-IQ imaging is a reproducible technique for noninvasively quantifying renal lipid deposition. Furthermore, the technique shows promising performance in staging DKD.
Impact: This study highlights the potential benefits of IDEAL-IQ imaging in evaluating renal lipid deposition in DKD patients. It contributes to a better understanding of the pathogenesis and progression of DKD, to improved diagnostic and management strategies for T2DM patients.
Introduction
Diabetic kidney disease (DKD) is a leading cause of end-stage renal disease, but the underlying mechanisms linking type 2 diabetes mellitus (T2DM) to DKD are not fully understood. Recent studies have shown that abnormal renal lipid deposition is associated with DKD, leading to glomerular sclerosis, tubular damage, interstitial fibrosis, and impaired renal function1. Iterative decomposition of water and fat with echo asymmetry and least squares estimation-iron quantification (IDEAL-IQ) imaging has shown promise in exploring ectopic fat deposition in the kidneys. This study aims to evaluate the reproducibility of IDEAL-IQ imaging in quantifying renal lipid deposition and its application in T2DM patients.Methods
This study was approved by the Institutional Review Board (approval number: KY2022-02). A total of 26 healthy controls (HC) to assess the reproducibility and 96 T2DM patients for examination of renal lipid deposition. The T2DM patients were classified into three groups based on their estimated glomerular filtration rate (eGFR): T2DM (eGFR >90 mL/min/1.73m2), DKDI–II (90>eGFR>60mL/min/1.73m2), and DKDIII-IV (60>eGFR>15 mL/min/1.73 m2).Data Analysis
Social science statistical software package (SPSS) 26.0 were used for statistical analysis. Pearson correlations were calculated to assess the reproducibility of renal proton-density fat fraction (PDFF) measurements. Bland–Altman plots were used to visualize the differences between the first and second measurements. One-way ANOVA was used to analyze the differences in clinical data and renal PDFF values among the three groups. Pearson’s correlation analysis was used to evaluate correlations between PDFF and clinical index. Receiver-operating-characteristic (ROC) curve was constructed to assess the diagnostic performance of renal IDEAL-IQ. p<0.05 was considered significant.MRI Acquisition
All patients underwent MRI examination on a 3.0T MR scanner (Discovery MR 750W, GE Healthcare, Milwaukee, WI) with 8-channels flexible coil. IDEAL-IQ was acquired with the following parameters: TR/TE, 6.2/2.5ms; slice thickness, 5mm; matrix size, 160×160; FOV, 420×336mm; acquisition time, 17s. IDEAL-IQ scans were repeated without repositioning the subject or changing the position of the surface coil. All image analysis was performed on anonymized data using AW.4.6 by two trained abdominal radiologists (Fig.1).Results
Bland-Altman analyses showed narrower limits of agreement and a significant difference in the correlated variances (r=0.81, p<0.05) (Fig. 2). Renal PDFF values differed significantly among the HC, T2DM, DKDI-II, and DKDIII-IV groups, with the highest values observed in the DKDIII-IV group (Table 1). There was a negative correlation between renal PDFF and eGFR (r=0.437, p<0.001), as well as a positive correlation with serum creatinine levels (r=0.421, p<0.001) (Fig. 3). ROC curve analysis demonstrated excellent performance of renal IDEAL-IQ imaging in distinguishing different stages of DKD (Fig. 4).Discussion
This study explored the use of IDEAL-IQ as a non-invasive tool for studying renal lipid deposition in T2DM. IDEAL-IQ imaging demonstrated good reproducibility and showed significantly higher renal lipid deposition in T2DM patients compared to healthy controls. Interestingly, there are significant increase in renal lipid content as diabetes progresses. These findings suggest that IDEAL-IQ imaging holds promise as a non-invasive tool for monitoring changes in renal lipid deposition in different stages of T2DM. The observed low lipid content in the kidneys, with a mean renal PDFF value of 0.77% in healthy volunteers, is consistent with previous studies ranging from 0.12% to 2.52%2-5. However, there were variations in renal PDFF values even within this relatively homogenous group, which may be attributed to technical differences (such as field strength) and population variations6. Therefore, further research in standardized scanning protocols, larger clinical and multi-ethnic population trials is warranted to better delineate the renal lipid deposition. Even in the DKD III-IV cohorts, the mean renal PDFF value was only 1.46%. This is consistent with histological and biochemical findings in previous studies7-9. However, even small elevations in renal lipid content may have pathophysiological significance, considering that the kidney is not a typical lipid storage organ like the liver. This suggests that the role of fatty kidneys may potentially contribute to the development of DKD10. Therefore, the role of the fatty kidney is a potential driver of DKD. On the whole, accurately understanding the degree of lipid accumulation in the human kidney may serve as an index for assessing the severity of renal damage and therapeutic efficacy in T2DM. Consequently, IDEAL-IQ holds the potential utility of as a non-invasive biomarker of DKD.Conclusion
IDEAL-IQ imaging demonstrates good reproducibility and holds potential as a reliable technology for quantifying renal steatosis in T2DM patients. This non-invasive approach may contribute to the identification and monitoring of DKD progression. Further research is needed to validate these findings and establish IDEAL-IQ imaging as a valuable tool in the clinical management of DKD.Acknowledgements
Funding: This study has received funding from National Natural Science Foundation of China (82060314) and Guizhou Province science and technology plan project [2021]037
Conflicts of Interest: All authors have no conflicts of interest to declare.
References
[1] JEON K J, PARK Y, JEONG H, et al. Parotid gland evaluation of menopausal women with xerostomia using the iterative decomposition of water and fat with echo asymmetry and least-squares estimation (IDEAL-IQ) method of MRI: a pilot study [J]. Dento maxillo facial radiology, 2023, 52(4): 20220349.
[2] WANG Y C, FENG Y, LU C Q, et al. Renal fat fraction and diffusion tensor imaging in patients with early-stage diabetic nephropathy [J]. European radiology, 2018, 28(8): 3326-34.
[3] DEKKERS I A, DE HEER P, BIZINO M B, et al. H-MRS for the assessment of renal triglyceride content in humans at 3T: A primer and reproducibility study [J]. Journal of magnetic resonance imaging : JMRI, 2018, 48(2): 507-13.
[4] JONKER J T, DE HEER P, ENGELSE M A, et al. Metabolic imaging of fatty kidney in diabesity: validation and dietary intervention [J]. Nephrology, dialysis, transplantation : official publication of the European Dialysis and Transplant Association - European Renal Association, 2018, 33(2): 224-30.
[5] SHEN Y, XIE L, CHEN X, et al. Renal fat fraction is significantly associated with the risk of chronic kidney disease in patients with type 2 diabetes [J]. Front Endocrinol (Lausanne), 2022, 13: 995028.
[6] DEKKERS I A, BIZINO M B, PAIMAN E H M, et al. The Effect of Glycemic Control on Renal Triglyceride Content Assessed by Proton Spectroscopy in Patients With Type 2 Diabetes Mellitus: A Single-Center Parallel-Group Trial [J]. Journal of renal nutrition : the official journal of the Council on Renal Nutrition of the National Kidney Foundation, 2021, 31(6): 611-9.
[7] HERMAN-EDELSTEIN M, SCHERZER P, TOBAR A, et al. Altered renal lipid metabolism and renal lipid accumulation in human diabetic nephropathy [J]. Journal of lipid research, 2014, 55(3): 561-72.
[8] KISS E, KRäNZLIN B, WAGENBLAΒ K, et al. Lipid droplet accumulation is associated with an increase in hyperglycemia-induced renal damage: prevention by liver X receptors [J]. Am J Pathol, 2013, 182(3): 727-41.
[9] PENG X G, BAI Y Y, FANG F, et al. Renal lipids and oxygenation in diabetic mice: noninvasive quantification with MR imaging [J]. Radiology, 2013, 269(3): 748-57.
[10] BOBULESCU I A. Renal lipid metabolism and lipotoxicity [J]. Current opinion in nephrology and hypertension, 2010, 19(4): 393-402.
Figures
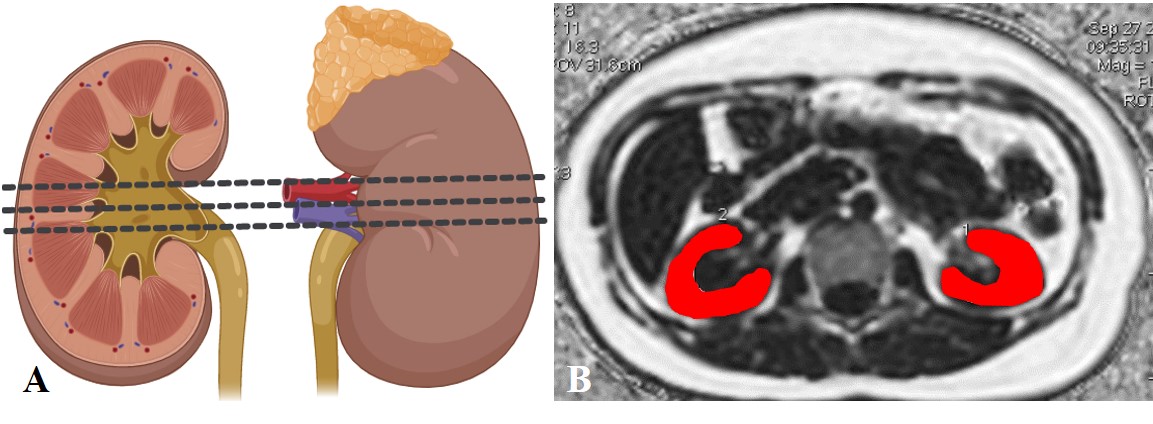
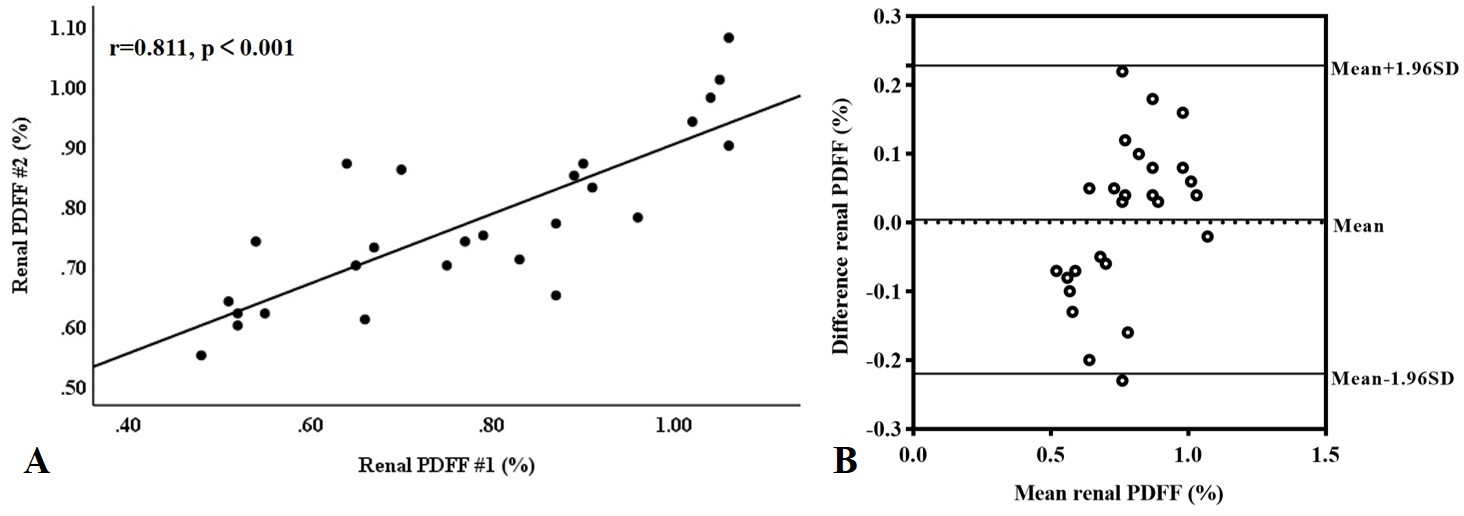
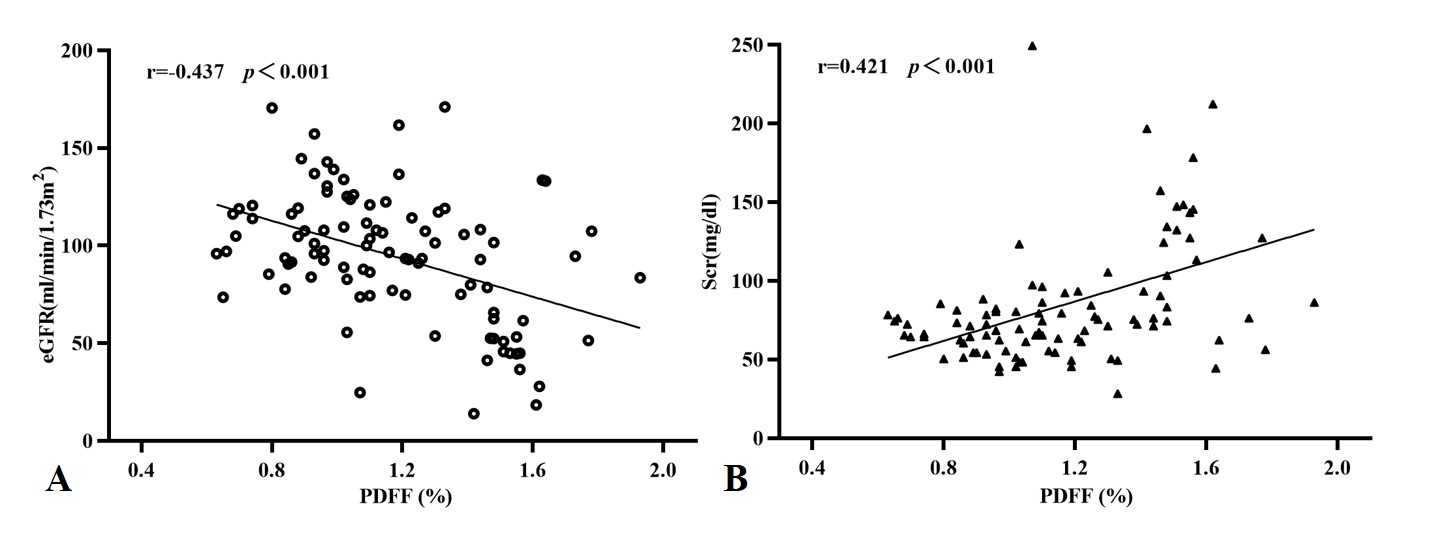
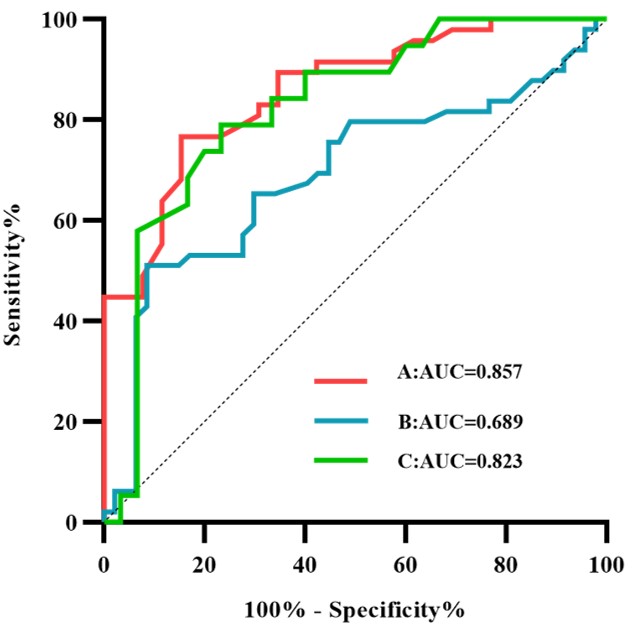
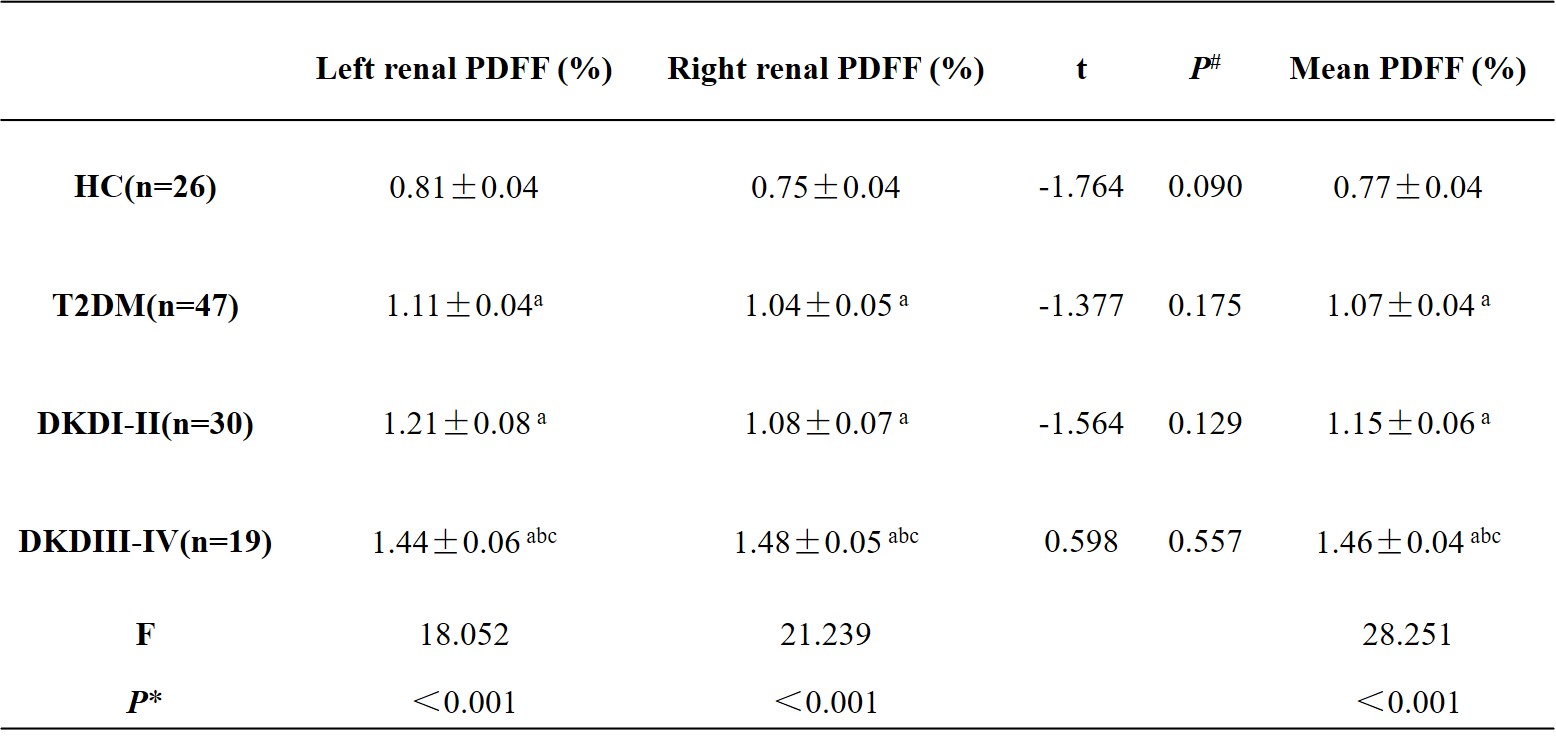
Table 1 Comparison of renal PDFF between four groups (x̅±s)
Note: # paired t-test. No significant differences were found between the right and left kidneys in the renal PDFF. *LSD multiple pairwise-comparison tests were used for statistically significant ANOVA. Means with different letters indicate groups that significantly differed. a significant difference with HC (p <0.05), b significant difference with T2DM (p <0.05), C significant difference with DKDI-II (p <0.05). PDFF: proton-density fat fraction.