2889
The Effect of Age and BMI In Renal mpMRI With Regional Analysis
Luis Carlos Sanmiguel1,2,3, Pieter De Visschere1,2, and Pim Pullens1,3,4
1Department of Radiology and Nuclear Medicine, Ghent University Hospital, Gent, Belgium, 2Department of Diagnostic Sciences, Faculty of Medicine and Health Sciences, Ghent University, Gent, Belgium, 3Ghent Institute of Functional and Metabolic Imaging (GIFMI), Ghent University, Gent, Belgium, 4IBiTech– Medisip, Ghent University, Gent, Belgium
1Department of Radiology and Nuclear Medicine, Ghent University Hospital, Gent, Belgium, 2Department of Diagnostic Sciences, Faculty of Medicine and Health Sciences, Ghent University, Gent, Belgium, 3Ghent Institute of Functional and Metabolic Imaging (GIFMI), Ghent University, Gent, Belgium, 4IBiTech– Medisip, Ghent University, Gent, Belgium
Synopsis
Keywords: Kidney, Kidney, ASL, DWI, ADC, Perfusion, Age, BMI
Motivation: The demand for accurate and non-intrusive renal function evaluation methods.
Goal(s): To discern how age and BMI affect:
- Renal perfusion measured with ASL (Arterial spin labeling).
- Renal diffusion measured with Apparent diffusion coefficient (ADC) from DWI (Diffusion-weighted images).
Approach:
- Recruit and scan healthy volunteers.
- Create a database with the results.
- Apply statistics:
- Evaluating correlations (Spearman coefficient).
- Evaluating differences between groups (Mann-Whitney U test).
Results:
ASL:
- Negative significant age-related perfusion and significant differences between age groups.
- Negative significant correlations of BMI with perfusion in inner regions of the kidneys.
- No significant correlation with age.
- Negative significant correlations of BMI with ADC maps.
Impact: These findings provide insights for the MRI community, enhancing tailored renal understanding and diagnostic precision. Personalized approaches, using age and BMI, have the potential to enhance patient outcomes. This study encourages focused research, promoting personalized medicine and refining renal imaging.
Introduction
In nephrology, precise renal function assessment is vital for predicting kidney diseases1. Arterial spin labeling (ASL) is a magnetic resonance imaging (MRI) technique that can assess changes in renal perfusion non-invasively2. Diffusion-weighted image (DWI) is an MRI technique that is sensible to water motion. The apparent diffusion coefficient (ADC) is one of the easiest parameters that can be obtained from a DWI sequence3. It indicates the whole water movement4 in each voxel. While in other renal function assessment tests, like blood samples (e.g., Serum creatinine) or urine tests (e.g., Proteinuria), it is required to correct the test result for age, race, gender, or body mass index (BMI)5 of the subject, in these two sequences is still not clear the role of these parameters and the measured values. This study investigates the relationship between Age and BMI with ASL and ADC measurements in a healthy cohort of volunteers.Methods
27 subjects were scanned in a supine position on a Siemens PrismaFit 3T. ASL images were acquired using a work-in-progress 3D Turbo Gradient Spin-Echo, pseudo-Continuous Arterial Spin Labeling (p-CASL) sequence. The imaging parameters included a voxel size: 3.8×3.8×5.0mm, TR/TE 5000/27.14ms, T1-Blood=1650.0ms, Start TI=3000ms, PCASL-duration 1500ms, PCASL flip angle 28.0deg. DW images were obtained using a Diffusion sequence from Siemens, with voxel size: 2.1×2.1×5.0mm, TR/TE 4000/64ms, bandwidth: 2368 Hz/Px, b values = [0, 30, 70, 100, 200, 400, 800] s/mm2. Perfusion was calculated inline using the classical compartment model. Diffusion maps were calculated inline. Obtained images were analyzed following the Twelve Layer Concentric Objects (TLCO)6 and Ten Equiangular Object (TEO)7 methods. The mean value of each region was computed. Statistical analyses were conducted using Python. Spearman correlation coefficients were computed between MRI measurements and Age and BMI. Additionally, a Mann-Whitney test was performed in two groups for age [Age<40 and Age>40] and BMI [BMI<25 and BMI>25].Results
Starting from a binary mask, one image for the TLCO and TEO method was obtained (Fig 1). 26 ASL images were analyzed and 1 was discarded due to low quality. 18 DWI images were analyzed for ADC. A summary of age and BMI parameters is shown in Table 1. In the TLCO method, layer 1 is the outermost section of the kidney. In the TEO method, 1 represents the lower pole of the kidney. Spearman correlation tests revealed significant (P<0.05) negative correlations between age and ASL-perfusion [-0.44 to -0.59] and BMI and ASL-perfusion [-0.39 to -0.42] across three regions. Age-ADC did not report any significant correlation. For BMI-ADC, all TEO sections and 9 of the TLCO layers displayed significant negative correlations [-0.46 to -0.7]. The Mann-Whitney tests indicated significant differences in ASL-Perfusion between different age groups and in ADC-diffusion for different BMI groups [20 of 22 measurements].Discussion
In the context of renal studies, our ASL-Perfusion results align with previous research. Shimizu et al8. demonstrated higher perfusion in younger HV [157 ± 38.37 ml/min/100g] compared to older individuals [117.42 ± 24.03 ml/min/100g], similar to our findings. Cox et al4. highlighted cortex perfusion differences between age groups (279 ± 75 for age<40, 232 ± 57 for age >40). Li LP et al9. identified BMI and age as confounding factors for cortical blood flow measured with ASL, similar to our observations. Regarding DWI-ADC, Suo et al10. Findings, showing a significant correlation between age and ADC, are contrary to ours, likely due to varying DWI parameters such as different b values [0, 600] s/mm2 and a distinct age threshold of 50 years. Conversely, The results of Ebrahimi11 et al., linking higher BMI to decreased ADC values, are in the same line with our study despite differing BMI thresholds (BMI<30 and BMI>30). To investigate deeper into aging and BMI effects, a broader study involving diverse age and BMI ranges is essential for precise quantification of renal perfusion and diffusion.Conclusion
Age and BMI are some of the main parameters used to evaluate if renal laboratory tests are within a healthy range. Also, ASL and DWI are promising non-invasive techniques to evaluate kidney function. In this study. Renal perfusion throughout the kidney appears to decrease with aging while Renal diffusion seems to be not sensible to age. Conversely it seems that while the renal medulla perfusion is lower with higher BMIs, the renal cortex perfusion is not sensible to BMI. Regarding ADC, our results point out that ADC values decrease with higher BMI values. Additional investigations with a broader population are required to validate the results here shown.Acknowledgements
The authors thank Dr. Bernd Kühn (Siemens Healthcare AG, Erlangen, DE) for providing the ASL WIP sequence.References
- Sandilands EA, Dhaun N, Dear JW, Webb DJ. Measurement of renal function in patients with chronic kidney disease. Br J Clin Pharmacol. 2013 Oct;76(4):504-15. doi: 10.1111/bcp.12198. PMID: 23802624; PMCID: PMC3791974.
- Mora-Gutiérrez JM, Garcia-Fernandez N, Slon Roblero MF, Páramo JA, Escalada FJ, Wang DJ, Benito A, Fernández-Seara MA. Arterial spin labeling MRI is able to detect early hemodynamic changes in diabetic nephropathy. J Magn Reson Imaging. 2017 Dec;46(6):1810-1817. doi: 10.1002/jmri.25717. Epub 2017 Apr 6. PMID: 28383796.
- Jerome NP, Caroli A, Ljimani A. Renal Diffusion-Weighted Imaging (DWI) for Apparent Diffusion Coefficient (ADC), Intravoxel Incoherent Motion (IVIM), and Diffusion Tensor Imaging (DTI): Basic Concepts. Methods Mol Biol. 2021;2216:187-204. doi: 10.1007/978-1-0716-0978-1_11. PMID: 33476001; PMCID: PMC9703200.
- Cox EF, Buchanan CE, Bradley CR, Prestwich B, Mahmoud H, Taal M, Selby NM, Francis ST. Multiparametric Renal Magnetic Resonance Imaging: Validation, Interventions, and Alterations in Chronic Kidney Disease. Front Physiol. 2017 Sep 14;8:696. doi: 10.3389/fphys.2017.00696. PMID: 28959212; PMCID: PMC5603702.
- Gounden V, Bhatt H, Jialal I. Renal Function Tests. [Updated 2023 Jul 17]. In: StatPearls [Internet]. Treasure Island (FL): StatPearls Publishing; 2023 Jan-. Available from: https://www.ncbi.nlm.nih.gov/books/NBK507821/.
- Piskunowicz M, Hofmann L, Zuercher E, Bassi I, Milani B, Stuber M, et al. A new technique with high reproducibility to estimate renal oxygenation using BOLD-MRI in chronic kidney disease. Magnetic resonance imaging 2015 Apr;33:253–61.
- Sanmiguel LC, De Visschere P, Speeckaert M, Pullens P. A NEW METHOD TO ANALYSE RENAL PERFUSION: A PROOF OF CONCEPT, 2023 ISMRM Annual Congress Toronto.
- Shimizu K, Kosaka N, Fujiwara Y, Matsuda T, Yamamoto T, Tsuchida T, Tsuchiyama K, Oyama N, Kimura H. Arterial Transit Time-corrected Renal Blood Flow Measurement with Pulsed Continuous Arterial Spin Labeling MR Imaging. Magn Reson Med Sci. 2017 Jan 10;16(1):38-44. doi: 10.2463/mrms.mp.2015-0117. Epub 2016 May 9. PMID: 27170422; PMCID: PMC5600042.
- Li LP, Tan H, Thacker JM, Li W, Zhou Y, Kohn O, Sprague SM, Prasad PV. Evaluation of Renal Blood Flow in Chronic Kidney Disease Using Arterial Spin Labeling Perfusion Magnetic Resonance Imaging. Kidney Int Rep. 2017 Jan;2(1):36-43. doi: 10.1016/j.ekir.2016.09.003. Epub 2016 Sep 13. PMID: 28868513; PMCID: PMC5575771.
- Suo, S.-T., Cao, M.-Q., Ding, Y.-Z., Yao, Q.-Y., Wu, G.-Y., & Xu, J.-R. (2014). Apparent diffusion coefficient measurements of bilateral kidneys at 3 T MRI: Effects of age, gender, and laterality in healthy adults. In Clinical Radiology (Vol. 69, Issue 12, pp. e491–e496). Elsevier BV. https://doi.org/10.1016/j.crad.2014.08.009.
- Ebrahimi B, Saad A, Jiang K, Ferguson CM, Tang H, Woollard JR, Glockner JF, Textor SC, Lerman LO. Renal Adiposity Confounds Quantitative Assessment of Markers of Renal Diffusion With MRI: A Proposed Correction Method. Invest Radiol. 2017 Nov;52(11):672-679. doi: 10.1097/RLI.0000000000000389. PMID: 28562413; PMCID: PMC5633488.
Figures
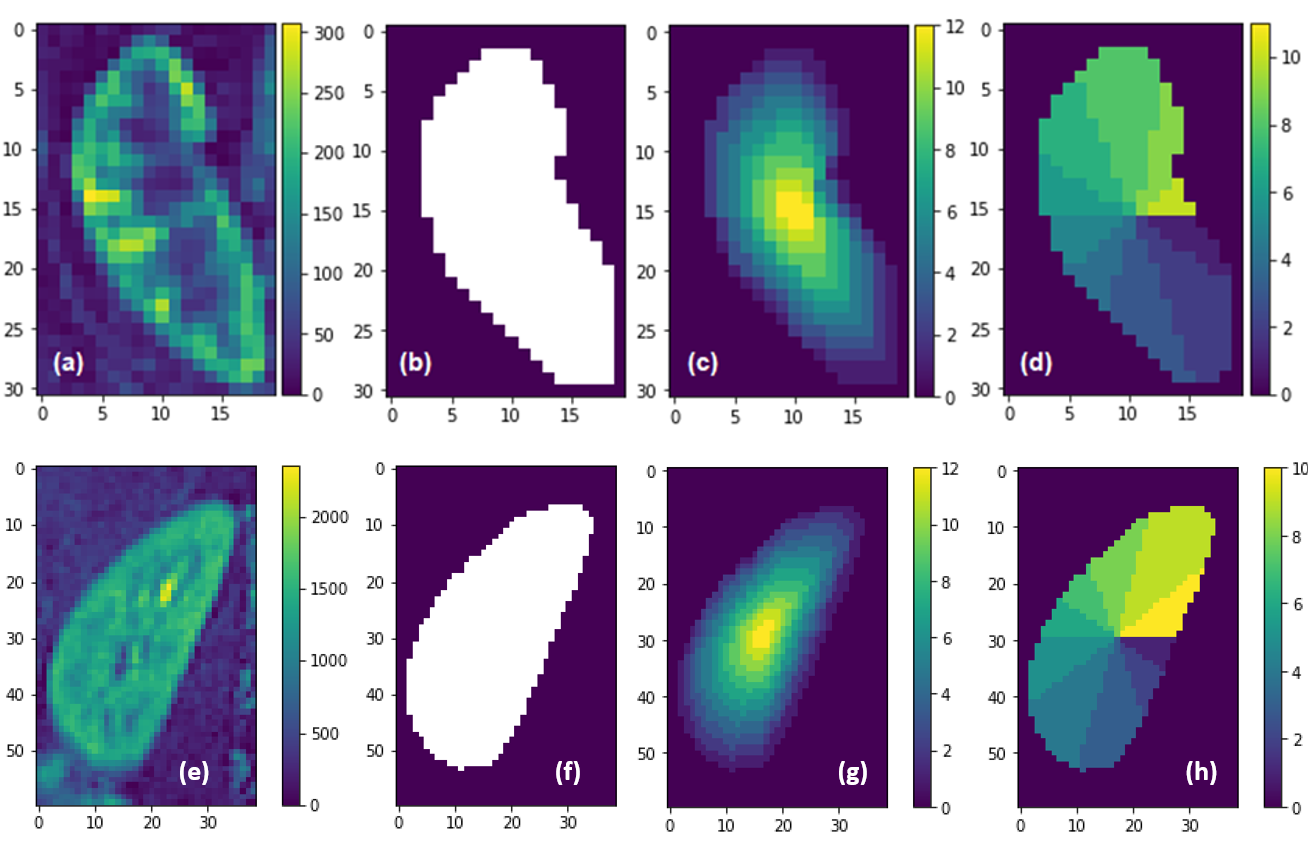
Figure. 1 (a) The RBF map from the human kidney [ml/min/100g], (b) The mask image of the same kidney, (c) the TLCO method applied to the mask image, (d) TEO method applied to the mask image. (e) The ADC map [$$$mm^{2}$$$/2] from a human kidney, (f) The mask image of the same kidney, (g) the TLCO method applied to the mask image, and (h) the TEO method applied to the mask image.
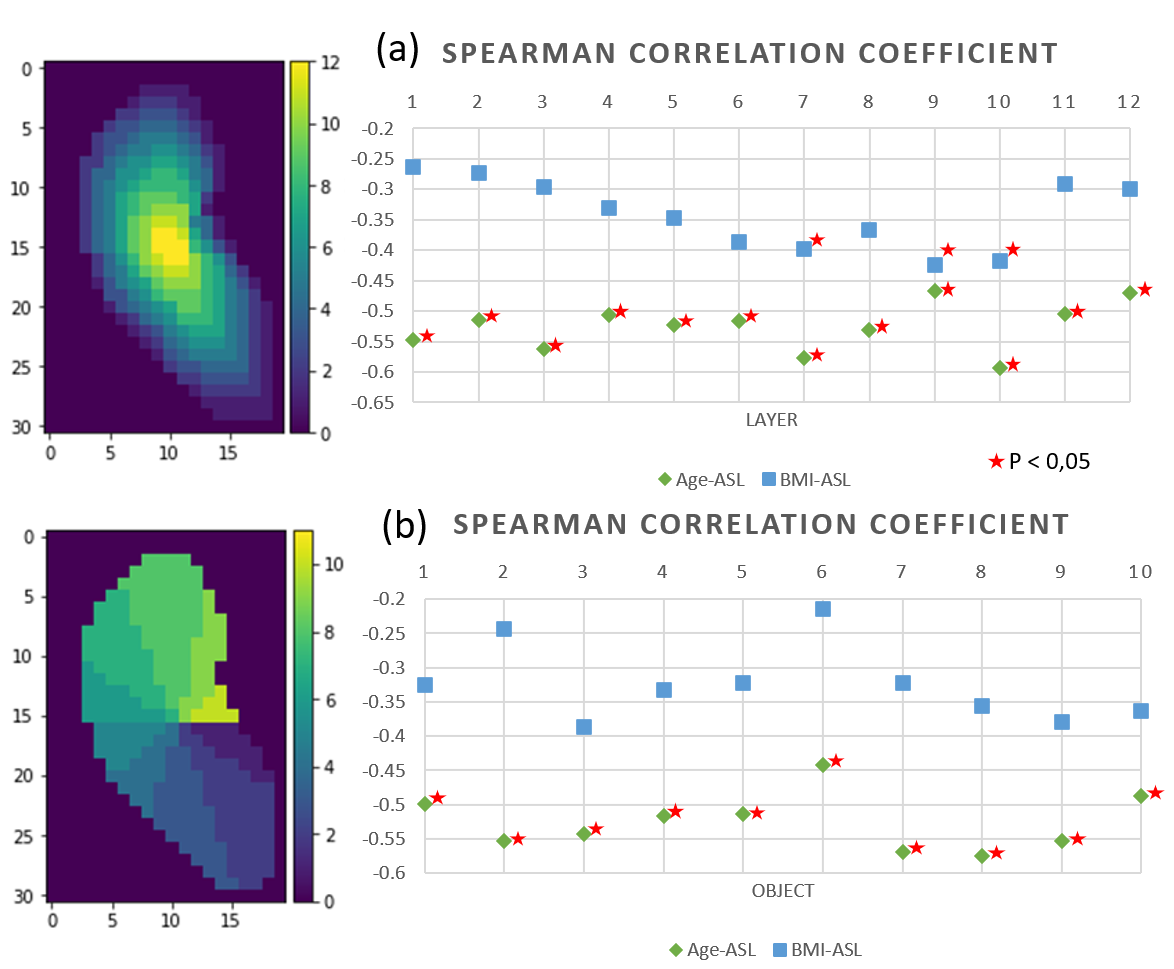
Figure. 2 ASL correlations: (a) Spearman correlation coefficients in the TLCO method (b) Spearman correlation coefficients in the TEO method. Green for Age-ASL results, Blue for BMI-ASL results, and red star represents statistical significance (P value<0.05).
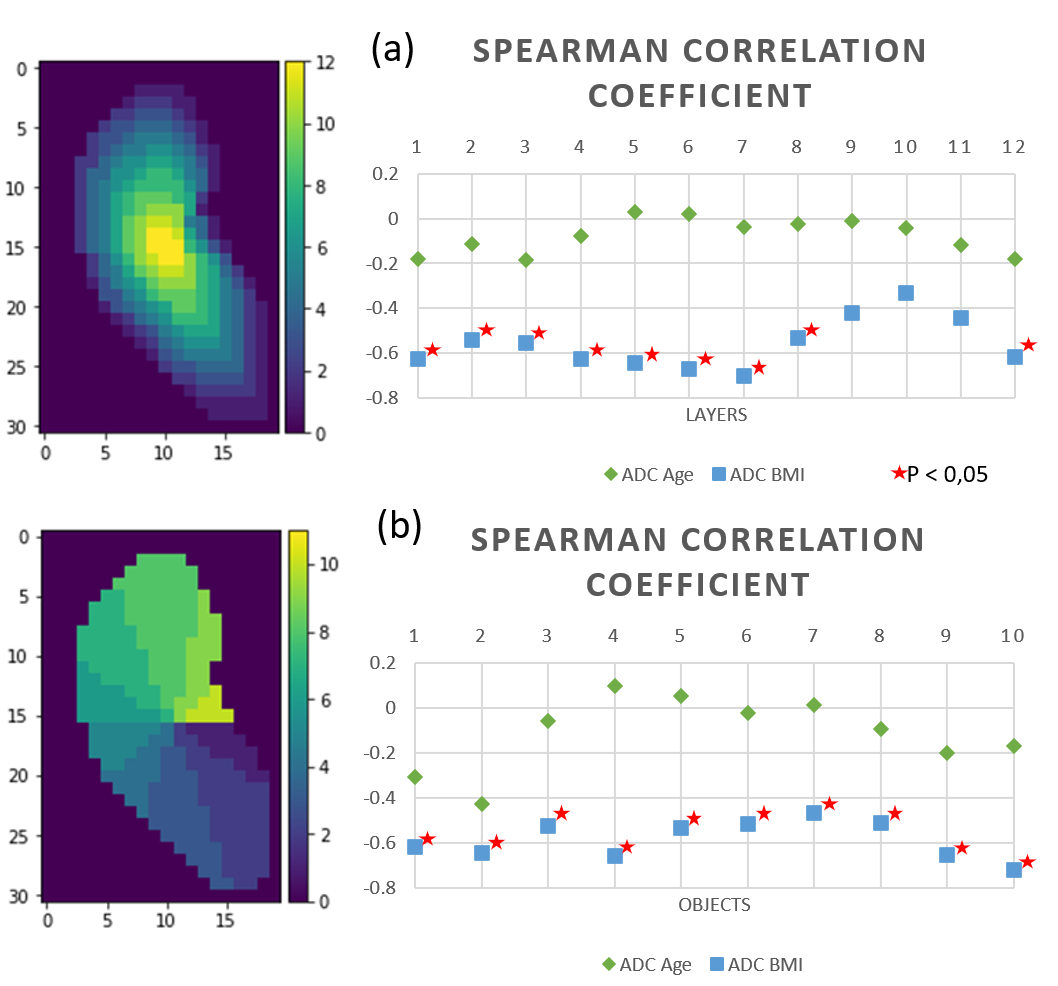
Figure. 3 ADC correlations: (a) Spearman correlation coefficients in the TLCO method (b) and Spearman correlation coefficients in the TEO method. Green for ADC-Age results, Blue for ADC-BMI results, red star represents statistical significance (P value<0.05).
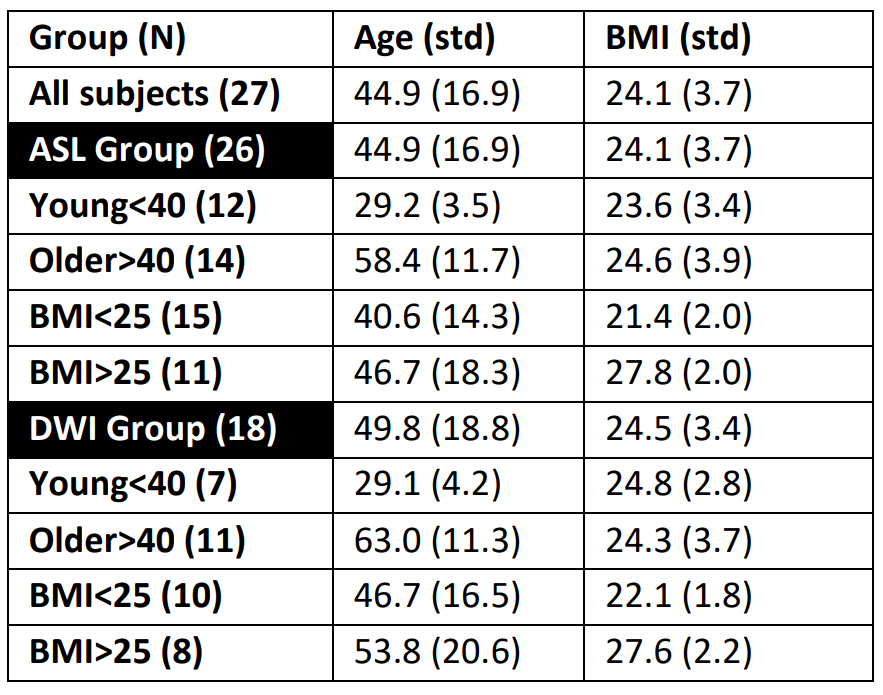
Table 1. Summary of the participants.
DOI: https://doi.org/10.58530/2024/2889