2888
Supporting corticomedullary differentiation for kidney ADC mapping with T1-weighted EPI1Perspectum Ltd, Oxford, United Kingdom
Synopsis
Keywords: Kidney, Kidney
Motivation: Previous studies have demonstrated a correlation between kidney fibrosis and corticomedullary difference in apparent diffusion coefficient (ADC). However, separately measuring ADC in cortex and medulla is challenging due to the low contrast between the tissues.
Goal(s): To facilitate measurement of corticomedullary ADC.
Approach: T1-weighted, distortion-matched echo planar imaging (EPI) with high corticomedullary contrast were acquired in addition to diffusion weighted EPI. Regions-of-interest were performed in the T1-weighted images and propagated to the distortion-matched ADC maps to obtain measurements.
Results: Corticomedullary ADC differences were obtained in four datasets from two healthy volunteers with values within the range of previously published values.
Impact: T1-weighted, distortion-matched EPI with high corticomedullary contrast greatly facilitates measurements of cortex and medulla in diffusion weighted EPI.
Introduction
Studies have shown a correlation between kidney fibrosis and the apparent diffusion coefficient (ADC) difference between cortex and medulla [1, 2]. The delta may also be more reproducible across scanners than simply cortex or medulla ADC individually as it normalises for bias of any particular scanner [3]. However, the relative difference between cortex and medulla diffusion is small, approximately 10% and less in fibrotic kidneys [1], which makes accurate definition of the two tissues challenging.Approaches to facilitate cortex and medulla ADC measurements have primarily included using the T2-weighted b=0 image for measurements [4, 5]. However, corticomedullary T2 contrast is also low which can result in measurement errors and large observer variability.
Corticomedullary contrast is typically significantly better in T1-weighted images than T2 or diffusion weighted images. T1 maps are often acquired clinically using Cartesian trajectories, but registration to DWI with different contrast, respiratory motion and geometric distortion is non-trivial [6]. Here we explore a novel approach to support cortex and medulla measurements in kidney ADC, using rapidly acquired T1-weighted EPI acquisition.
Methods
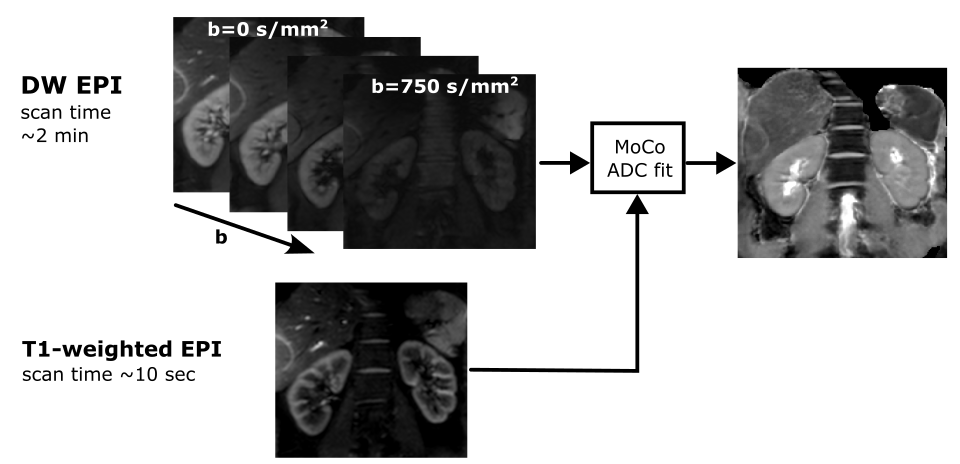
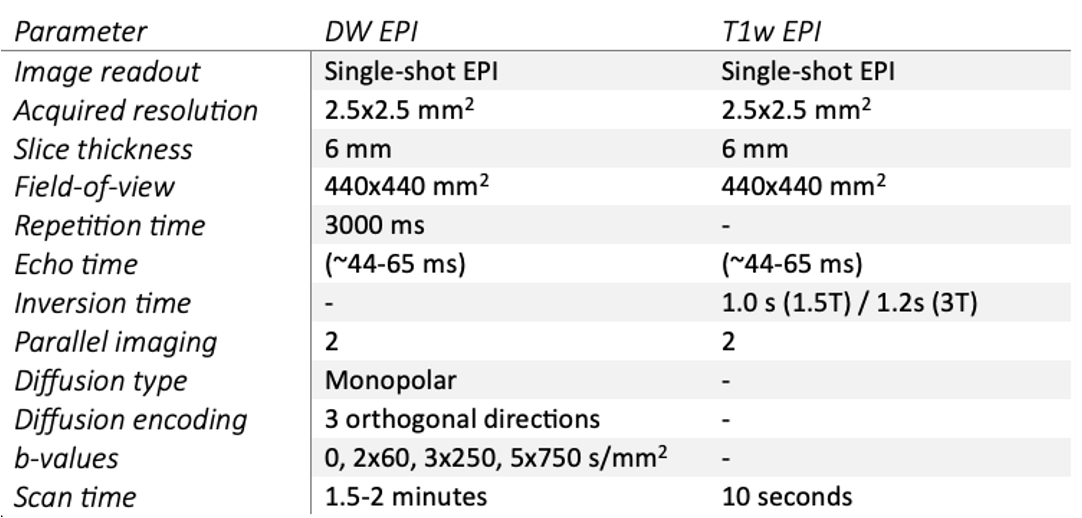
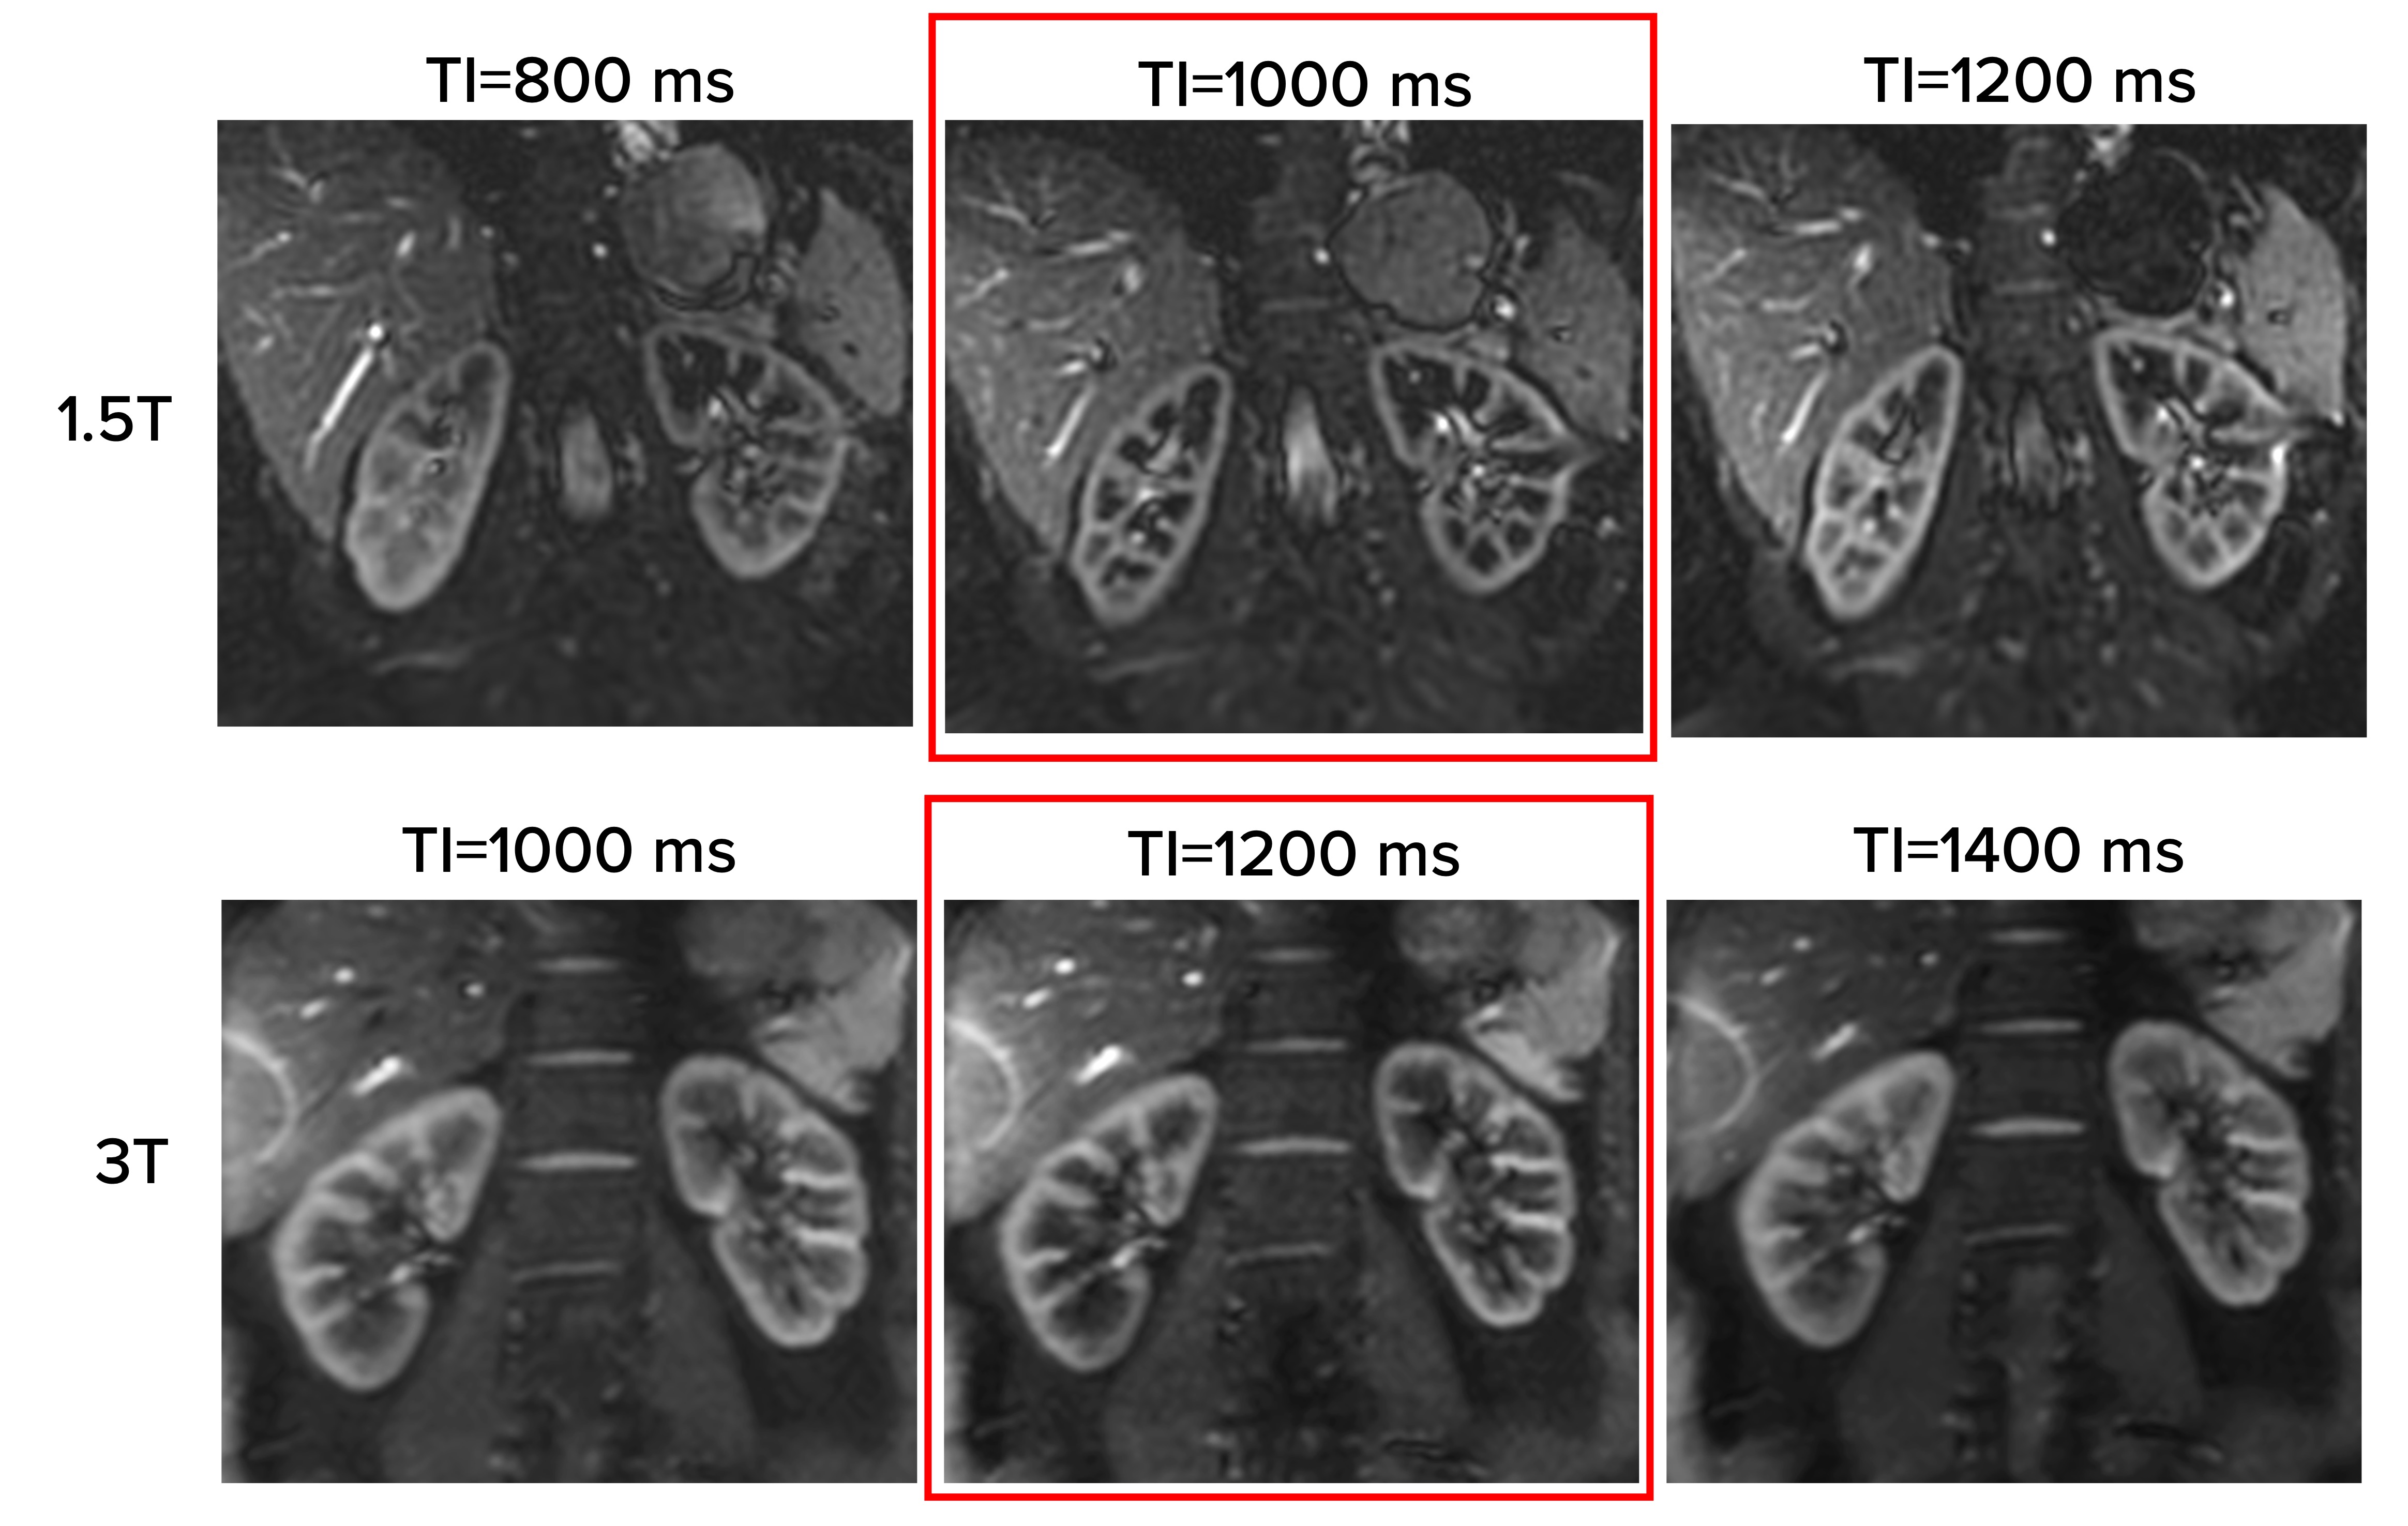
Apart from the acquisition of diffusion weighted EPI with different b-values and number of averages, the proposed method involves acquiring an additional T1-weighted EPI images (Figure 1). The T1-weighted EPI image has similar imaging parameters to the DWI sequence, except for the absence of diffusion encoding and the use of an inversion pulse to introduce strong T1 weighting (Table 1). The optimal inversion time (TI) for corticomedullary contrast was explored on both 1.5T and 3T with TI ranging from 800 ms to 1600 ms with 200 ms increments. T1-weighted EPI from this experiment are shown in Figure 2. Optimal TI was 1000 ms and 1200 ms for 1.5T and 3T, respectively.Because of the identical settings, geometrical distortion was similar for DW and T1-weighted EPI which facilitated co-registration between the images. Image registration was performed, first for the free-breathing DWI data using a PCA-based non-linear registration implemented with Advanced Neuroimaging Tools (ANTS) [7], and then between the T1-weighted EPI and the respiratory registered b=0 image with non-linear ANTS, to align all images. ADC fitting was performed using the motion corrected images, excluding the b=0 image.
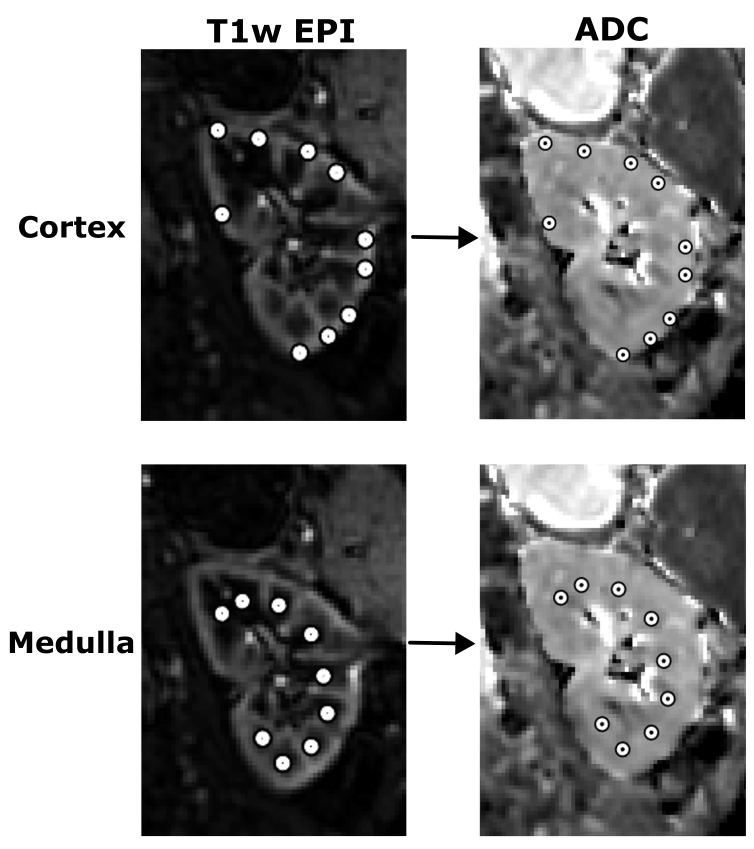
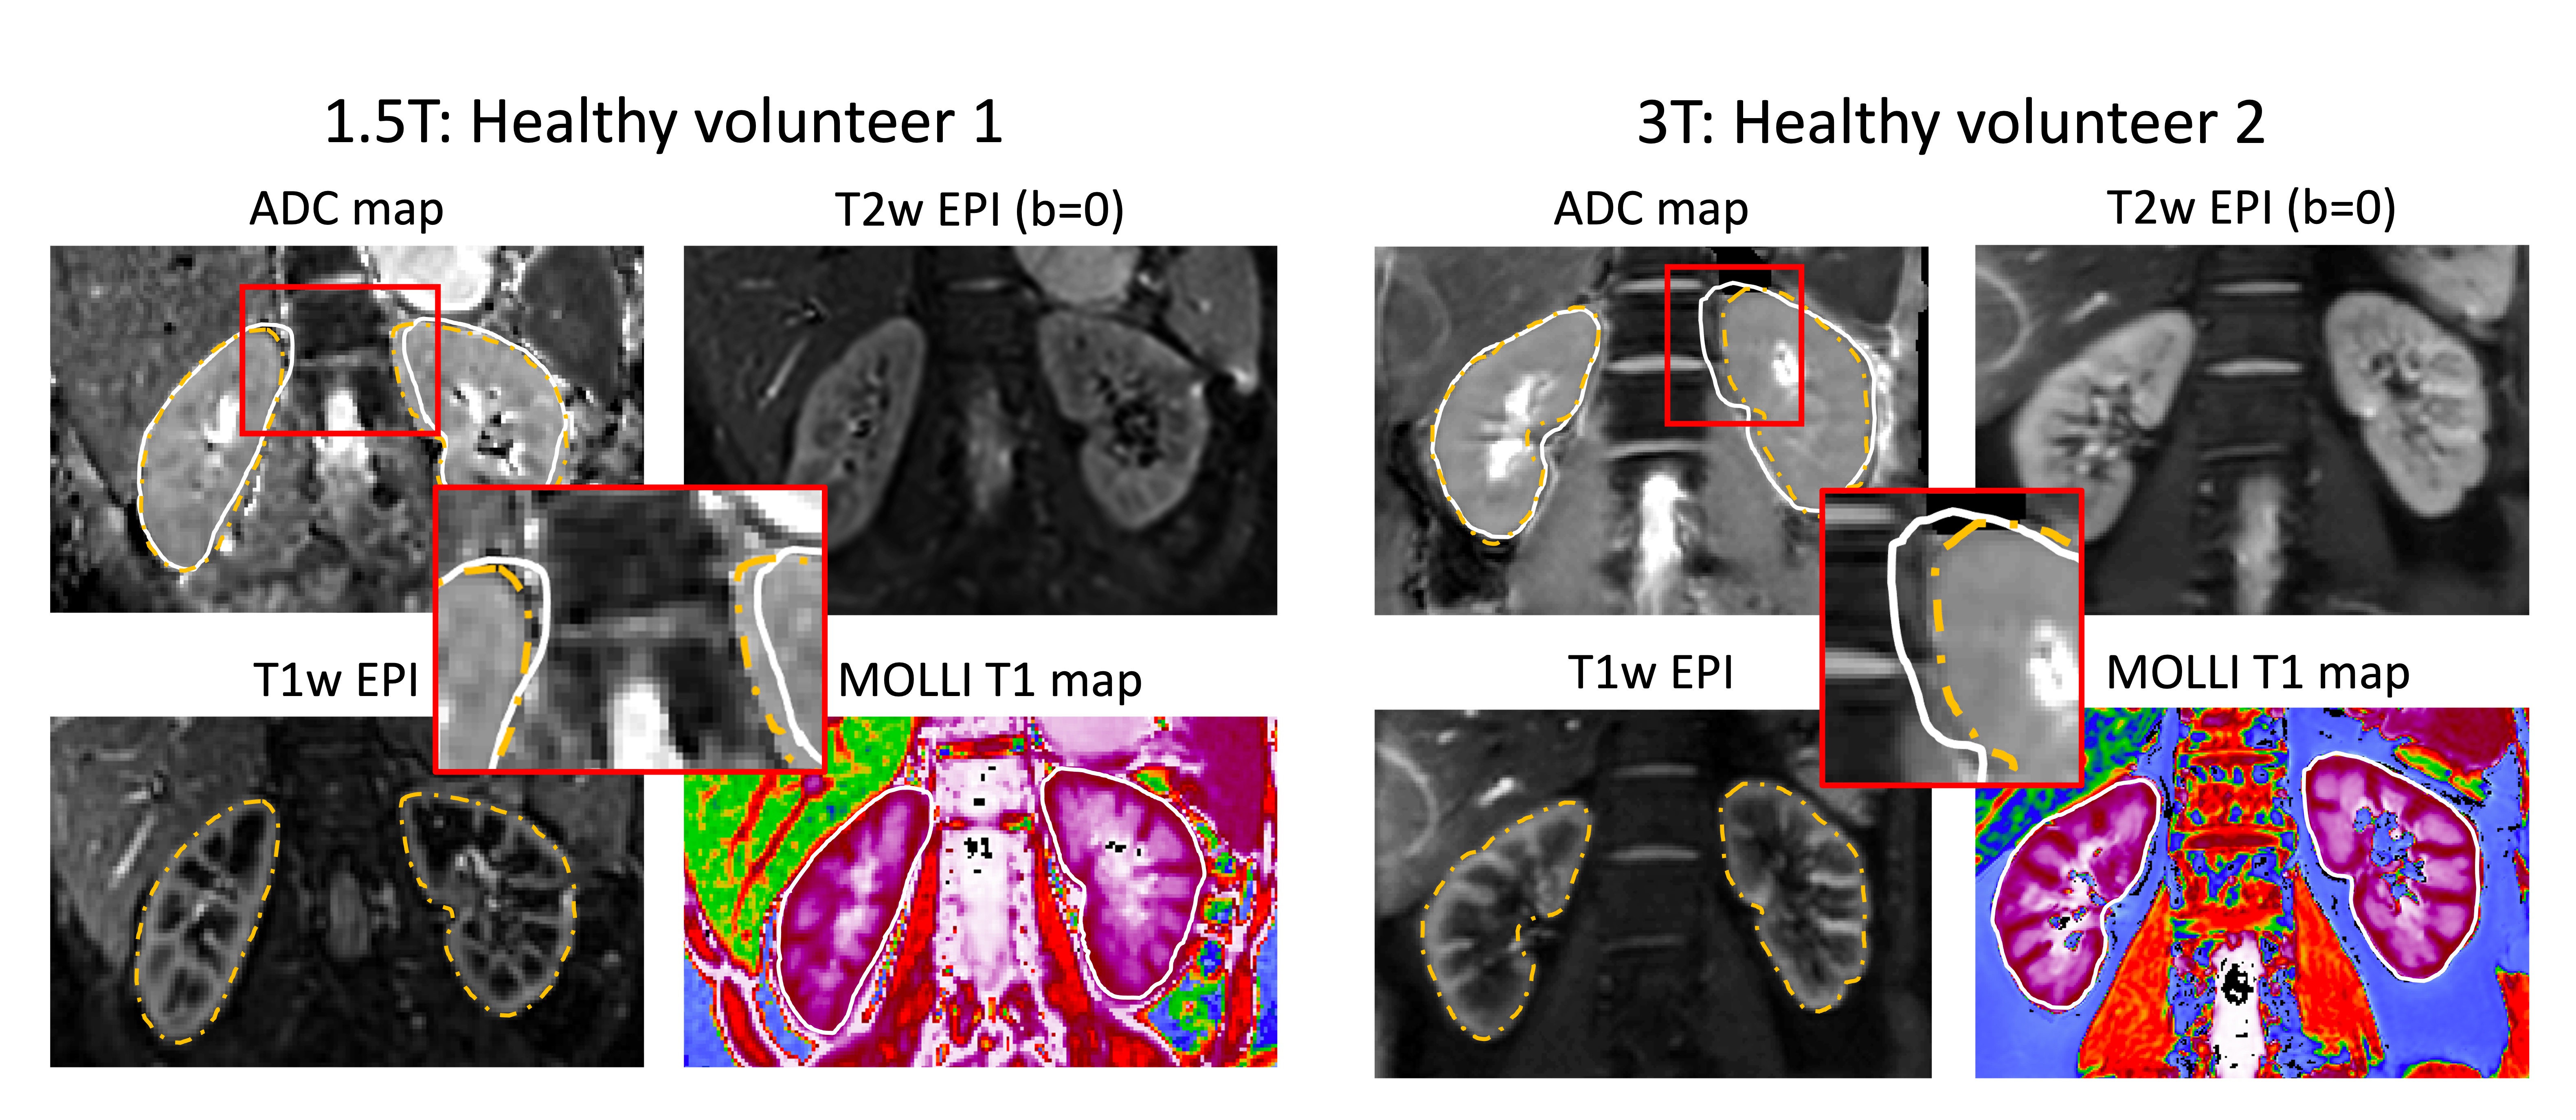
Experiments were performed in two healthy volunteers (HV1 and HV2). HV1 (26-year-old female) was scanned on a 1.5T GE system, while HV2 (40-year-old male) was scanned on a 1.5T Siemens and 3T Siemens (twice). DWI and T1w EPI images were acquired during free-breathing and processed as outlined in Figure 1. Furthermore, MOdified Look-Locker Inversion recovery (MOLLI) T1 maps were acquired as a separate T1-weighted scan commonly used clinically, but using a different, Cartesian trajectory without EPI distortions. Corticomedullary contrast and spatial alignment was visually compared between the ADC images, T2-weighted (b=0) EPI, MOLLI and the proposed T1-weighted EPI. ADC in units of 10-3 mm2/s was measured by placing ROIs (10 for cortex, 9 for medulla), each 4mm diameter, in the T1w EPI and automatically propagated to the co-registered ADC maps, for cortex and medulla separately (Figure 3).
Results
ADC maps, T2-weighted EPI (b=0), T1 maps, and the proposed T1-weighted EPI for both healthy volunteers at 1.5T and 3T are shown in Figure 4. Improved corticomedullary contrast is clearly seen in the T1-weighted compared to T2-weighted EPI, while the MOLLI T1 maps are misaligned relative to the EPI acquisitions as indicated by the kidney contours.Mean+/-standard deviation (SD) ADC for the cortex, medulla and dADC (difference between cortex and medulla) was 1.71+/-0.08, 1.57+/-0.46, and 0.13+/-0.07 10-3 mm2/s, respectively. This dADC is within the range of values previously reported for healthy subjects [2].
Discussion
Here, we have demonstrated the feasibility of using T1-weighted EPI to support corticomedullary measurements in kidney ADC maps. Although this approach comes at a cost of a ~10 second free-breathing scan, it may significantly improve cortical and medullary ADC measurements which has been hampered by poor contrast and high observer variability. T1-weighted EPI corticomedullary contrast is superior to T2-weighted EPI which are conventionally used for measurements, while also having better alignment with the ADC maps than MOLLI T1 maps due to the similar EPI-related distortions. Accurately aligning the MOLLI T1 maps with ADC would require non-linear registration to account for the EPI distortions and currently there are no readily available solutions to this challenge. On the other hand, T1-weighted EPI shows optimal image properties in terms of contrast and geometrical alignment to support corticomedullary ADC measurements. Further studies to evaluate observer repeatability and application in a larger cohort of subjects with potential renal fibrosis are now warranted.Acknowledgements
No acknowledgement found.References
1. Berchtold L, et al. Validation of the corticomedullary difference in magnetic resonance imaging-derived apparent diffusion coefficient for kidney fibrosis detection: a cross-sectional study. Nephrol Dial Transplant. 2020 Jun 1;35(6):937-945.
2. Friedli I, et al. Comparison of readout-segmented and conventional single-shot for echo-planar diffusion-weighted imaging in the assessment of kidney interstitial fibrosis. J Magn Reson Imaging. 2017 Dec;46(6):1631-1640.
3. Friedli I. Renal fibrosis assessment by diffusion-weighted magnetic resonance Imaging. Université de Genève. PhD Thesis, 2017.
4. Bane O, et al. Multiparametric magnetic resonance imaging shows promising results to assess renal transplant dysfunction with fibrosis. Kidney Int. 2020 Feb;97(2):414-420.
5. Echeverria-Chasco R, et al. Multiparametric renal magnetic resonance imaging: A reproducibility study in renal allografts with stable function. NMR Biomed. 2023 Feb;36(2):e4832.
6. Avants BB, et al. A reproducible evaluation of ANTs similarity metric performance in brain image registration. Neuroimage. 2011 Feb 1;54(3):2033-44.
Figures