2885
Intravoxel incoherent motion (IVIM) - based tumor subregions features associates with HER2 expression in breast cancer1The First Hospital of China Medical University, Shenyang, China, 2research Collaboration Team, Siemens Healthineers, Beijing, China, 3research Collaboration Team, Siemens Healthineers, Shanghai, China
Synopsis
Keywords: IVIM, Cancer
Motivation: Intravoxel incoherent motion (IVIM) analysis gives information on diffusion and perfusion and may have a potential for tumor tissue characterization and distinguish the HER2 expression.
Goal(s): This work aims to cluster tumor subregions based on IVIM parameter maps and assess the optimal number of clusters and parameter of tumor subregions related to HER2 expression.
Approach: we used kmeans method to split the ROI into different sub-regions based on IVIM maps, and imaging features to diagnose HER-2 expression.
Results: We found the optimal number of clusters was 3, and F_Median in subregion 1, D_Median and F_Volume in subregion 2 strongly associated with HER2 expression.
Impact: These subregions features are expected as a non-invasive way to obtain diffusion and perfusion information, leading to the discovery of reliable imaging biomarkers for guiding precision cancer therapy.
Introduction
HER-2 is also an important proto-oncogene, and the HER-2 positive expression is closely related to early metastasis, recurrence, and prognosis1. Accurate and non-invasive HER2 expression evaluation techniques are urgently needed. HER2 positive tumors have higher microvascular density, cell density, and intratumoral heterogeneity. Diffusion and perfusion MRI is often used for tumor diagnosis and response assessment due to its sensitivity to relevant tumor tissue characteristics. Diffusion MRI has the potential to probe microstructural tissue properties such as tumor cellularity and membrane integrity, whereas perfusion MRI can be used to evaluate the tumor vascularity. IVIM has been proposed as a completely non-invasive way to obtain diffusion and perfusion information using a single imaging sequence2. The purpose of this study is to use IVIM parameter clustering to identify heterogeneous tumor subregions, evaluate the optimal number of clusters and the correlation between the parameters of each subregion and HER2 expression.Methods
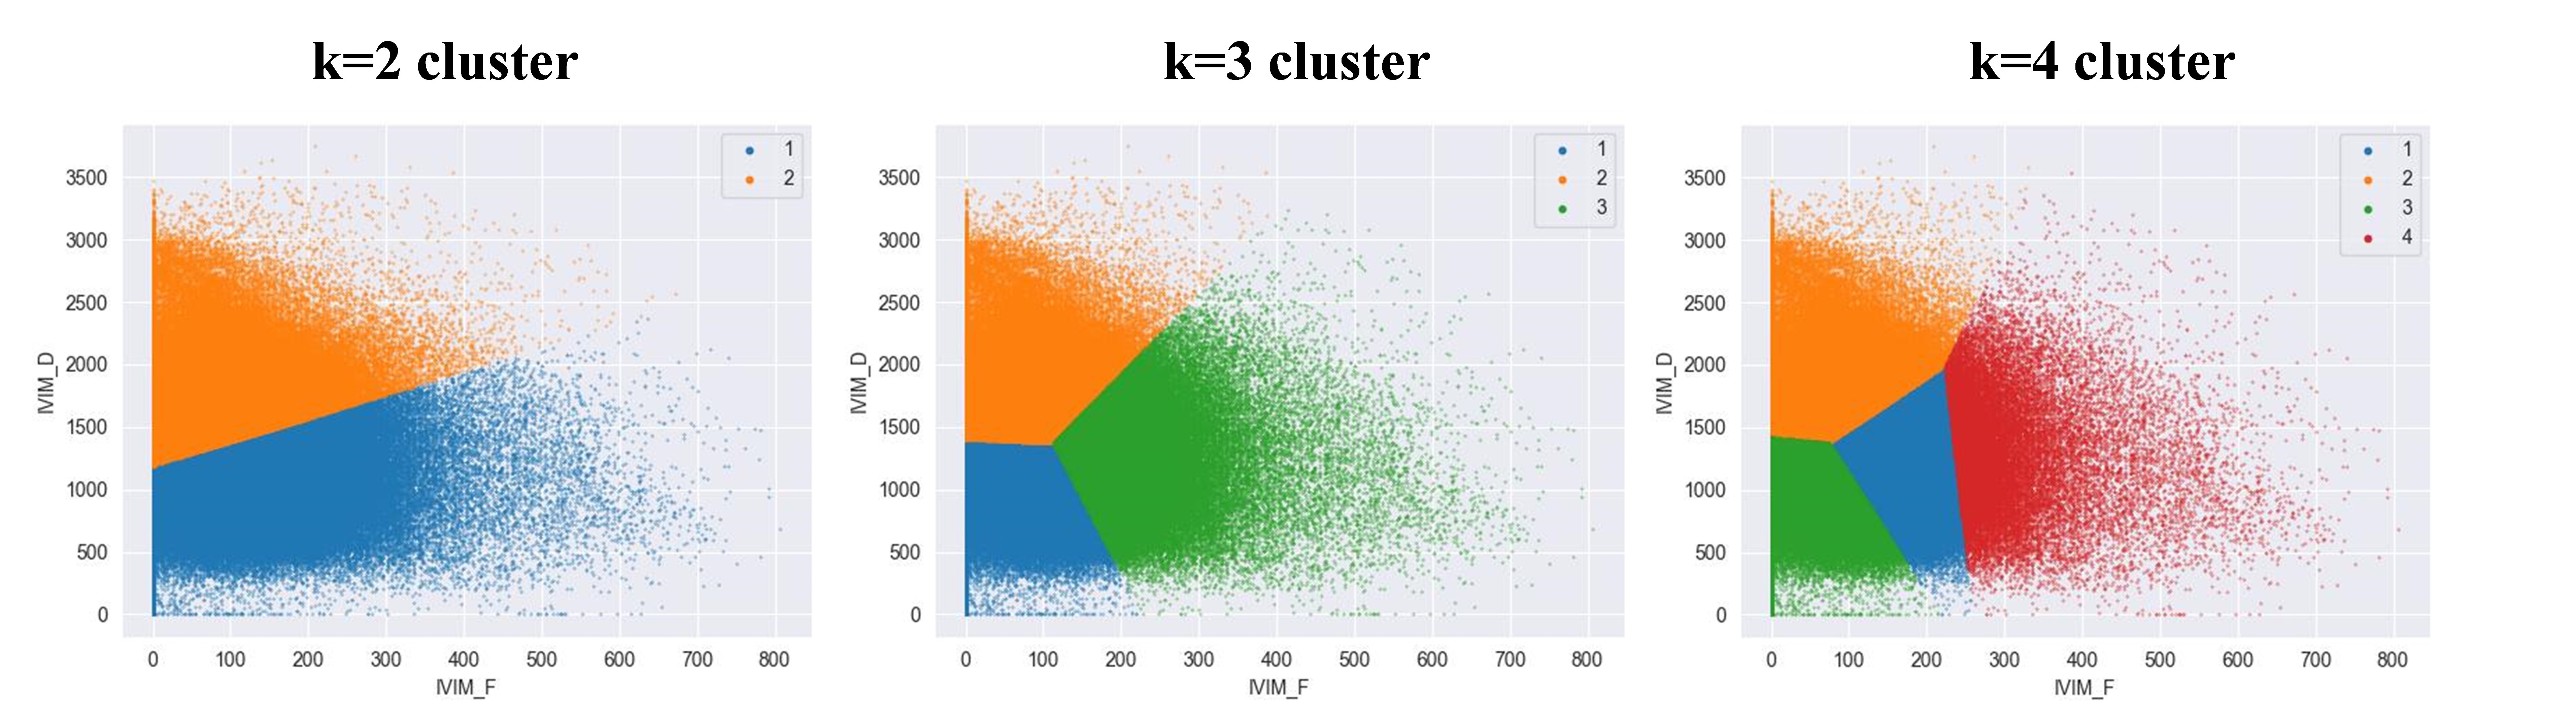
133 women diagnosed with breast IDC by biopsy confirmed were examined with multiple b valuediffusion‐weighted imaging at a 3T MRI scanner ((MAGNETOM Skyra, Siemens Healthcare, Erlangen, Germany) to obtain IVIM parameter maps. According to the HER-2 status confirmed with immunohistochemistry results, all the patients were divided into HER2-positive (n=37) and HER2-negative (n=96) groups. The whole tumor’s volume was delineated based on a high b value images (b= 800s/mm2) using a software ITK-SNAP (http://www.itksnap.org/). A T1 contrast-enhancement and T2WI images was referenced to improve the ROI delineation accuracy. Then we used kmeans, a data-driven clustering method to split the ROI into different sub-regions (k is the hyper-parameters) based on the D and F maps. Then we extracted the volume of each sub-region and the first-order features of D and F by FAE(v 0.5.8), respectively. Then we used these features to construct a logistical regression (LR) model to diagnose the HER-2 expression. A Mann-Whitney U test and ROC curve analysis were performed to recognize the features with significant differences (p<0.05).Result
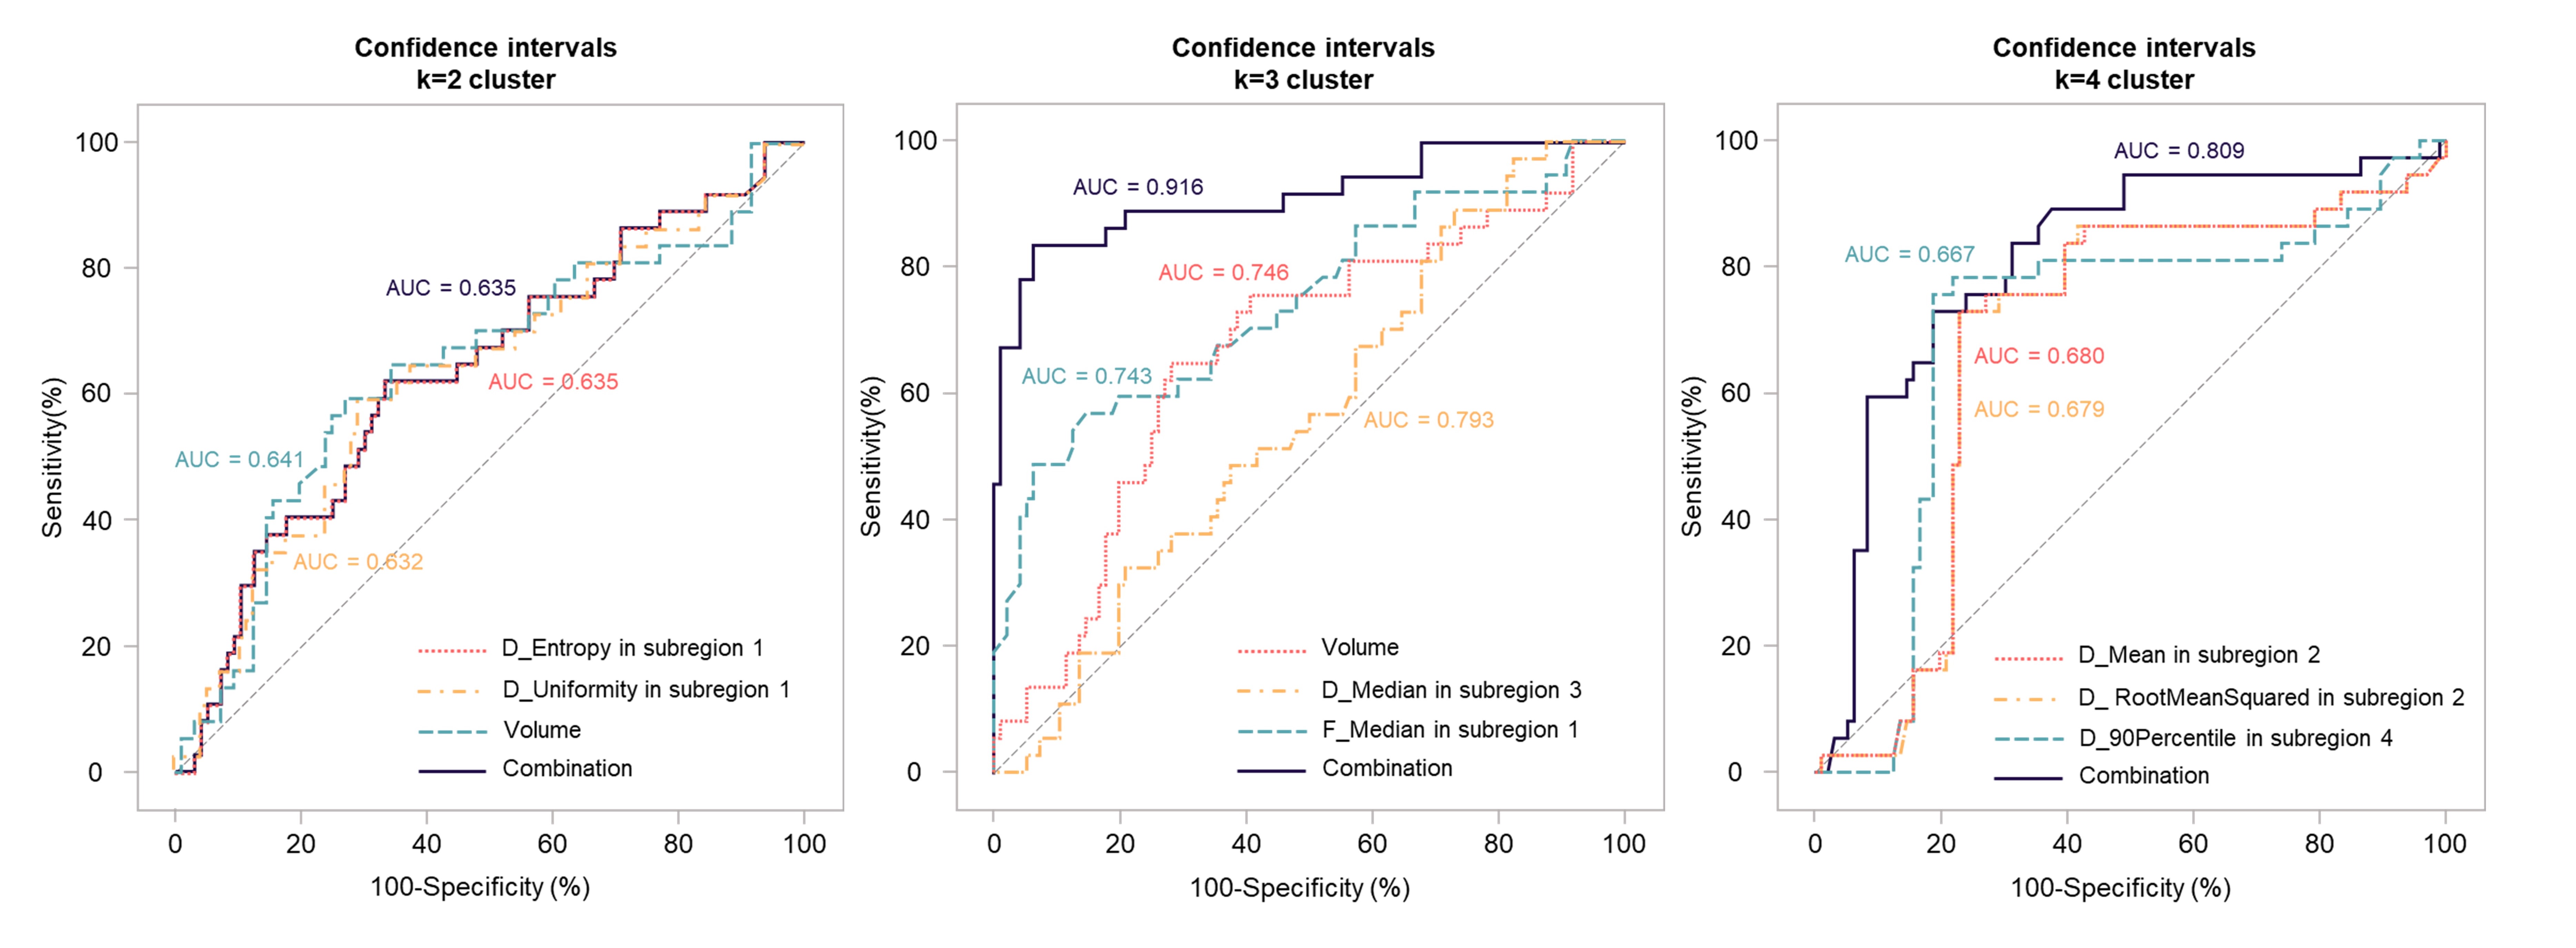
In the k=2 cluster setting, the top three features were Volume (AUC=0.641), D_Entropy (AUC=0.635), D_Uniformity (AUC=0.632) in subregion 1 significantly differed between HER2-positive than negative tumors (all p<0.05). LR analysis showed only D_Entropy was independently associated with HER2 expression.In the k=3 cluster setting, the top three features including F_Median in subregion 1 (AUC=0.743), Volume (AUC=0.746) and D_Median (AUC=0.793) in subregion 2 had AUC of more than 0.700 (all p<0.05) and their combination achieved the highest AUC of 0.916 to distinguish between HER2-positive and negative tumors.
In the k=4 cluster setting, the top three features were D_90Percentile in subregion 4 (AUC=0.694), D_Mean in subregion 2 (AUC=0.680) and D_RootMeanSquared (AUC=0.679) in subregion 2, which significantly differed between two subgroups (all p<0.05). LR analysis showed the combined performance of F_Maximum, D_InterquartileRange and D_RobustMeanAbsoluteDeviation achieved the highest AUC of 0.809.
Thus, the optimal number of clusters was 3, and the biological significance of F_Median in subregion 1, D_Median and Volume in subregion 2 can be explained as the median value of F in the low perfusion/high diffusion subregion, the median value of D and volume of the low perfusion/low diffusion subregion, respectively.
Discussion
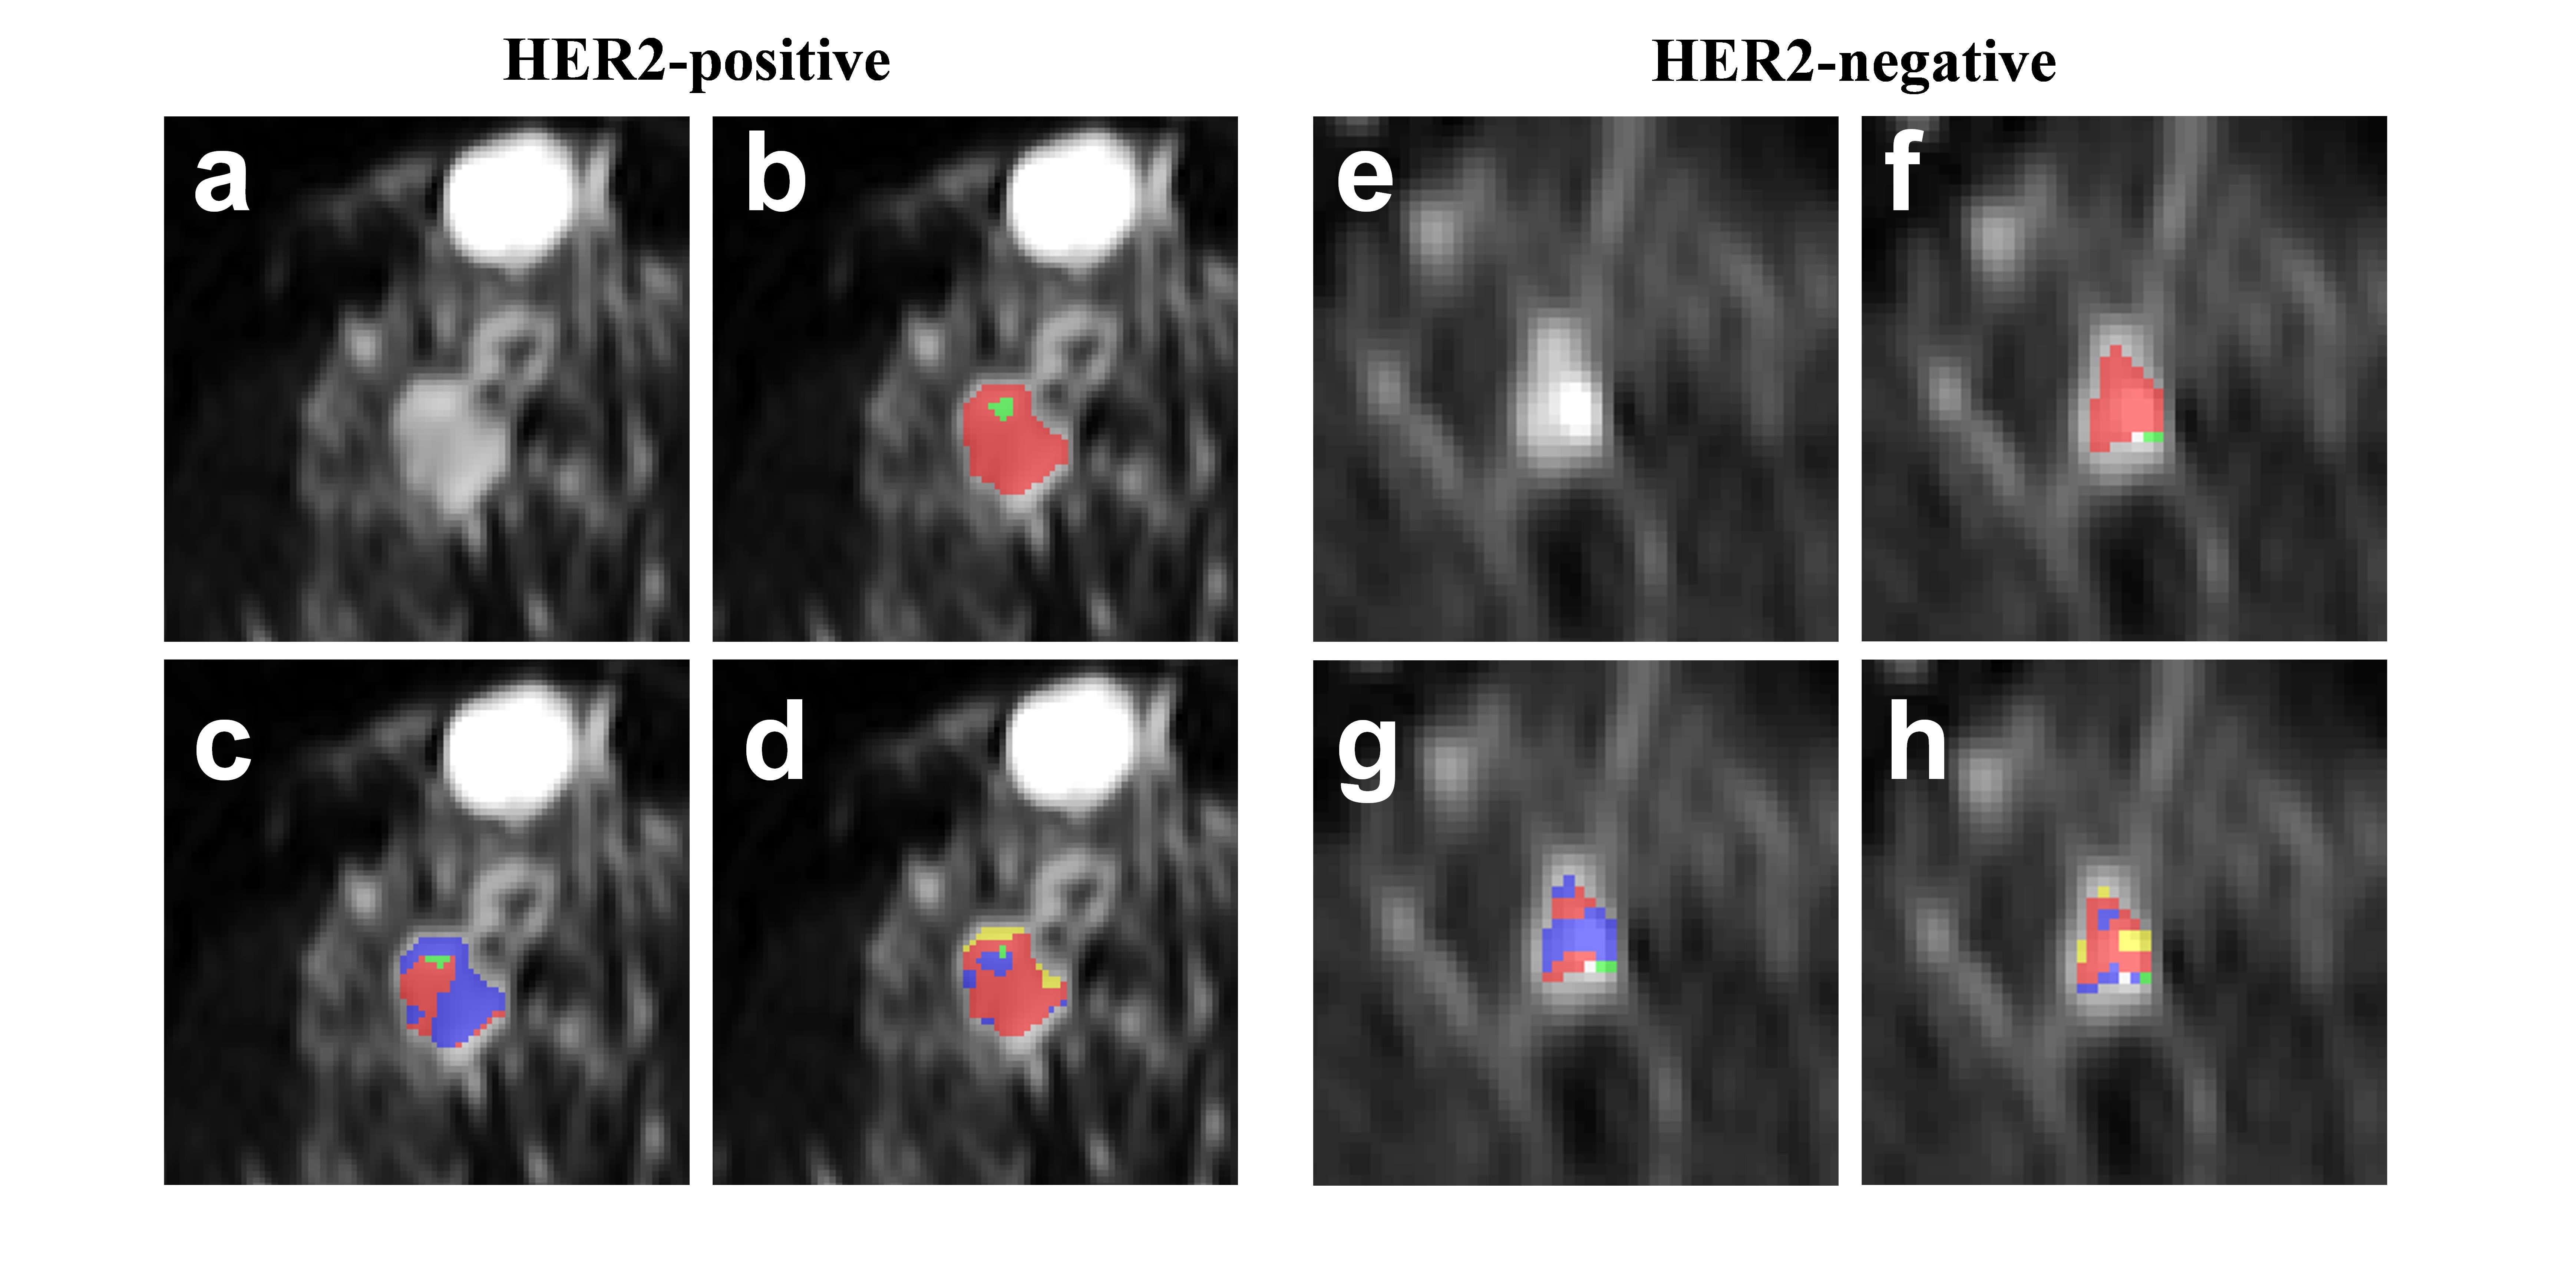
This study presents an IVIM‐based clustering that can be used to identify tumor subregions based on the functional information contained in the IVIM parameters. The results show that when applied to human breast cancer, cluster maps displayed a strong correlation with HER2-based tumor aggressiveness. The IVIM‐based approach does not require an intravenous injection of a contrast agent and is completely noninvasive. In the current result of three clustering, HER2-positive tumors appear to have more neovascularization in the low perfusion/high diffusion subregion, lower volume and higher cell density in the low perfusion/low diffusion subregion, which is consistent with the characteristics of higher aggressiveness3. The combined efficacy of multiple parameters reached AUC=0.916, which is higher than the AUC=0.629 reported in previous studies in distinguishing HER2 positive and negative tumors4. This may be due to the combination of diffusion (D) and perfusion (F) features positioning the more malignant tumor subregions, which corresponds to the hot spots promoting angiogenesis and cell proliferation of HER2. IVIM based tumor subregions visualize tumor spatial heterogeneity, rather than averaging the parameter values of the entire tumor without the potential loss of important information. Ideally, the method should capture the information on heterogeneity contained in the images in a compact way, but also provide a comprehensible interpretation.Conclusion
The IVIM clustering tumor subregion can distinguish the HER2 expression in breast cancers, and the combination of D and F under the three clustering achieved the optimal diagnostic performance with interpretability.Acknowledgements
No acknowledgement found.References
1. information via multimodal deep learning. Comput Struct Biotechnol J. 2021 D Yang J, Ju J, Guo L, Ji B, Shi S, Yang Z, Gao S, Yuan X, Tian G, Liang Y, Yuan P. Prediction of HER2-positive breast cancer recurrence and metastasis risk from histopathological images and clinical ec 23;20:333-342. doi: 10.1016/j.csbj.2021.12.028. PMID: 35035786; PMCID: PMC8733169.
2. Arian A, Seyed-Kolbadi FZ, Yaghoobpoor S, Ghorani H, Saghazadeh A, Ghadimi DJ. Diagnostic accuracy of intravoxel incoherent motion (IVIM) and dynamic contrast-enhanced (DCE) MRI to differentiate benign from malignant breast lesions: A systematic review and meta-analysis. Eur J Radiol. 2023 Oct;167:111051. doi: 10.1016/j.ejrad.2023.111051. Epub 2023 Aug 16. PMID: 37632999.
3. Kim JJ, Kim JY, Suh HB, Hwangbo L, Lee NK, Kim S, Lee JW, Choo KS, Nam KJ, Kang T, Park H. Characterization of breast cancer subtypes based on quantitative assessment of intratumoral heterogeneity using dynamic contrast-enhanced and diffusion-weighted magnetic resonance imaging. Eur Radiol. 2022 Feb;32(2):822-833. doi: 10.1007/s00330-021-08166-4. Epub 2021 Aug 4. PMID: 34345946.
4. You C, Li J, Zhi W, Chen Y, Yang W, Gu Y, Peng W. The volumetric-tumour histogram-based analysis of intravoxel incoherent motion and non-Gaussian diffusion MRI: association with prognostic factors in HER2-positive breast cancer. J Transl Med. 2019 Jul 2;17(1):182. doi: 10.1186/s12967-019-1911-6. PMID: 31262334; PMCID: PMC6604303.
Figures